| Param | Original file | Final file |
|---|---|---|
| Filename | modeM0/AS1A05_012T02_9000002566_17370cztM0_level2.evt | modeM0/AS1A05_012T02_9000002566_17370cztM0_level2_quad_clean.evt |
| Size (bytes) | 575,712,000 | 85,184,640 |
| Size | 549.0 MB | 81.2 MB |
| Events in quadrant A | 3,166,486 | 564,624 |
| Events in quadrant B | 3,289,856 | 565,894 |
| Events in quadrant C | 3,321,851 | 541,277 |
| Events in quadrant D | 7,241,984 | 479,394 |
| Mode M9 | |||
|---|---|---|---|
| Quadrant | BADHDUFLAG | Total packets | Discarded packets |
| A | 0 | 13 | 0 |
| B | 0 | 13 | 0 |
| C | 0 | 13 | 0 |
| D | 0 | 13 | 0 |
| Mode SS | |||
|---|---|---|---|
| Quadrant | BADHDUFLAG | Total packets | Discarded packets |
| A | 0 | 124 | 0 |
| B | 0 | 124 | 0 |
| C | 0 | 124 | 0 |
| D | 0 | 124 | 0 |
| Mode M0 | |||
|---|---|---|---|
| Quadrant | BADHDUFLAG | Total packets | Discarded packets |
| A | 0 | 13312 | 1 |
| B | 0 | 13677 | 1 |
| C | 0 | 13738 | 1 |
| D | 0 | 25855 | 1 |
| Quadrant | Total seconds | Saturated seconds | Saturation percentage |
|---|---|---|---|
| A | 6131 | 103 | 1.679987% |
| B | 6131 | 126 | 2.055130% |
| C | 6131 | 147 | 2.397651% |
| D | 6131 | 1284 | 20.942750% |
Noise dominated data is calculated using 1-second bins in cleaned event files. If a bin has >2000 counts, and if more than 50% of those come from <1% of pixels, then it is considered to be noise-dominated and hence unusable.
| Quadrant | # 1 sec bins | Bins with >0 counts | Bins with >2000 counts | High rate bins dominated by noise | Noise dominated (total time) | Noise dominated (detector-on time) | Marked lightcurve |
|---|---|---|---|---|---|---|---|
| A | 7426 | 6132 | 0 | 0 | 0.00% | 0.00% | 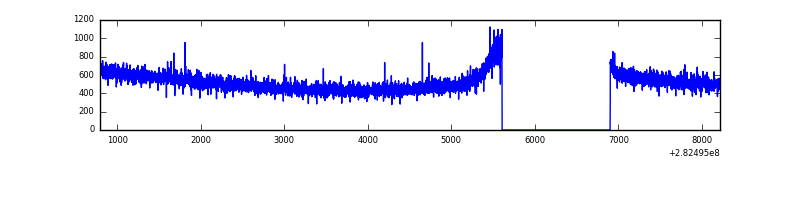 |
| B | 7426 | 6132 | 0 | 0 | 0.00% | 0.00% | 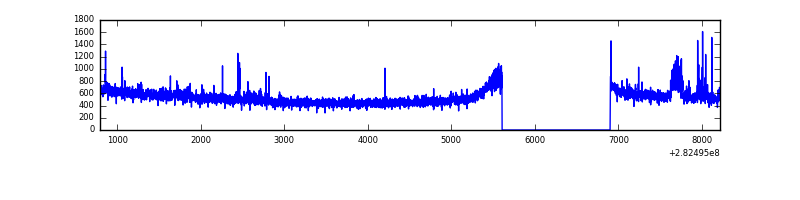 |
| C | 7426 | 6132 | 0 | 0 | 0.00% | 0.00% | 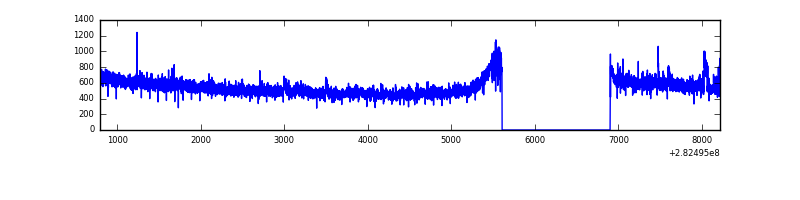 |
| D | 7426 | 6132 | 1057 | 1057 | 14.23% | 17.24% | 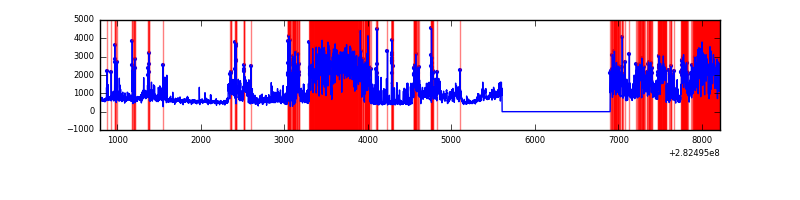 |
Top three noisy pixels from each quadrant. If the there are fewer than three noisy pixels in the level2.evt file, extra rows are filled as -1
| Pixel properties | Quadrant properties | ||||||
|---|---|---|---|---|---|---|---|
| Quadrant | DetID | PixID | Counts | Sigma | Mean | Median | Sigma |
| A | 0 | 226 | 7398 | 40.22 | 823 | 808 | 163.9 |
| A | 12 | 194 | 6084 | 32.2 | 823 | 808 | 163.9 |
| A | 3 | 137 | 5625 | 29.4 | 823 | 808 | 163.9 |
| B | 15 | 35 | 52356 | 337.89 | 818 | 800 | 152.6 |
| B | 0 | 197 | 23881 | 151.27 | 818 | 800 | 152.6 |
| B | 12 | 111 | 16610 | 103.62 | 818 | 800 | 152.6 |
| C | 14 | 238 | 124085 | 675.72 | 791 | 798 | 182.5 |
| C | 3 | 233 | 90414 | 491.17 | 791 | 798 | 182.5 |
| C | 9 | 54 | 5955 | 28.26 | 791 | 798 | 182.5 |
| D | 11 | 176 | 2677518 | 14788.85 | 759 | 741 | 181.0 |
| D | 13 | 232 | 831853 | 4591.79 | 759 | 741 | 181.0 |
| D | 1 | 52 | 374354 | 2064.16 | 759 | 741 | 181.0 |
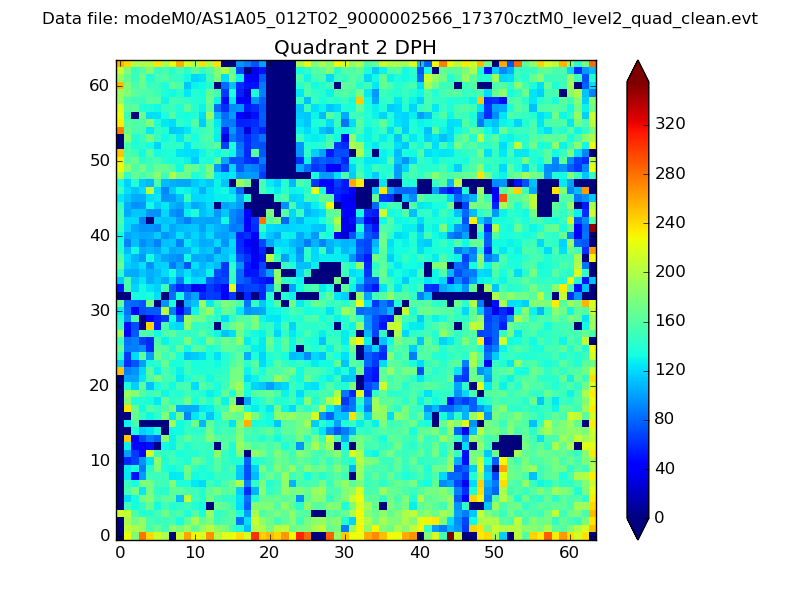
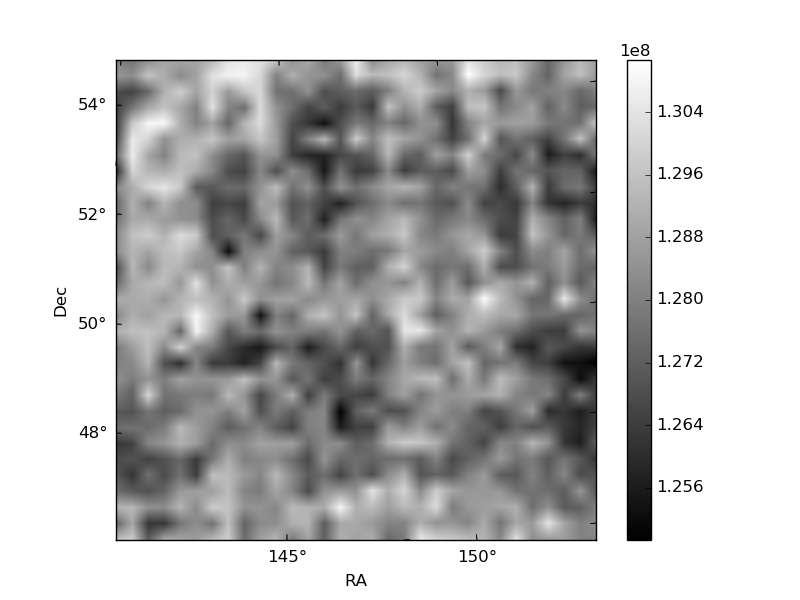
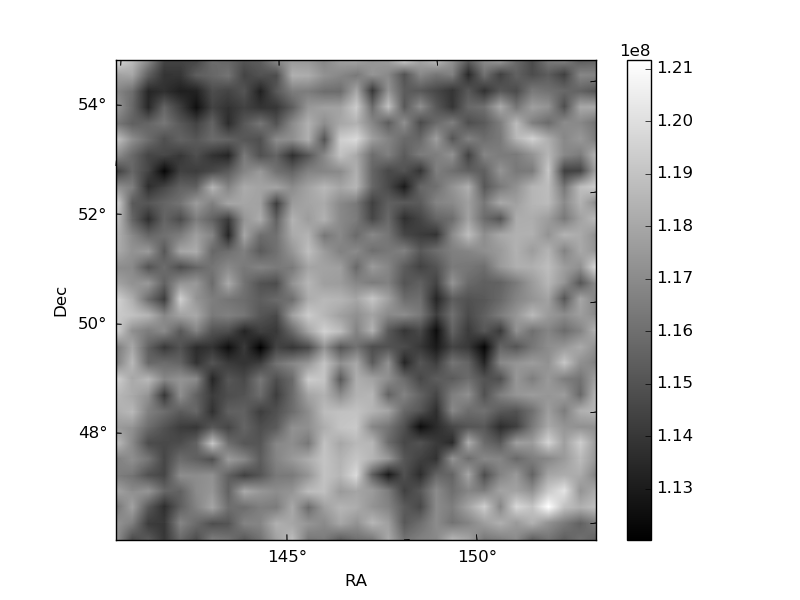
Histogram calculated using DETX and DETY for each event in the final _common_clean file
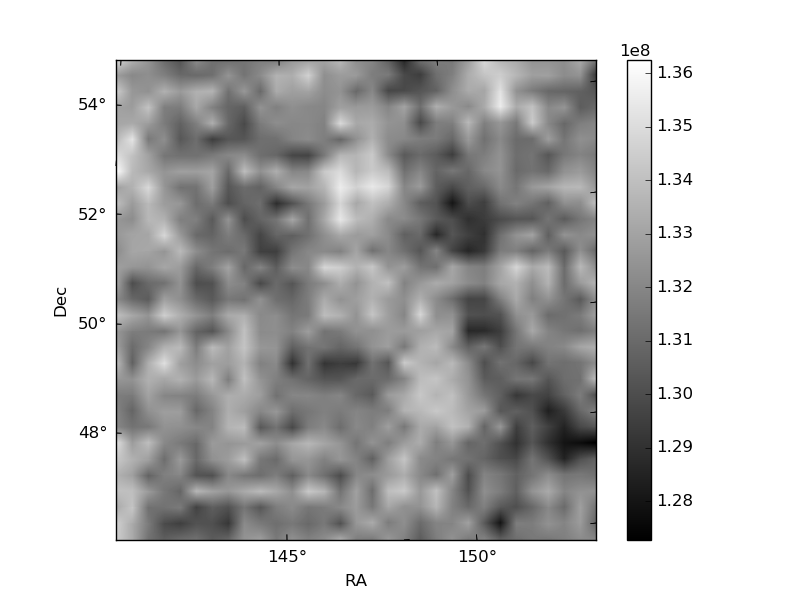
| Quadrant A | 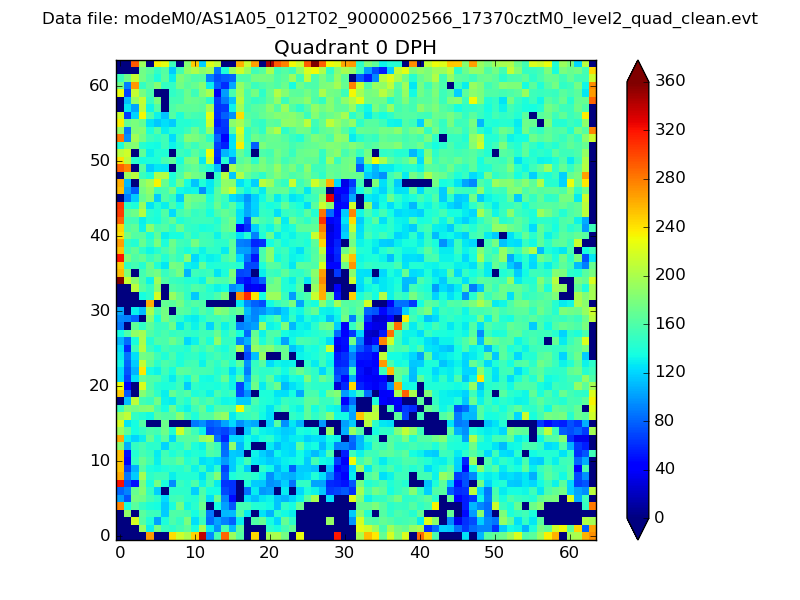 |
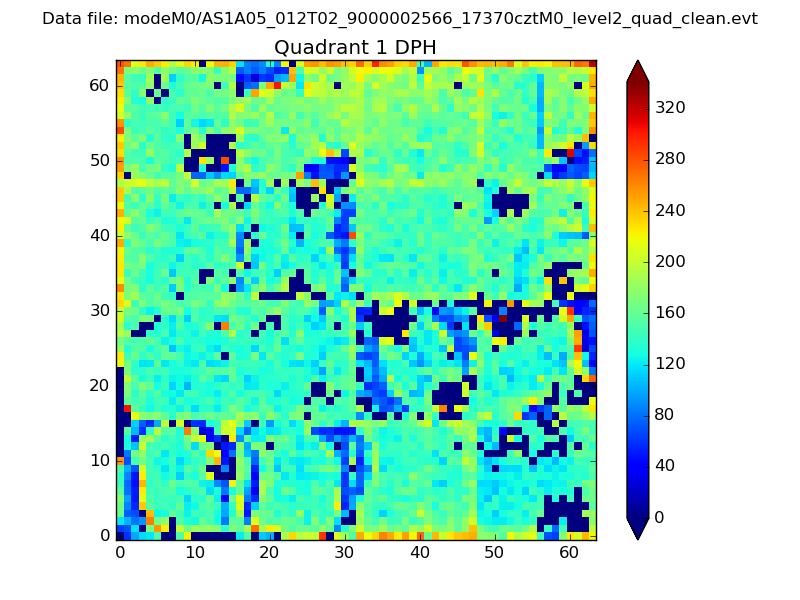 |
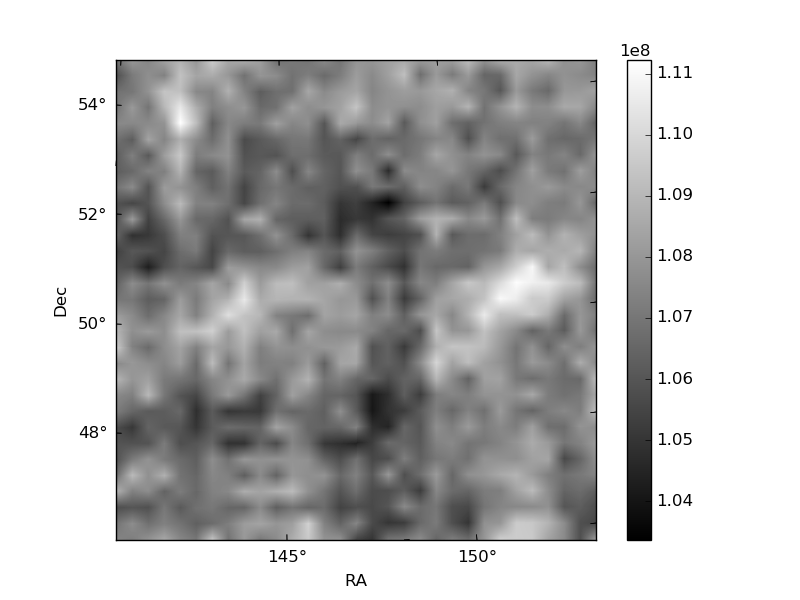
Quadrant B |
|---|---|---|---|
| Quadrant D | 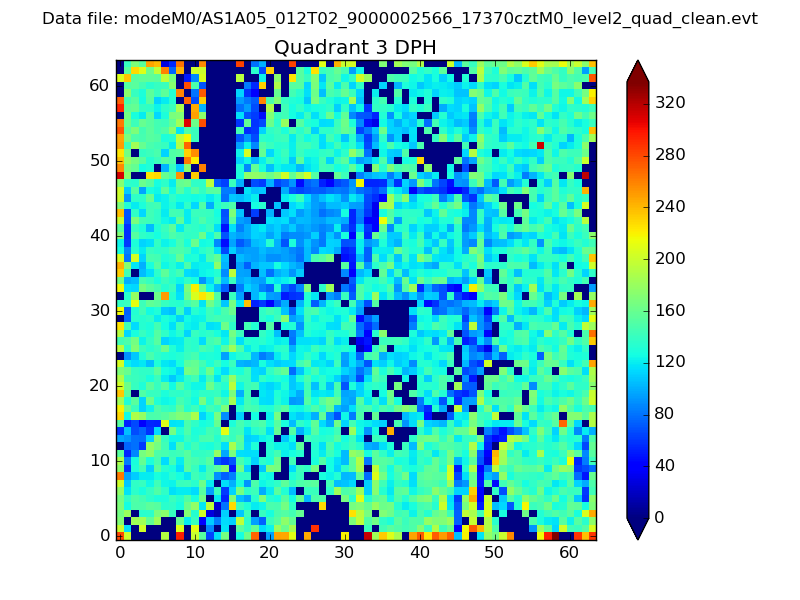 |
 |
Quadrant C |
| Plot type | Count rate plots | Images |
|---|---|---|
| Comparison with Poisson distribution Blue bars denote a histogram of data divided into 1 sec bins. Red curve is a Poisson curve with rate = median count rate of data. |
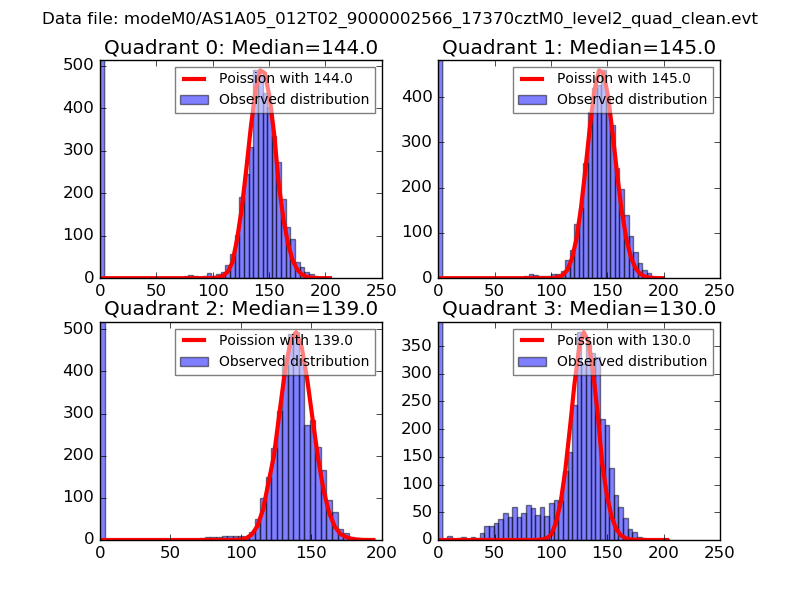 |
 |
| Quadrant-wise count rates Data is divided into 100 sec bins |
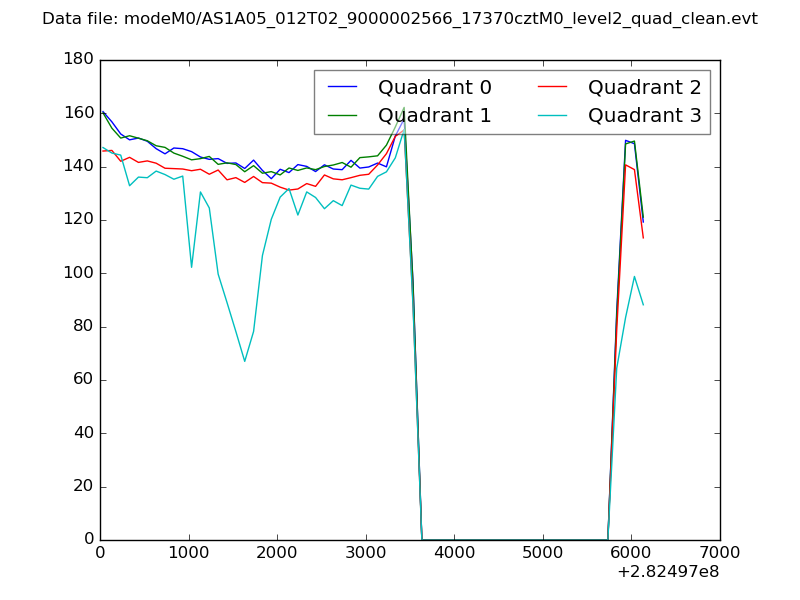 |
|
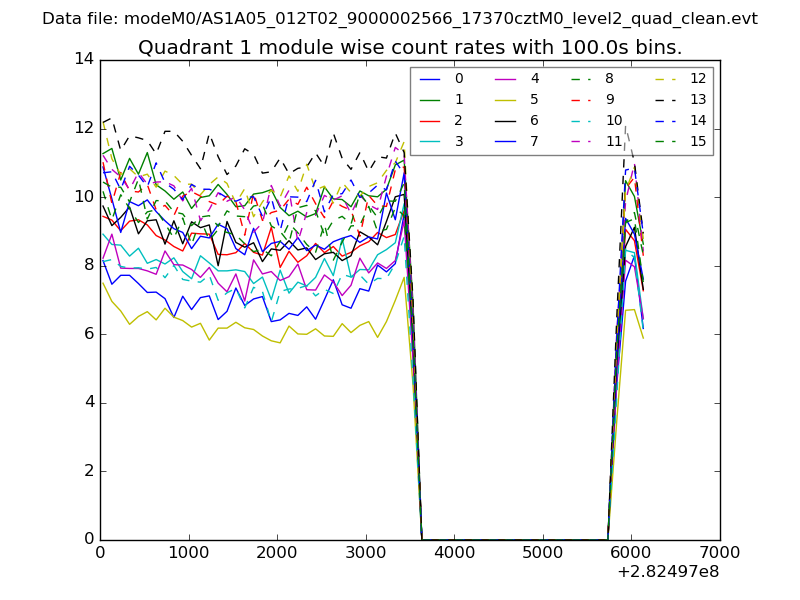
| Module-wise count rates for Quadrant A Data is divided into 100 sec bins |
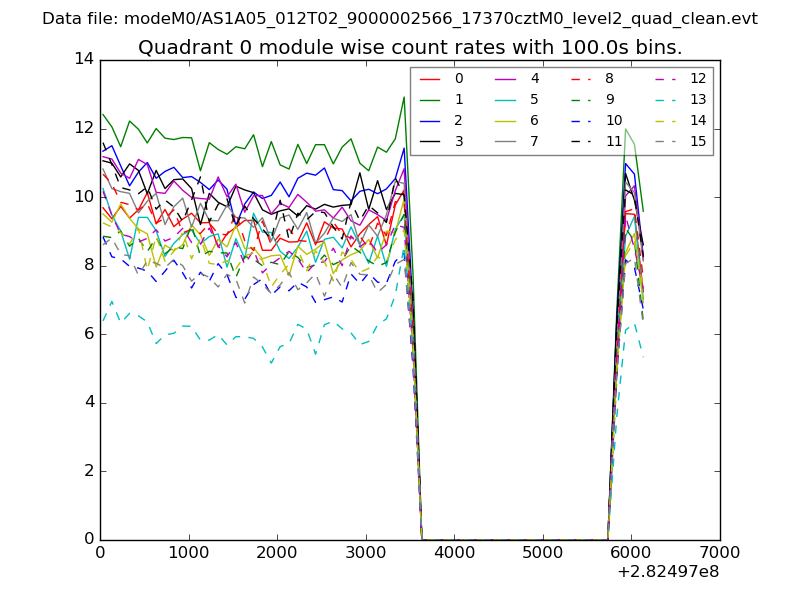 |
 |
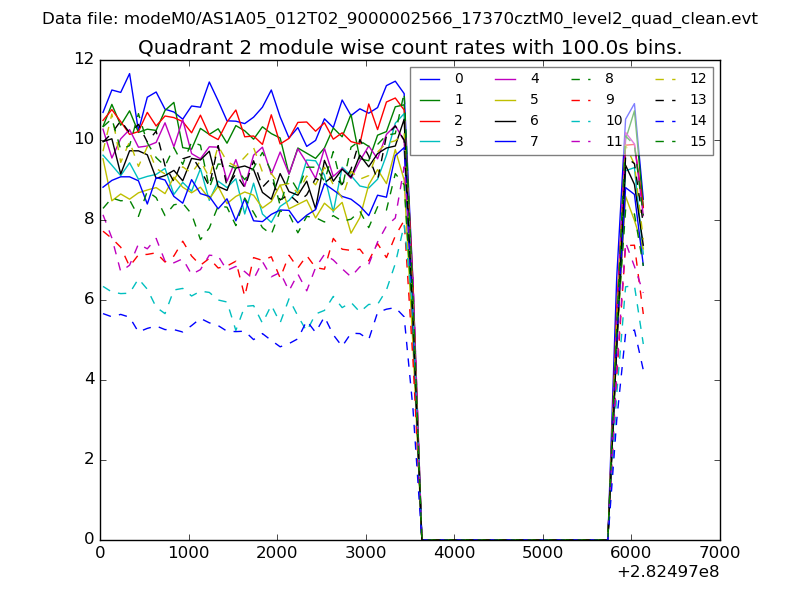
| Module-wise count rates for Quadrant B Data is divided into 100 sec bins |
 |
 |
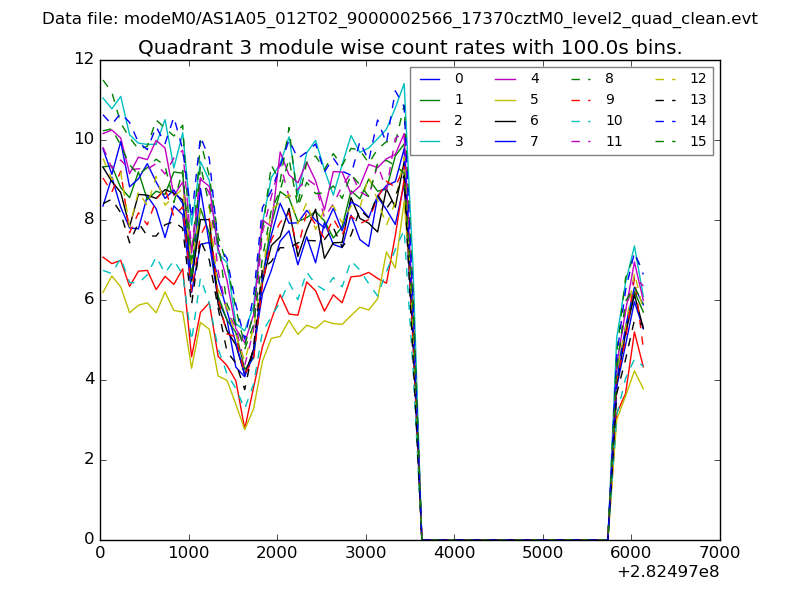
| Module-wise count rates for Quadrant C Data is divided into 100 sec bins |
 |
 |
| Module-wise count rates for Quadrant D Data is divided into 100 sec bins |
 |
 |
| Parameter | Plot |
|---|---|
| CZT HV Monitor | 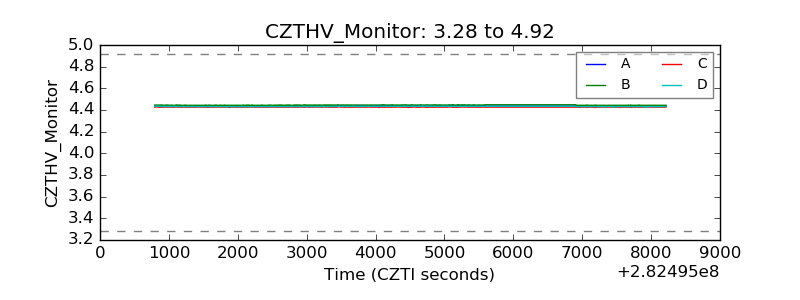 |
| D_VDD |  |
| Temperature 1 | 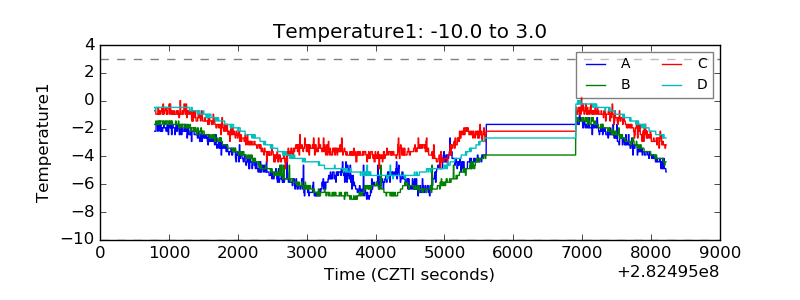 |
| Veto HV Monitor |  |
| Veto LLD | 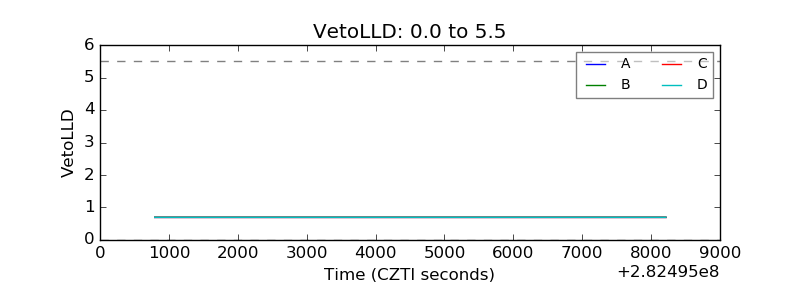 |
| Alpha Counter | 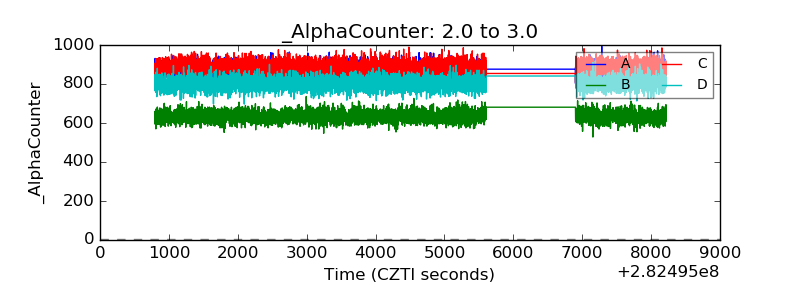 |
| _CPM_Rate | 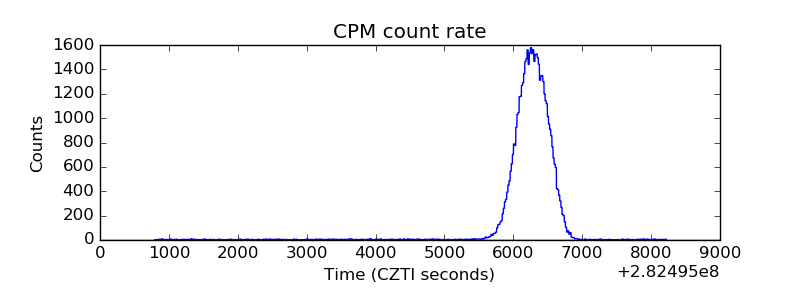 |
| CZT Counter | 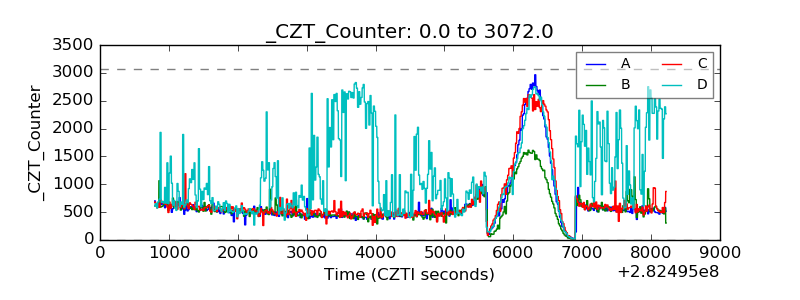 |
| +2.5 Volts monitor |  |
| +5 Volts monitor |  |
| _ROLL_ROT | 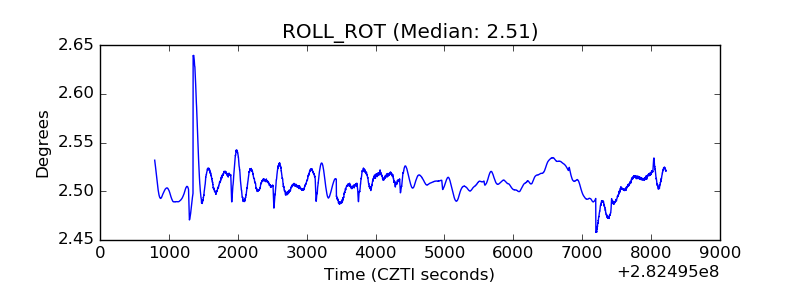 |
| _Roll_DEC | 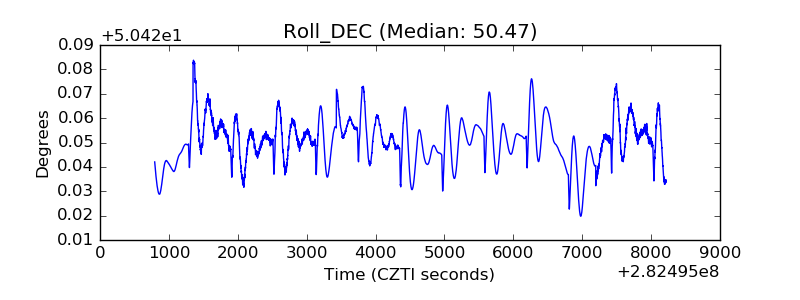 |
| _Roll_RA |  |
| Veto Counter | 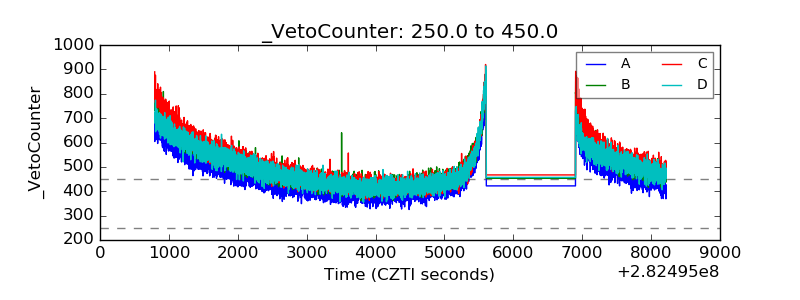 |