| Param | Original file | Final file |
|---|---|---|
| Filename | modeM0/AS1A05_012T02_9000002566_17371cztM0_level2.evt | modeM0/AS1A05_012T02_9000002566_17371cztM0_level2_quad_clean.evt |
| Size (bytes) | 644,400,000 | 96,338,880 |
| Size | 614.5 MB | 91.9 MB |
| Events in quadrant A | 3,158,098 | 654,137 |
| Events in quadrant B | 3,342,841 | 657,572 |
| Events in quadrant C | 3,379,402 | 629,980 |
| Events in quadrant D | 9,197,438 | 524,466 |
| Mode M9 | |||
|---|---|---|---|
| Quadrant | BADHDUFLAG | Total packets | Discarded packets |
| A | 0 | 11 | 0 |
| B | 0 | 11 | 0 |
| C | 0 | 11 | 0 |
| D | 0 | 11 | 0 |
| Mode SS | |||
|---|---|---|---|
| Quadrant | BADHDUFLAG | Total packets | Discarded packets |
| A | 0 | 132 | 0 |
| B | 0 | 132 | 0 |
| C | 0 | 132 | 0 |
| D | 0 | 132 | 0 |
| Mode M0 | |||
|---|---|---|---|
| Quadrant | BADHDUFLAG | Total packets | Discarded packets |
| A | 0 | 13534 | 2 |
| B | 0 | 14078 | 2 |
| C | 0 | 14184 | 3 |
| D | 0 | 31781 | 2 |
| Quadrant | Total seconds | Saturated seconds | Saturation percentage |
|---|---|---|---|
| A | 6459 | 72 | 1.114724% |
| B | 6460 | 85 | 1.315789% |
| C | 6459 | 127 | 1.966249% |
| D | 6459 | 2359 | 36.522682% |
Noise dominated data is calculated using 1-second bins in cleaned event files. If a bin has >2000 counts, and if more than 50% of those come from <1% of pixels, then it is considered to be noise-dominated and hence unusable.
| Quadrant | # 1 sec bins | Bins with >0 counts | Bins with >2000 counts | High rate bins dominated by noise | Noise dominated (total time) | Noise dominated (detector-on time) | Marked lightcurve |
|---|---|---|---|---|---|---|---|
| A | 7544 | 6460 | 0 | 0 | 0.00% | 0.00% |  |
| B | 7545 | 6461 | 2 | 2 | 0.03% | 0.03% |  |
| C | 7544 | 6460 | 0 | 0 | 0.00% | 0.00% |  |
| D | 7544 | 6460 | 1974 | 1974 | 26.17% | 30.56% |  |
Top three noisy pixels from each quadrant. If the there are fewer than three noisy pixels in the level2.evt file, extra rows are filled as -1
| Pixel properties | Quadrant properties | ||||||
|---|---|---|---|---|---|---|---|
| Quadrant | DetID | PixID | Counts | Sigma | Mean | Median | Sigma |
| A | 0 | 226 | 7208 | 39.06 | 820 | 804 | 164.0 |
| A | 12 | 194 | 6170 | 32.73 | 820 | 804 | 164.0 |
| A | 3 | 137 | 5872 | 30.91 | 820 | 804 | 164.0 |
| B | 15 | 35 | 51579 | 328.04 | 823 | 803 | 154.8 |
| B | 0 | 197 | 34890 | 220.22 | 823 | 803 | 154.8 |
| B | 4 | 216 | 33491 | 211.18 | 823 | 803 | 154.8 |
| C | 3 | 233 | 144062 | 781.97 | 791 | 795 | 183.2 |
| C | 14 | 238 | 123354 | 668.94 | 791 | 795 | 183.2 |
| C | 8 | 128 | 10302 | 51.89 | 791 | 795 | 183.2 |
| D | 11 | 176 | 5317192 | 32725.29 | 676 | 658 | 162.5 |
| D | 13 | 232 | 800655 | 4924.29 | 676 | 658 | 162.5 |
| D | 10 | 70 | 175023 | 1073.28 | 676 | 658 | 162.5 |
Histogram calculated using DETX and DETY for each event in the final _common_clean file
| Quadrant A |  |
 |
Quadrant B |
|---|---|---|---|
| Quadrant D |  |
 |
Quadrant C |
| Plot type | Count rate plots | Images |
|---|---|---|
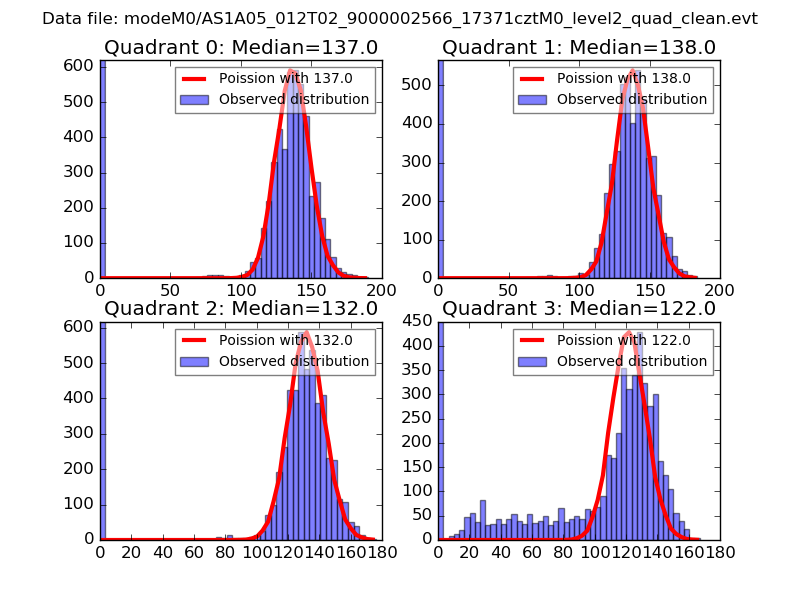
| Comparison with Poisson distribution Blue bars denote a histogram of data divided into 1 sec bins. Red curve is a Poisson curve with rate = median count rate of data. |
 |
 |
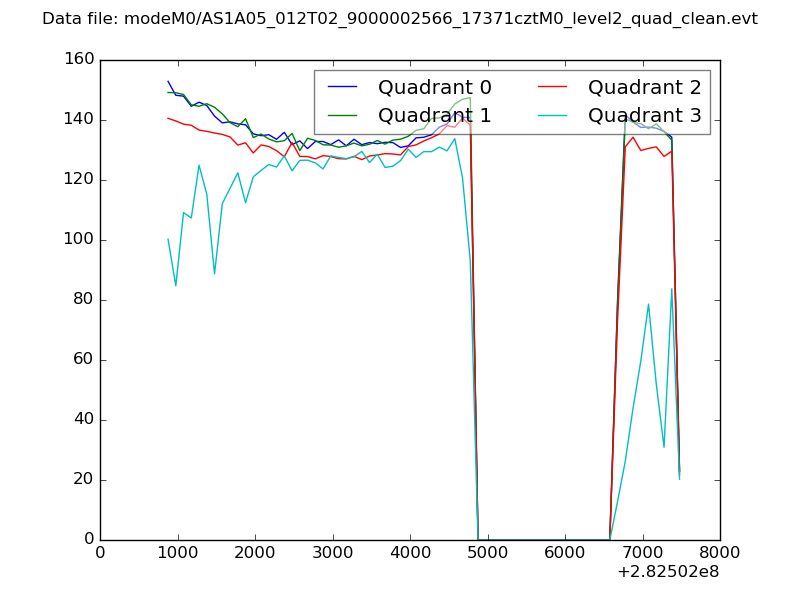
| Quadrant-wise count rates Data is divided into 100 sec bins |
 |
|
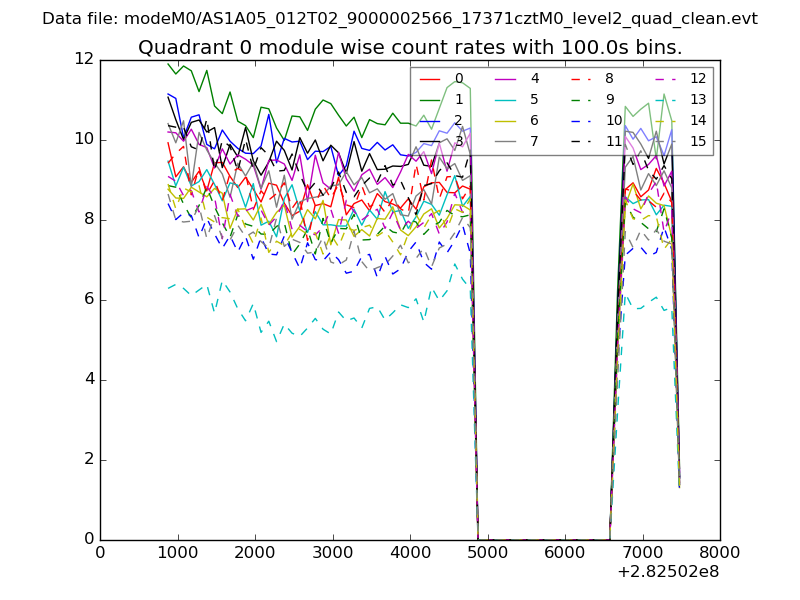
| Module-wise count rates for Quadrant A Data is divided into 100 sec bins |
 |
 |
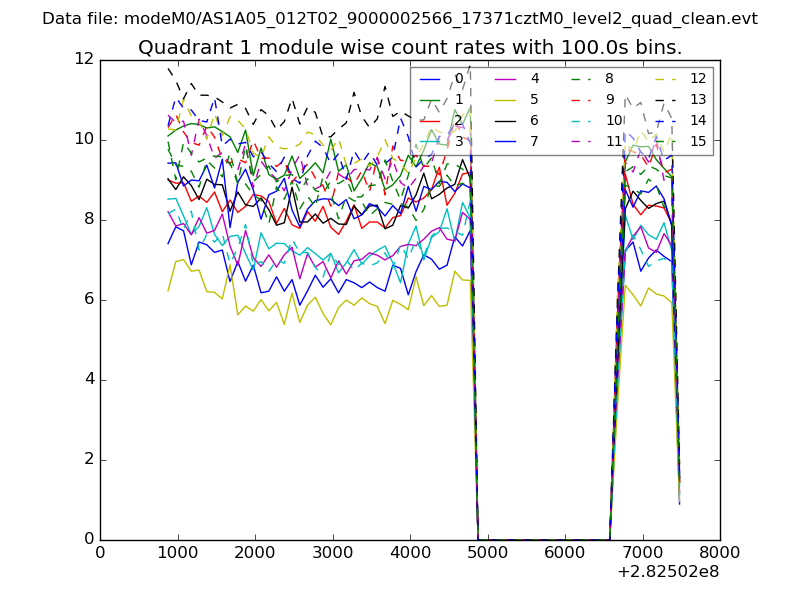
| Module-wise count rates for Quadrant B Data is divided into 100 sec bins |
 |
 |
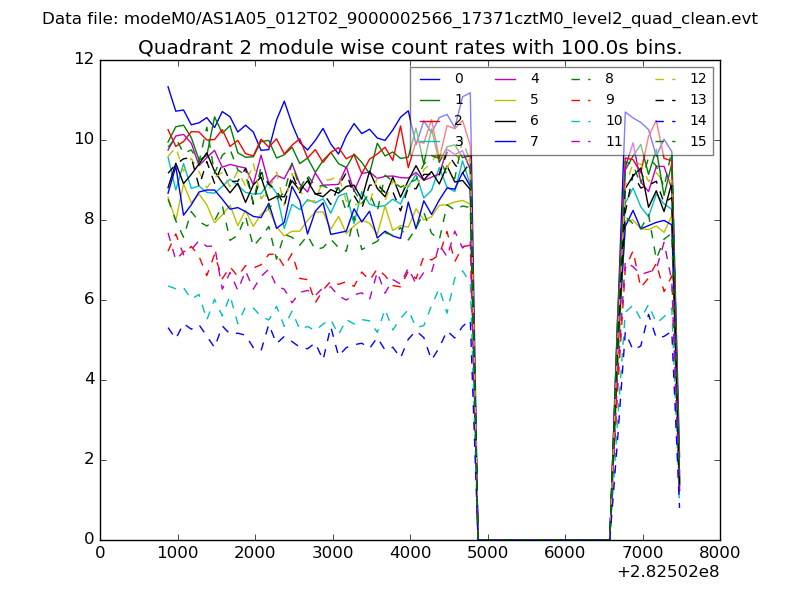
| Module-wise count rates for Quadrant C Data is divided into 100 sec bins |
 |
 |
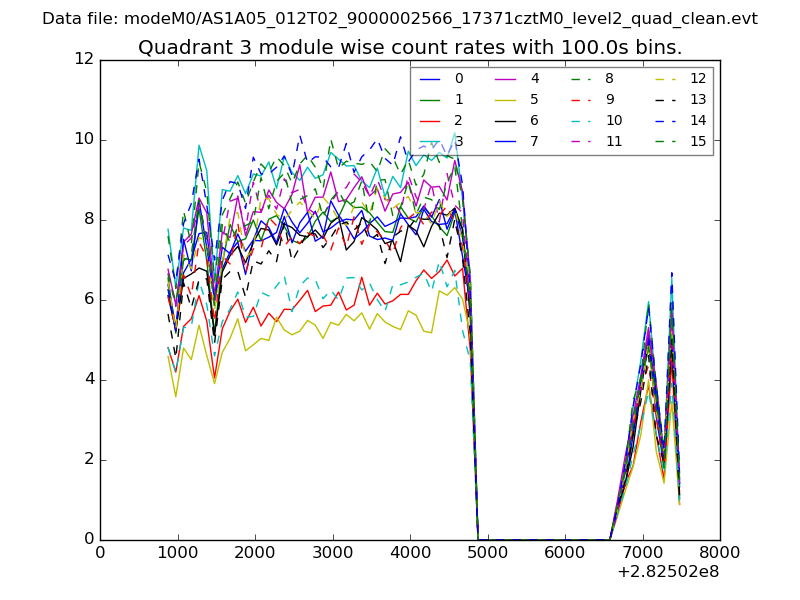
| Module-wise count rates for Quadrant D Data is divided into 100 sec bins |
 |
 |
| Parameter | Plot |
|---|---|
| CZT HV Monitor | 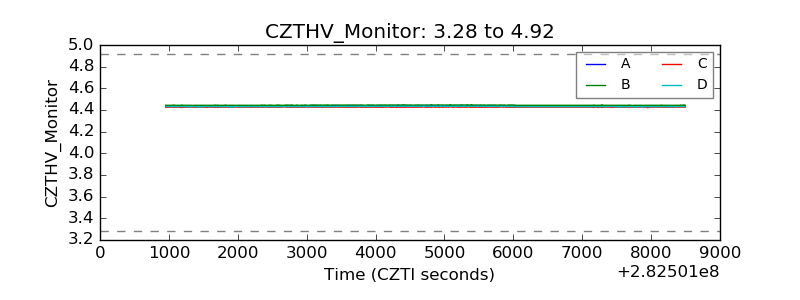 |
| D_VDD |  |
| Temperature 1 |  |
| Veto HV Monitor |  |
| Veto LLD |  |
| Alpha Counter | 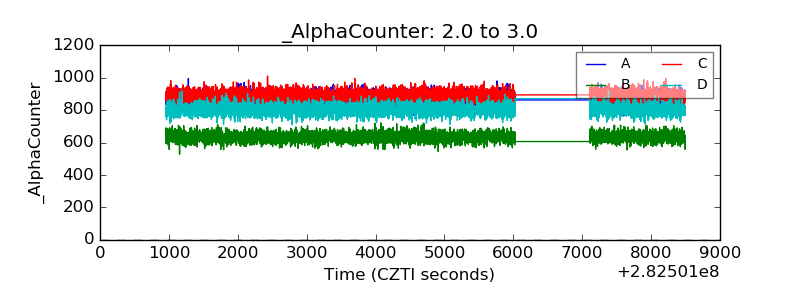 |
| _CPM_Rate | 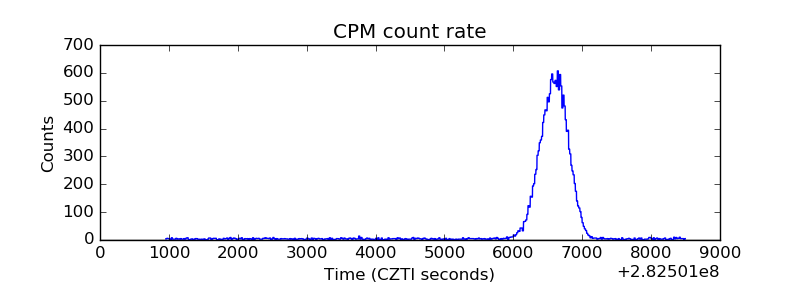 |
| CZT Counter |  |
| +2.5 Volts monitor |  |
| +5 Volts monitor |  |
| _ROLL_ROT | 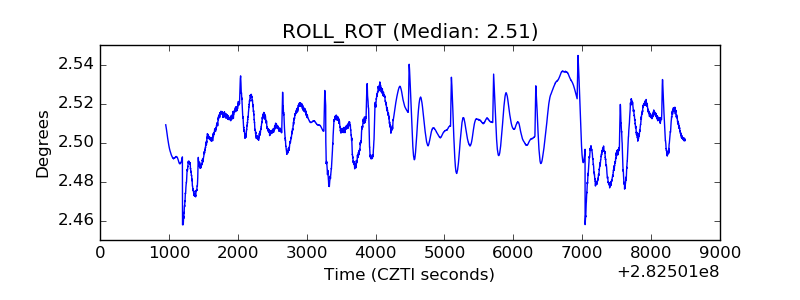 |
| _Roll_DEC | 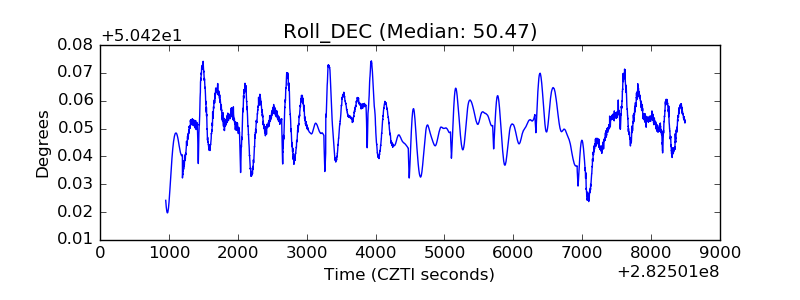 |
| _Roll_RA |  |
| Veto Counter | 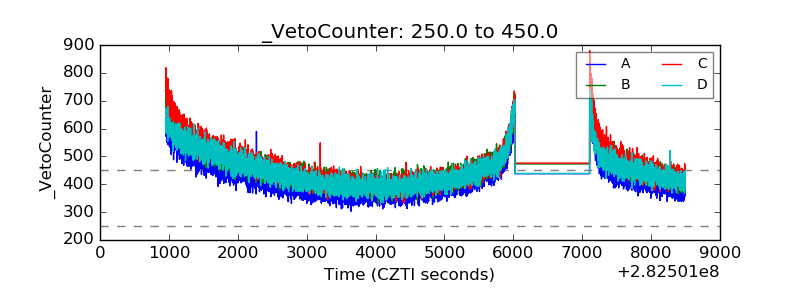 |