| Param | Original file | Final file |
|---|---|---|
| Filename | modeM0/AS1A05_012T02_9000002566_17372cztM0_level2.evt | modeM0/AS1A05_012T02_9000002566_17372cztM0_level2_quad_clean.evt |
| Size (bytes) | 661,677,120 | 88,295,040 |
| Size | 631.0 MB | 84.2 MB |
| Events in quadrant A | 3,002,947 | 595,728 |
| Events in quadrant B | 3,311,962 | 594,972 |
| Events in quadrant C | 3,116,650 | 573,438 |
| Events in quadrant D | 10,177,771 | 466,485 |
| Mode M9 | |||
|---|---|---|---|
| Quadrant | BADHDUFLAG | Total packets | Discarded packets |
| A | 0 | 11 | 0 |
| B | 0 | 12 | 0 |
| C | 0 | 12 | 0 |
| D | 0 | 12 | 0 |
| Mode SS | |||
|---|---|---|---|
| Quadrant | BADHDUFLAG | Total packets | Discarded packets |
| A | 0 | 128 | 0 |
| B | 0 | 128 | 0 |
| C | 0 | 128 | 0 |
| D | 0 | 128 | 0 |
| Mode M0 | |||
|---|---|---|---|
| Quadrant | BADHDUFLAG | Total packets | Discarded packets |
| A | 0 | 13141 | 2 |
| B | 0 | 14004 | 2 |
| C | 0 | 13406 | 2 |
| D | 0 | 34609 | 2 |
| Quadrant | Total seconds | Saturated seconds | Saturation percentage |
|---|---|---|---|
| A | 6345 | 59 | 0.929866% |
| B | 6345 | 137 | 2.159180% |
| C | 6345 | 140 | 2.206462% |
| D | 6345 | 2489 | 39.227738% |
Noise dominated data is calculated using 1-second bins in cleaned event files. If a bin has >2000 counts, and if more than 50% of those come from <1% of pixels, then it is considered to be noise-dominated and hence unusable.
| Quadrant | # 1 sec bins | Bins with >0 counts | Bins with >2000 counts | High rate bins dominated by noise | Noise dominated (total time) | Noise dominated (detector-on time) | Marked lightcurve |
|---|---|---|---|---|---|---|---|
| A | 7040 | 6347 | 1 | 1 | 0.01% | 0.02% | 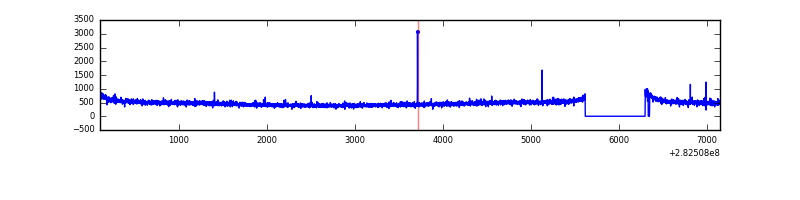 |
| B | 7040 | 6347 | 16 | 16 | 0.23% | 0.25% | 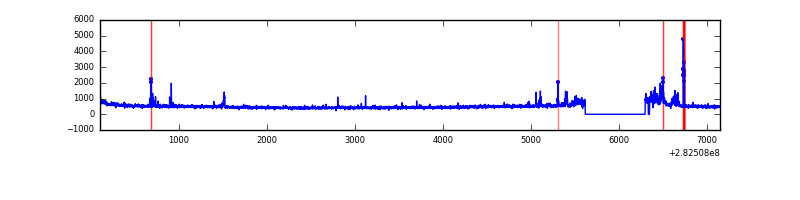 |
| C | 7040 | 6346 | 0 | 0 | 0.00% | 0.00% | 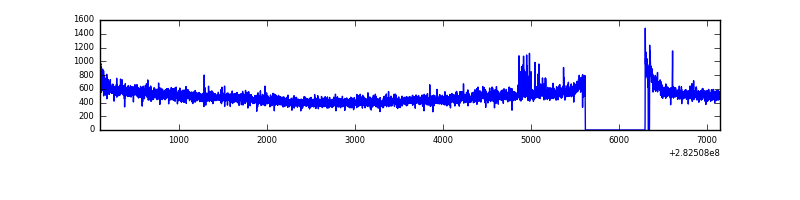 |
| D | 7040 | 6347 | 2192 | 2192 | 31.14% | 34.54% | 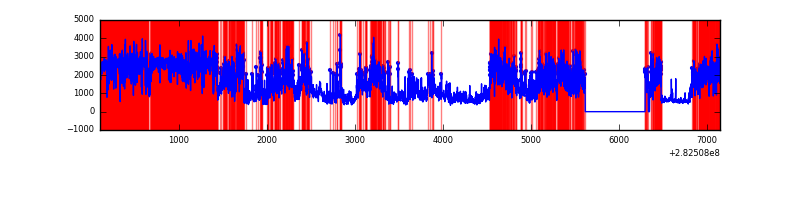 |
Top three noisy pixels from each quadrant. If the there are fewer than three noisy pixels in the level2.evt file, extra rows are filled as -1
| Pixel properties | Quadrant properties | ||||||
|---|---|---|---|---|---|---|---|
| Quadrant | DetID | PixID | Counts | Sigma | Mean | Median | Sigma |
| A | 15 | 174 | 8589 | 49.5 | 779 | 762 | 158.1 |
| A | 0 | 226 | 6920 | 38.95 | 779 | 762 | 158.1 |
| A | 12 | 194 | 5680 | 31.11 | 779 | 762 | 158.1 |
| B | 0 | 189 | 73789 | 494.0 | 777 | 755 | 147.8 |
| B | 4 | 216 | 61589 | 411.48 | 777 | 755 | 147.8 |
| B | 15 | 35 | 35316 | 233.77 | 777 | 755 | 147.8 |
| C | 14 | 238 | 115594 | 666.86 | 745 | 747 | 172.2 |
| C | 3 | 233 | 90481 | 521.04 | 745 | 747 | 172.2 |
| C | 13 | 61 | 5502 | 27.61 | 745 | 747 | 172.2 |
| D | 11 | 176 | 6208664 | 41860.06 | 615 | 600 | 148.3 |
| D | 13 | 232 | 704361 | 4745.35 | 615 | 600 | 148.3 |
| D | 1 | 52 | 529877 | 3568.83 | 615 | 600 | 148.3 |
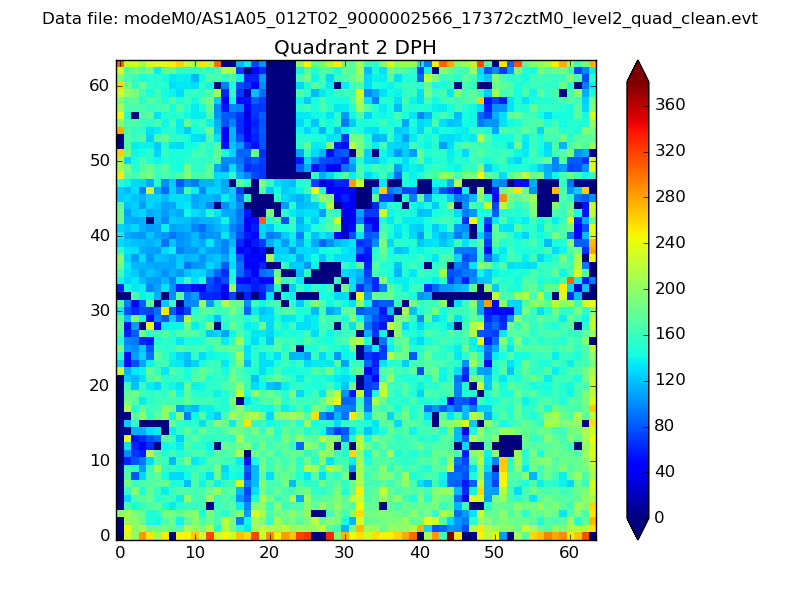
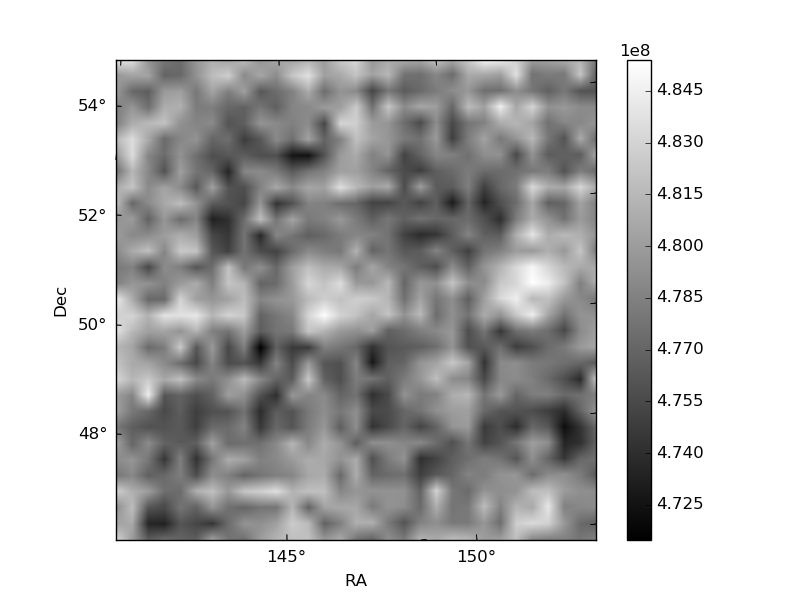
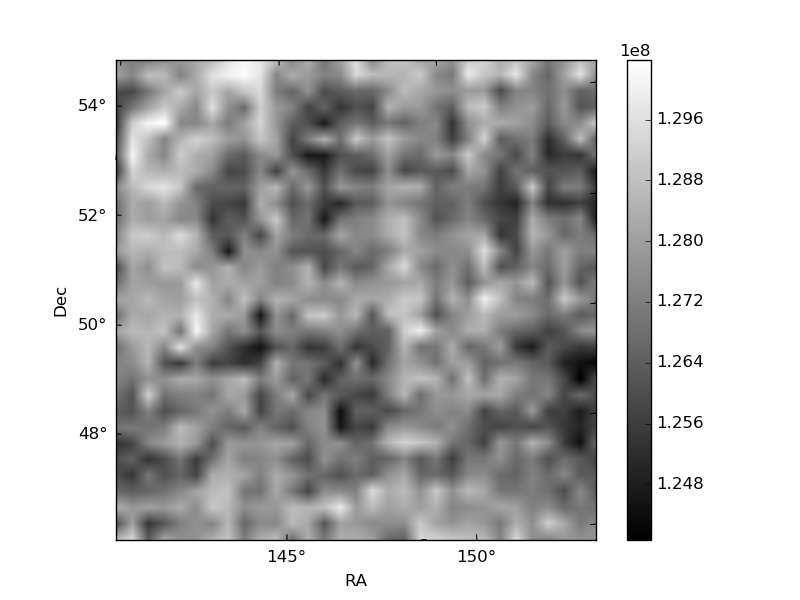
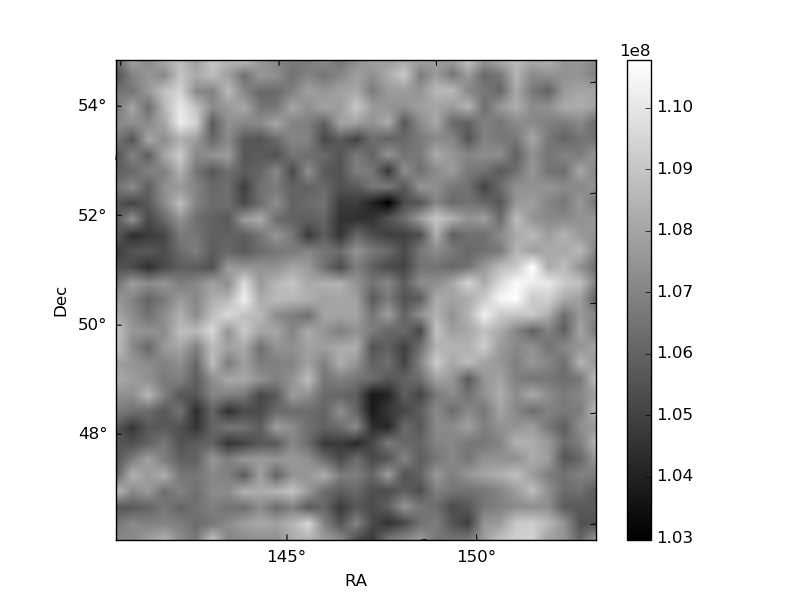
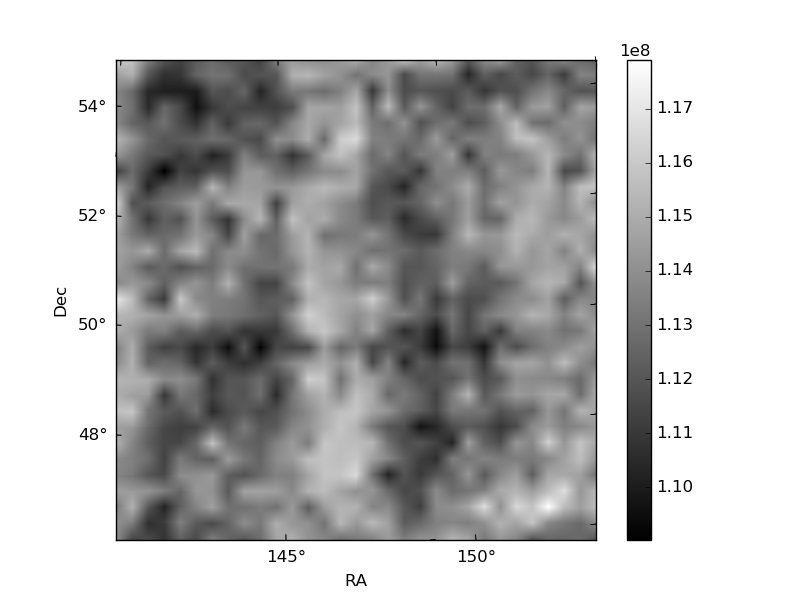
Histogram calculated using DETX and DETY for each event in the final _common_clean file
| Quadrant A | 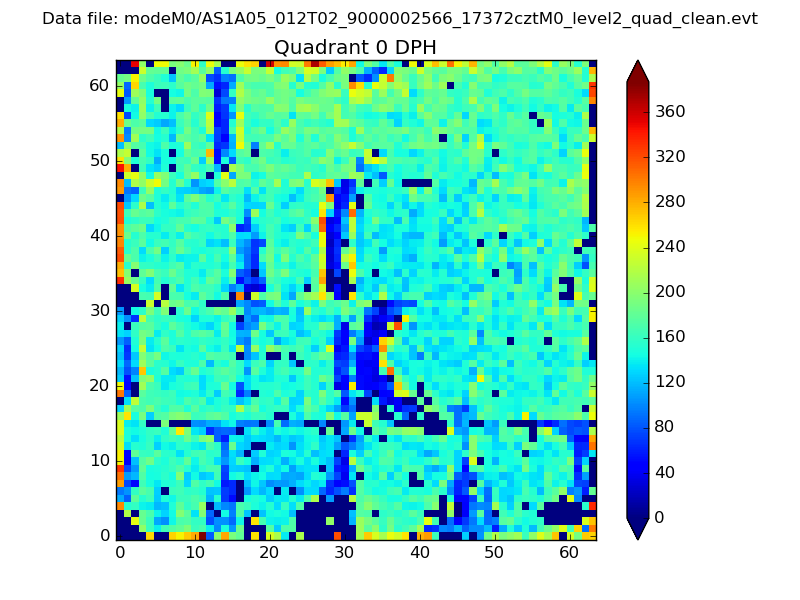 |
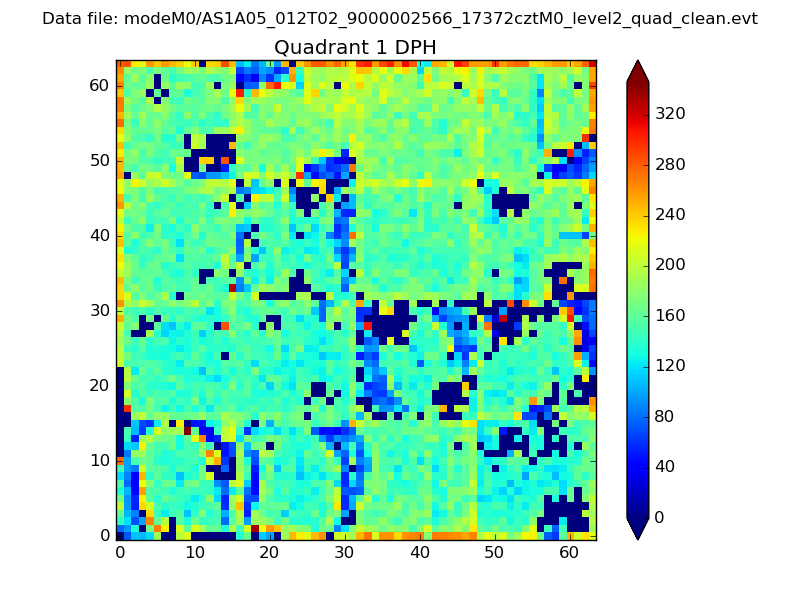 |
Quadrant B |
|---|---|---|---|
| Quadrant D | 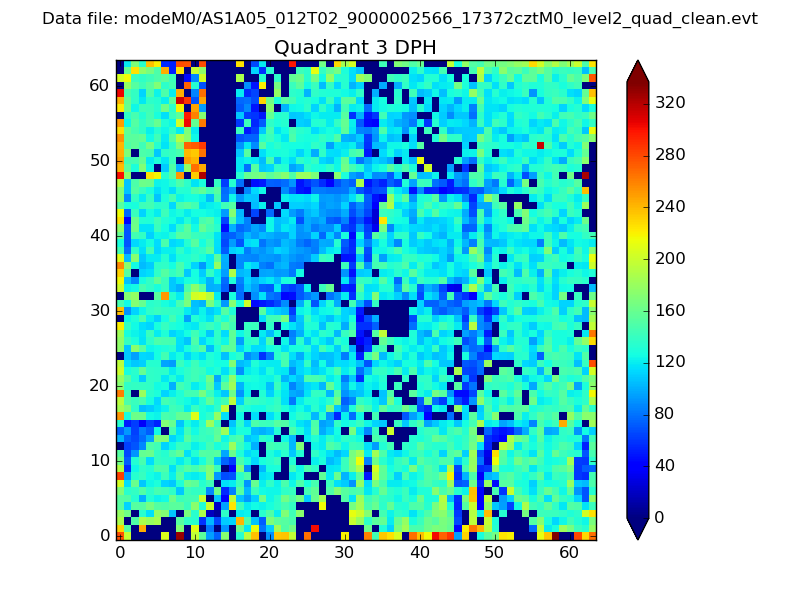 |
 |
Quadrant C |
| Plot type | Count rate plots | Images |
|---|---|---|
| Comparison with Poisson distribution Blue bars denote a histogram of data divided into 1 sec bins. Red curve is a Poisson curve with rate = median count rate of data. |
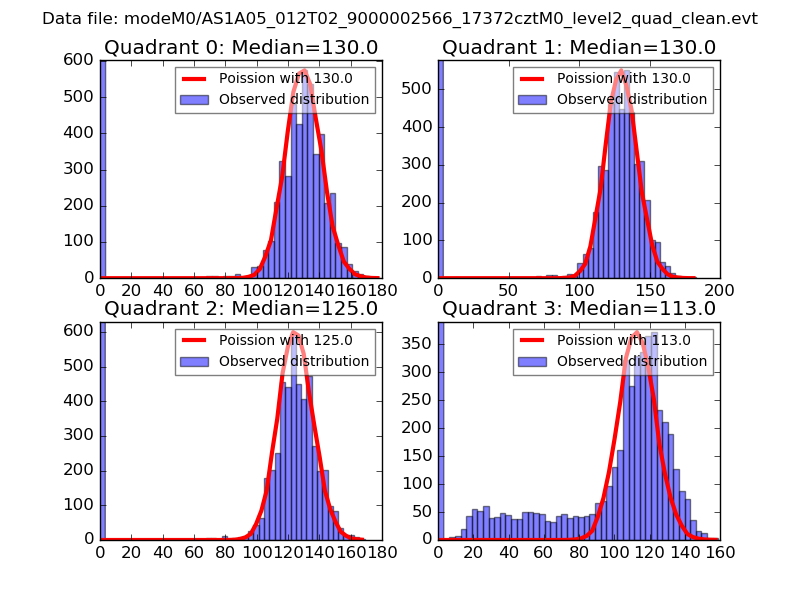 |
 |
| Quadrant-wise count rates Data is divided into 100 sec bins |
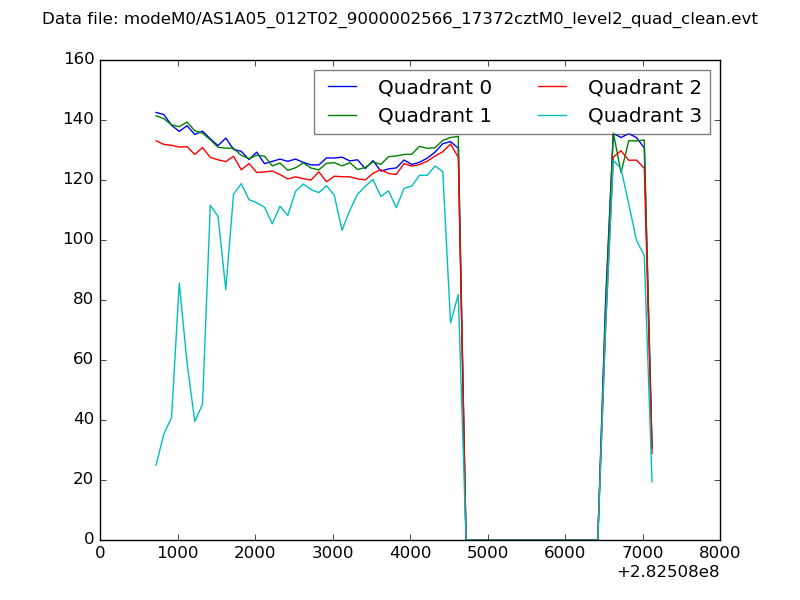 |
|
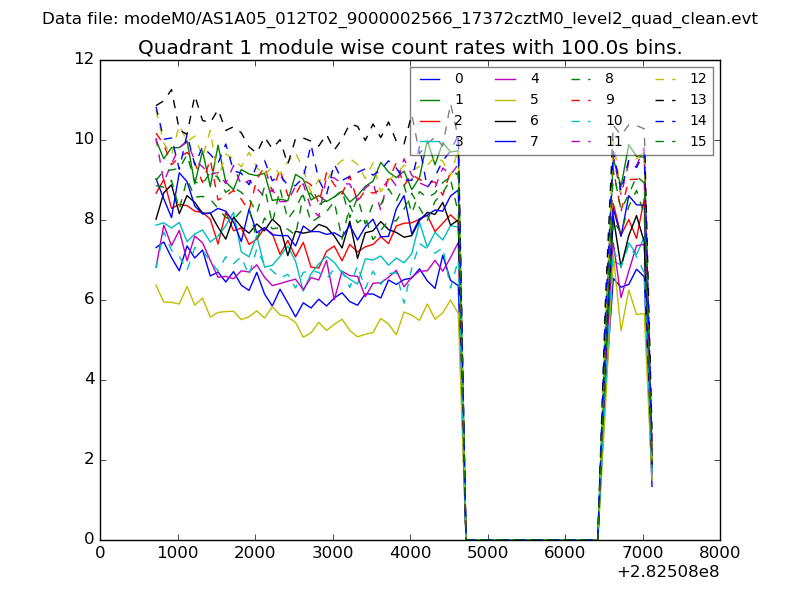
| Module-wise count rates for Quadrant A Data is divided into 100 sec bins |
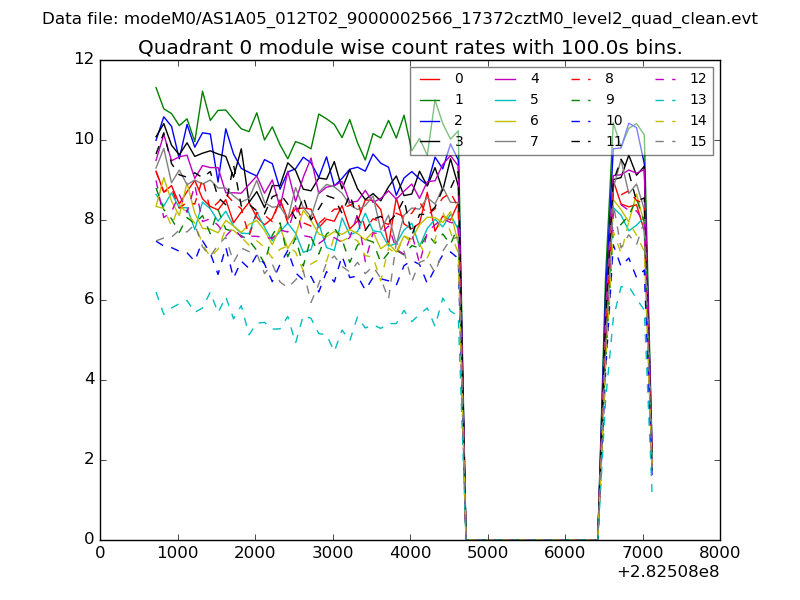 |
 |
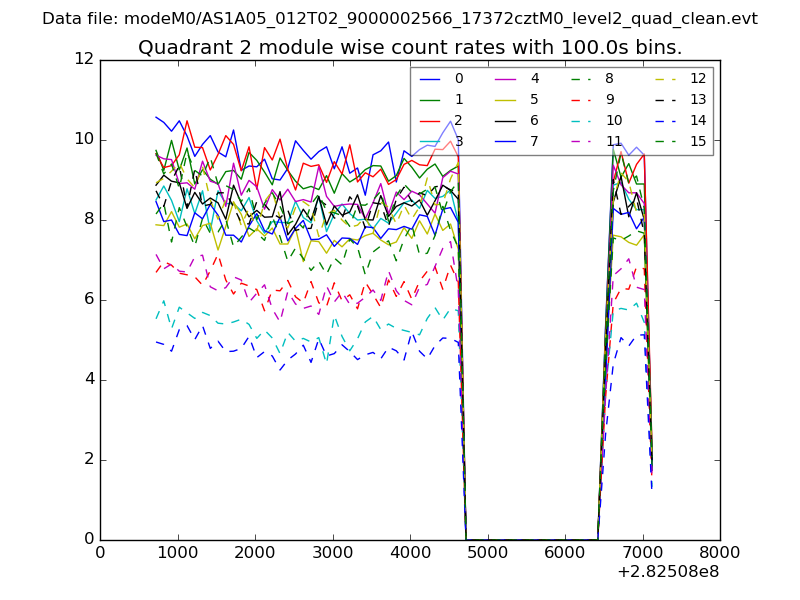
| Module-wise count rates for Quadrant B Data is divided into 100 sec bins |
 |
 |
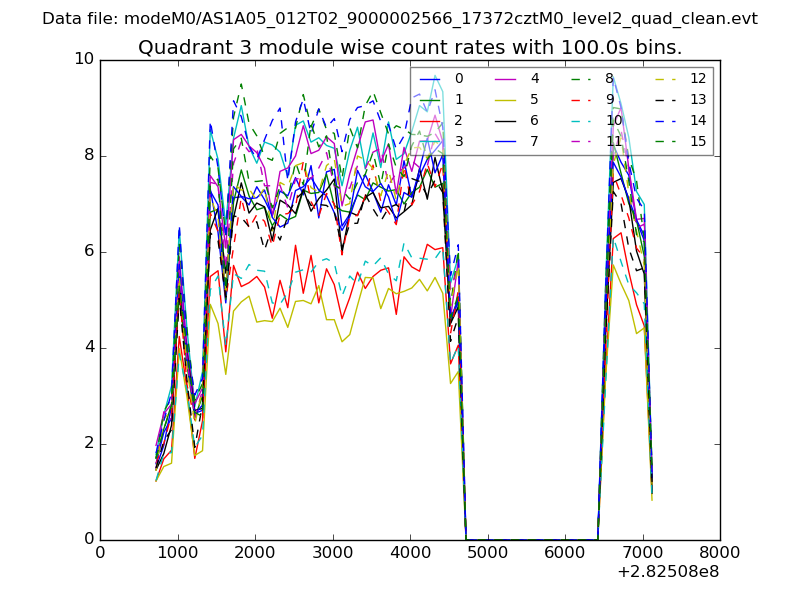
| Module-wise count rates for Quadrant C Data is divided into 100 sec bins |
 |
 |
| Module-wise count rates for Quadrant D Data is divided into 100 sec bins |
 |
 |
| Parameter | Plot |
|---|---|
| CZT HV Monitor |  |
| D_VDD | 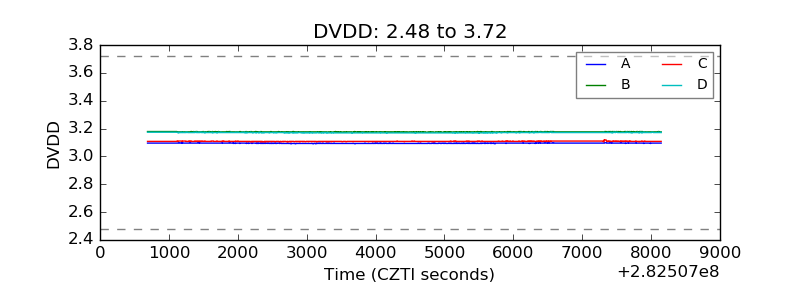 |
| Temperature 1 | 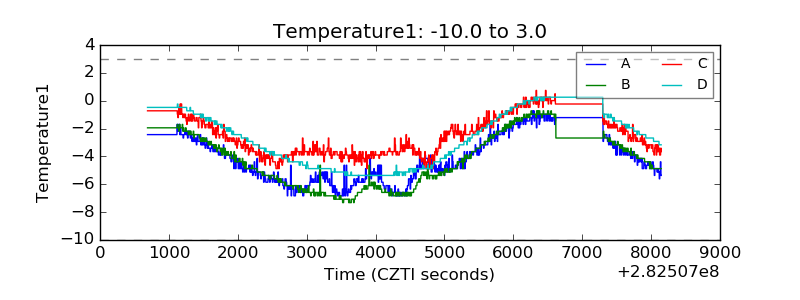 |
| Veto HV Monitor | 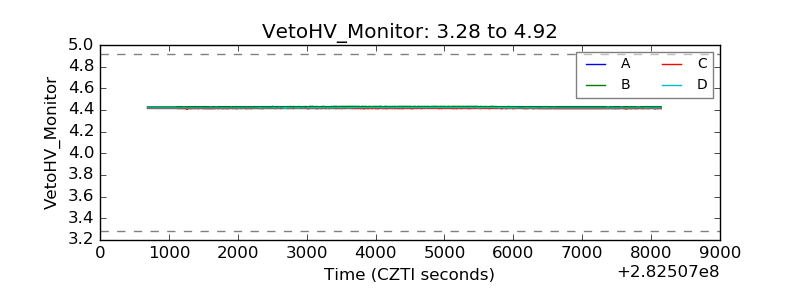 |
| Veto LLD | 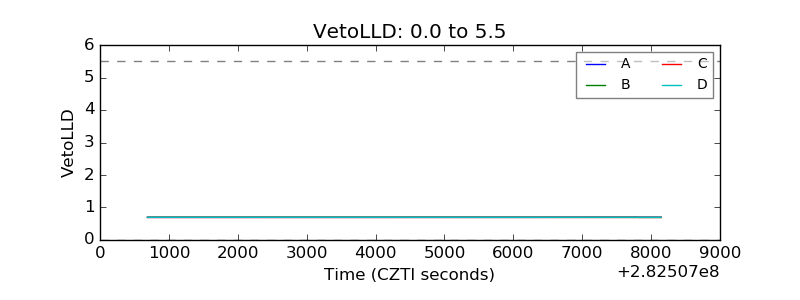 |
| Alpha Counter | 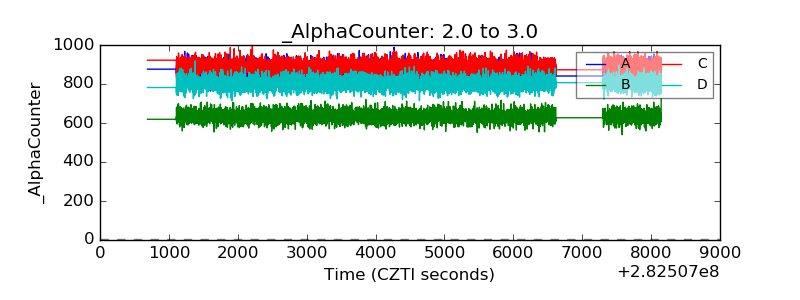 |
| _CPM_Rate | 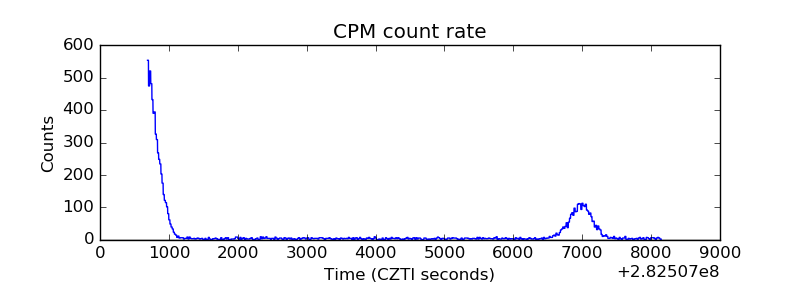 |
| CZT Counter | 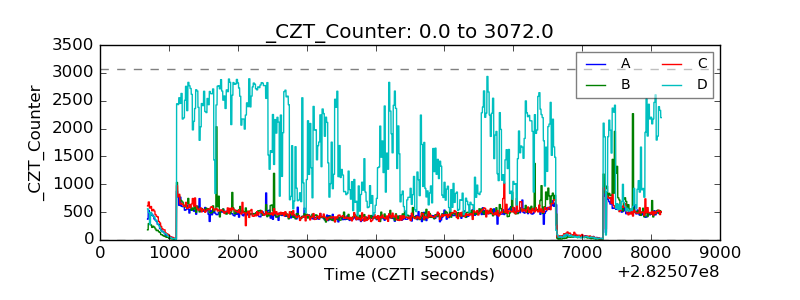 |
| +2.5 Volts monitor |  |
| +5 Volts monitor |  |
| _ROLL_ROT | 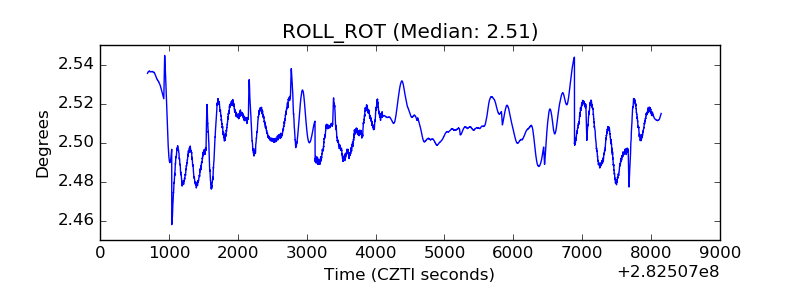 |
| _Roll_DEC | 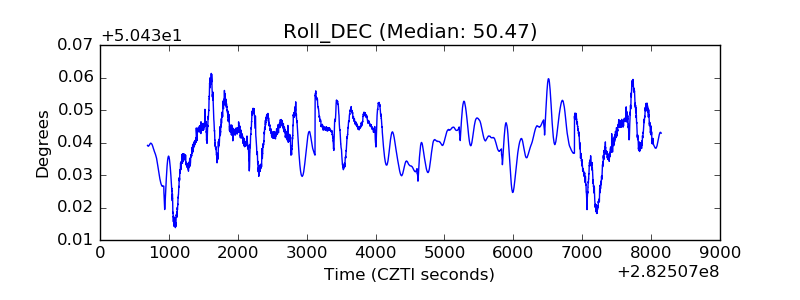 |
| _Roll_RA | 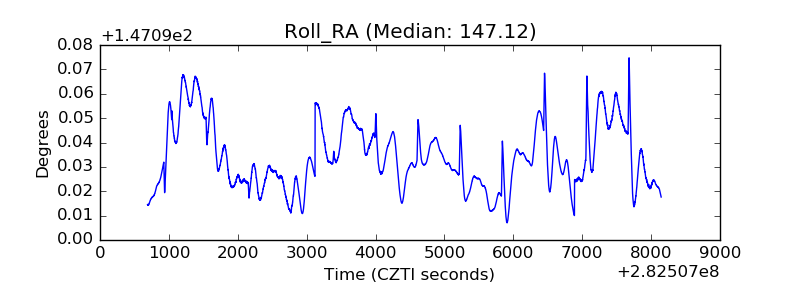 |
| Veto Counter | 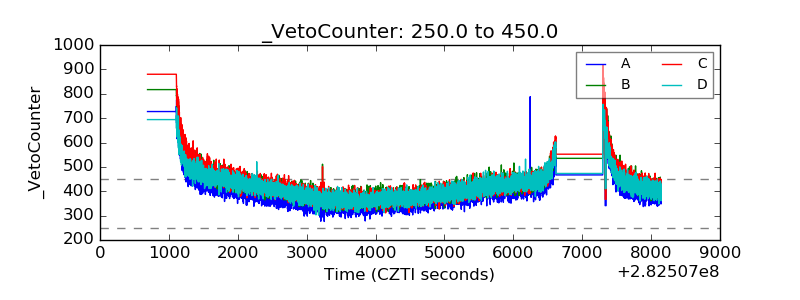 |