| Param | Original file | Final file |
|---|---|---|
| Filename | modeM0/AS1A05_012T02_9000002566_17373cztM0_level2.evt | modeM0/AS1A05_012T02_9000002566_17373cztM0_level2_quad_clean.evt |
| Size (bytes) | 160,056,000 | 13,170,240 |
| Size | 152.6 MB | 12.6 MB |
| Events in quadrant A | 763,097 | 78,121 |
| Events in quadrant B | 962,437 | 76,439 |
| Events in quadrant C | 803,186 | 73,491 |
| Events in quadrant D | 2,220,515 | 65,138 |
| Mode M9 | |||
|---|---|---|---|
| Quadrant | BADHDUFLAG | Total packets | Discarded packets |
| A | 0 | 7 | 0 |
| B | 0 | 7 | 0 |
| C | 0 | 7 | 0 |
| D | 0 | 7 | 0 |
| Mode SS | |||
|---|---|---|---|
| Quadrant | BADHDUFLAG | Total packets | Discarded packets |
| A | 0 | 30 | 0 |
| B | 0 | 30 | 0 |
| C | 0 | 30 | 0 |
| D | 0 | 30 | 0 |
| Mode M0 | |||
|---|---|---|---|
| Quadrant | BADHDUFLAG | Total packets | Discarded packets |
| A | 0 | 3083 | 1 |
| B | 0 | 3729 | 1 |
| C | 0 | 3225 | 1 |
| D | 0 | 7566 | 1 |
| Quadrant | Total seconds | Saturated seconds | Saturation percentage |
|---|---|---|---|
| A | 1407 | 44 | 3.127221% |
| B | 1407 | 117 | 8.315565% |
| C | 1407 | 91 | 6.467662% |
| D | 1407 | 686 | 48.756219% |
Noise dominated data is calculated using 1-second bins in cleaned event files. If a bin has >2000 counts, and if more than 50% of those come from <1% of pixels, then it is considered to be noise-dominated and hence unusable.
| Quadrant | # 1 sec bins | Bins with >0 counts | Bins with >2000 counts | High rate bins dominated by noise | Noise dominated (total time) | Noise dominated (detector-on time) | Marked lightcurve |
|---|---|---|---|---|---|---|---|
| A | 2102 | 1409 | 0 | 0 | 0.00% | 0.00% | 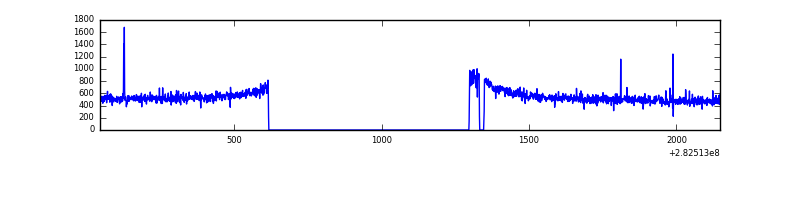 |
| B | 2102 | 1409 | 14 | 14 | 0.67% | 0.99% | 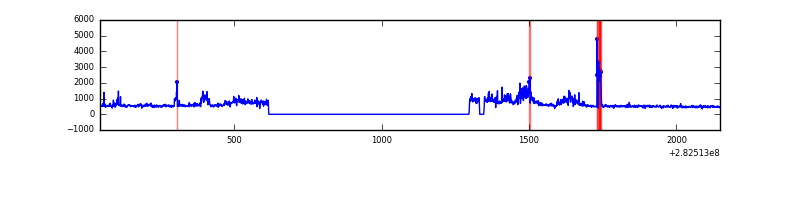 |
| C | 2102 | 1408 | 0 | 0 | 0.00% | 0.00% | 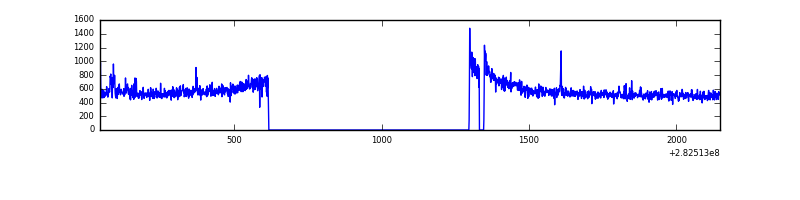 |
| D | 2102 | 1409 | 459 | 459 | 21.84% | 32.58% | 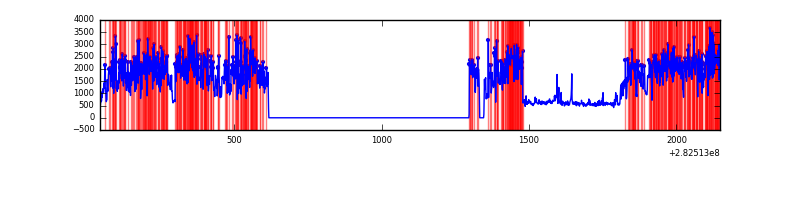 |
Top three noisy pixels from each quadrant. If the there are fewer than three noisy pixels in the level2.evt file, extra rows are filled as -1
| Pixel properties | Quadrant properties | ||||||
|---|---|---|---|---|---|---|---|
| Quadrant | DetID | PixID | Counts | Sigma | Mean | Median | Sigma |
| A | 15 | 174 | 3247 | 71.71 | 197 | 192 | 42.6 |
| A | 0 | 226 | 1798 | 37.7 | 197 | 192 | 42.6 |
| A | 12 | 194 | 1433 | 29.13 | 197 | 192 | 42.6 |
| B | 0 | 189 | 70172 | 1754.85 | 194 | 189 | 39.9 |
| B | 5 | 172 | 33866 | 844.46 | 194 | 189 | 39.9 |
| B | 15 | 35 | 33315 | 830.65 | 194 | 189 | 39.9 |
| C | 3 | 233 | 35767 | 789.17 | 187 | 187 | 45.1 |
| C | 14 | 238 | 28261 | 622.69 | 187 | 187 | 45.1 |
| C | 0 | 79 | 3838 | 80.98 | 187 | 187 | 45.1 |
| D | 11 | 176 | 1176498 | 28073.62 | 163 | 157 | 41.9 |
| D | 1 | 52 | 171212 | 4082.26 | 163 | 157 | 41.9 |
| D | 13 | 232 | 159599 | 3805.12 | 163 | 157 | 41.9 |
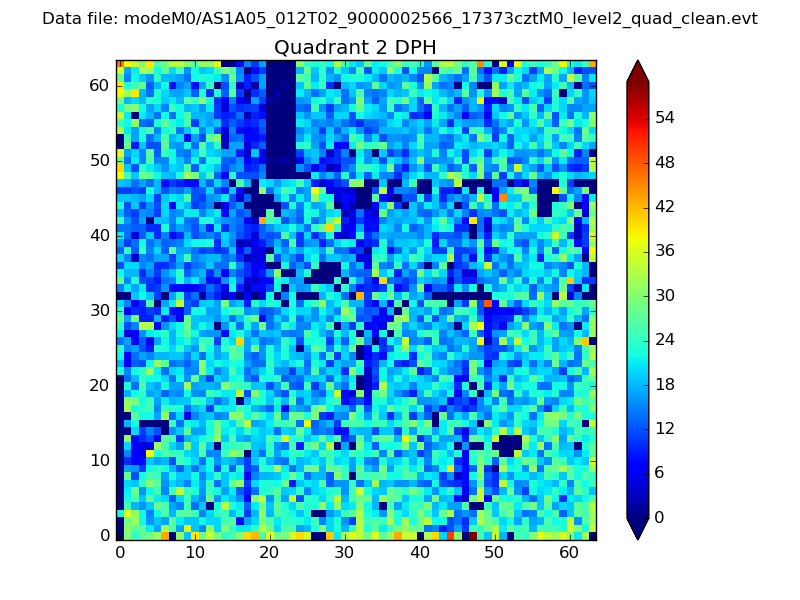
Histogram calculated using DETX and DETY for each event in the final _common_clean file
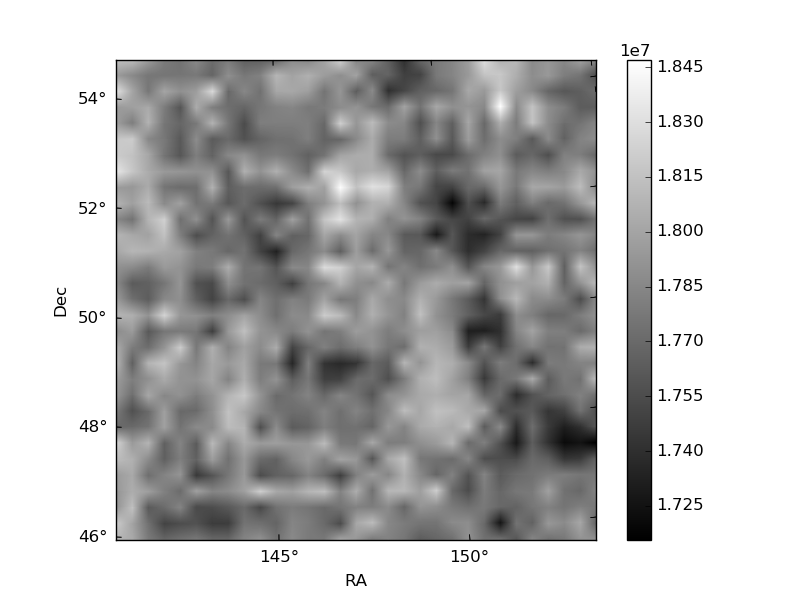
| Quadrant A | 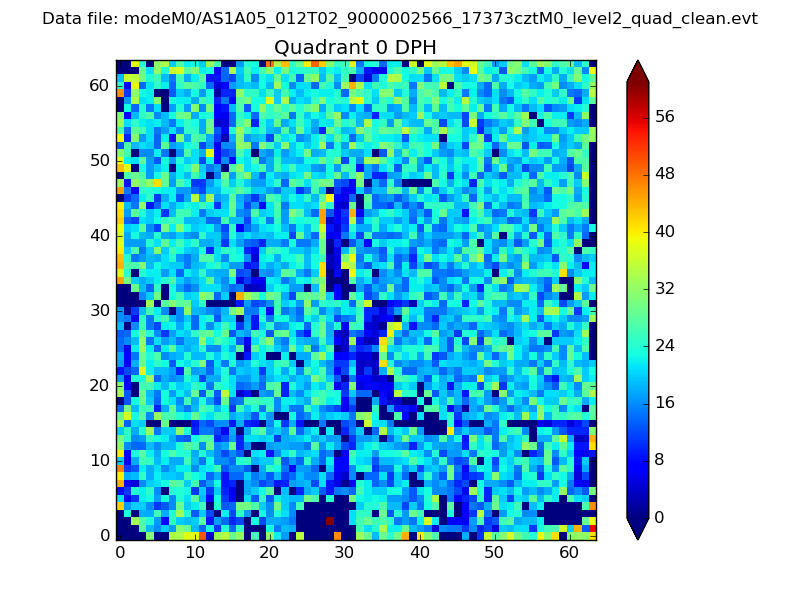 |
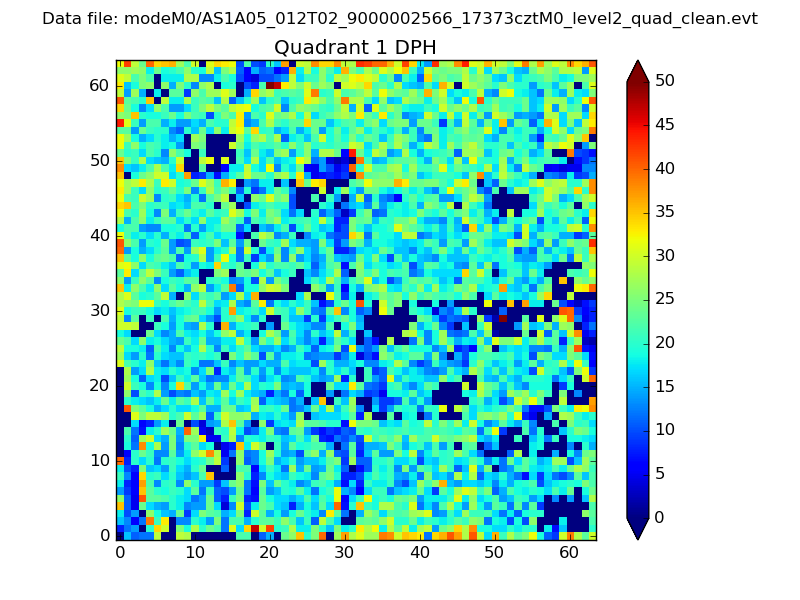 |
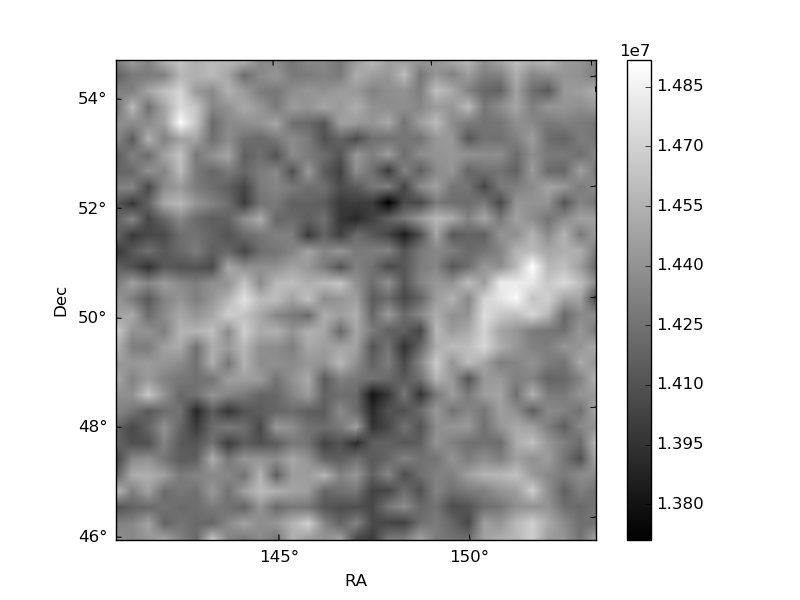
Quadrant B |
|---|---|---|---|
| Quadrant D | 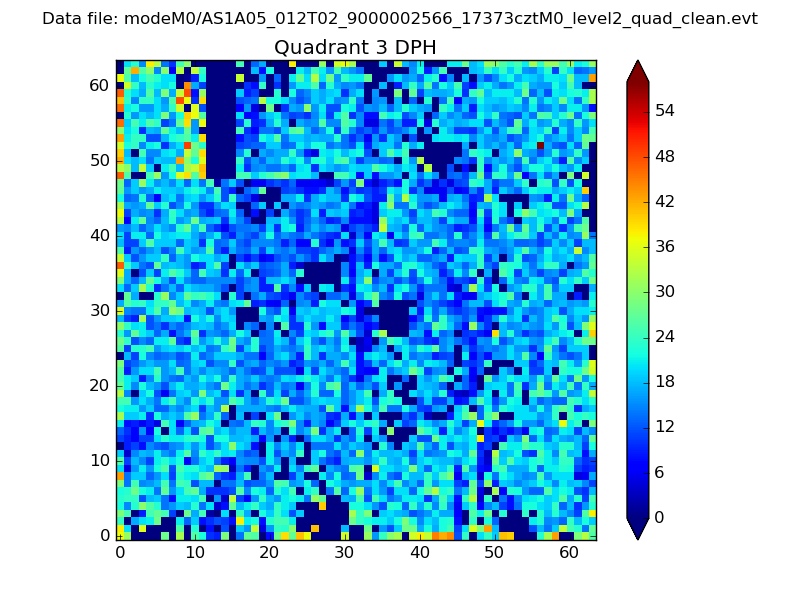 |
 |
Quadrant C |
| Plot type | Count rate plots | Images |
|---|---|---|
| Comparison with Poisson distribution Blue bars denote a histogram of data divided into 1 sec bins. Red curve is a Poisson curve with rate = median count rate of data. |
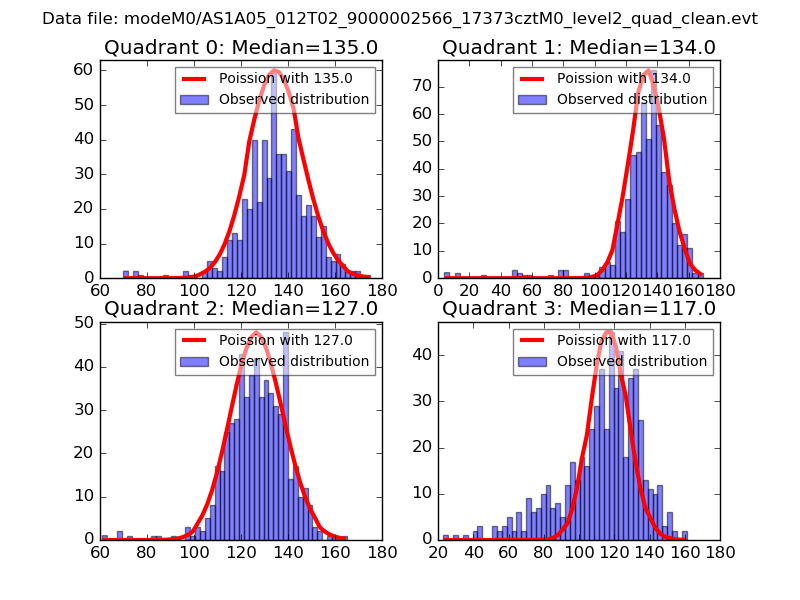 |
 |
| Quadrant-wise count rates Data is divided into 100 sec bins |
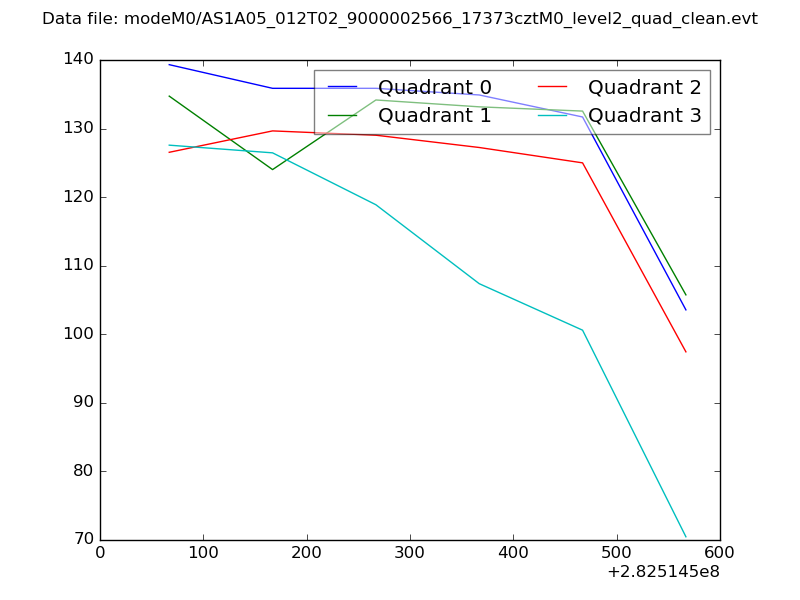 |
|
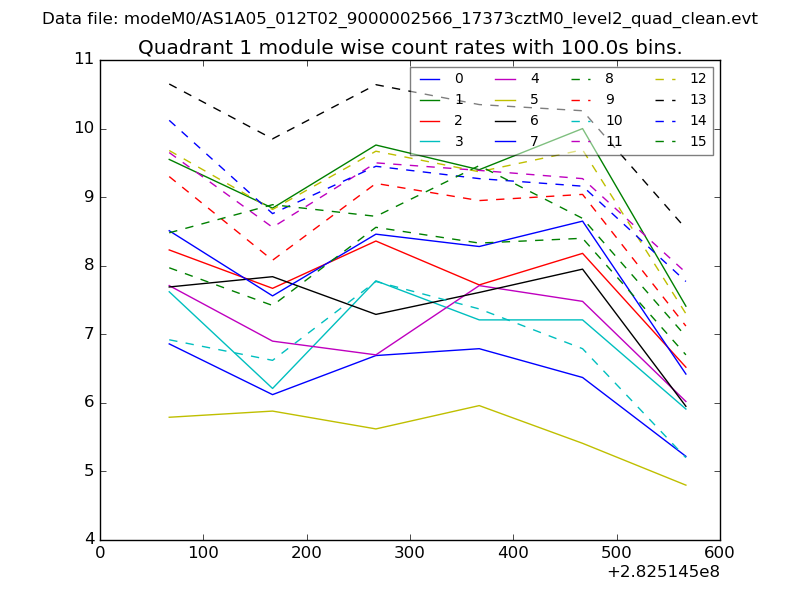
| Module-wise count rates for Quadrant A Data is divided into 100 sec bins |
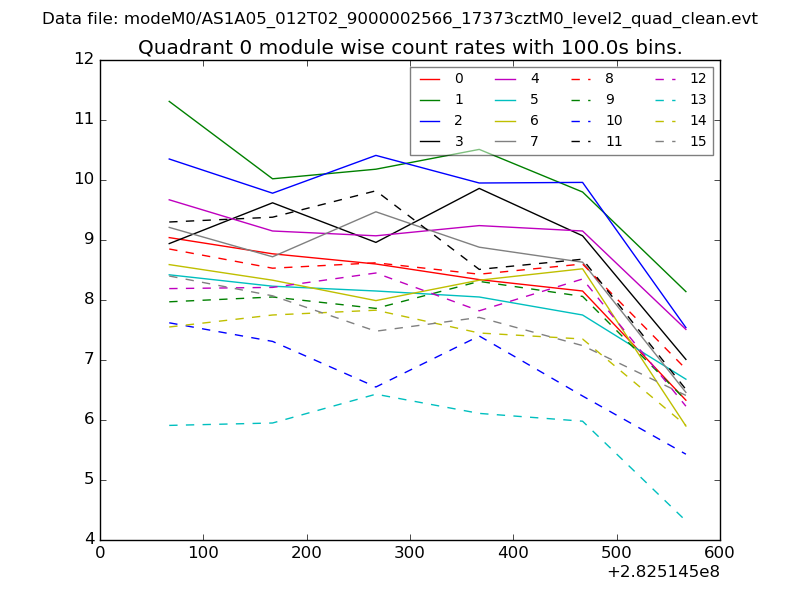 |
 |
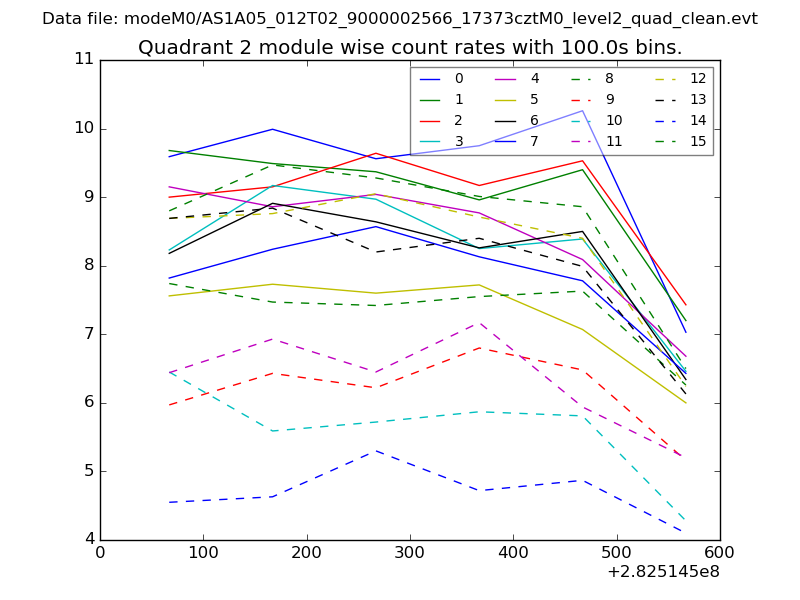
| Module-wise count rates for Quadrant B Data is divided into 100 sec bins |
 |
 |
| Module-wise count rates for Quadrant C Data is divided into 100 sec bins |
 |
 |
| Module-wise count rates for Quadrant D Data is divided into 100 sec bins |
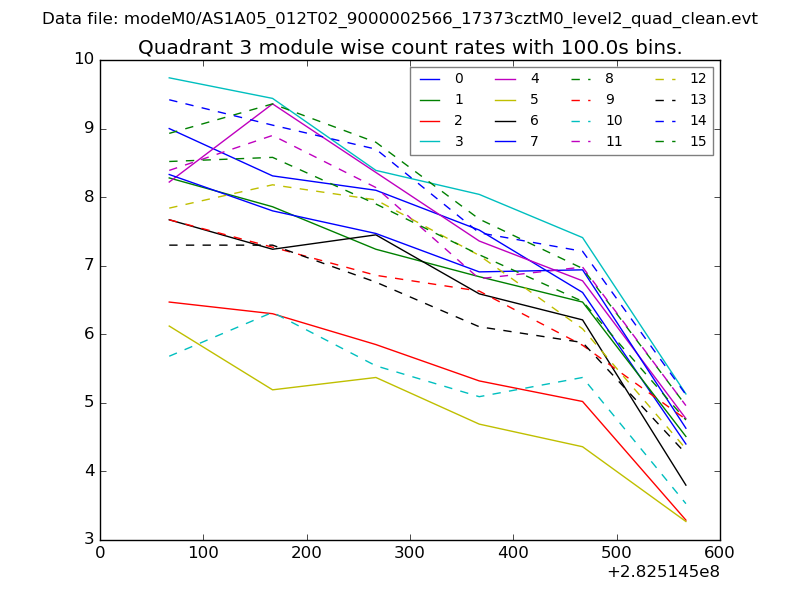 |
 |
| Parameter | Plot |
|---|---|
| CZT HV Monitor | 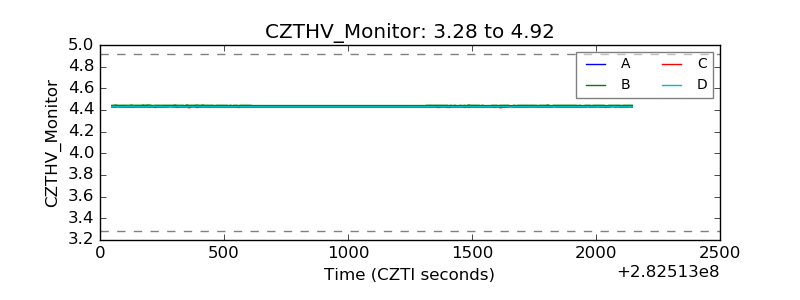 |
| D_VDD | 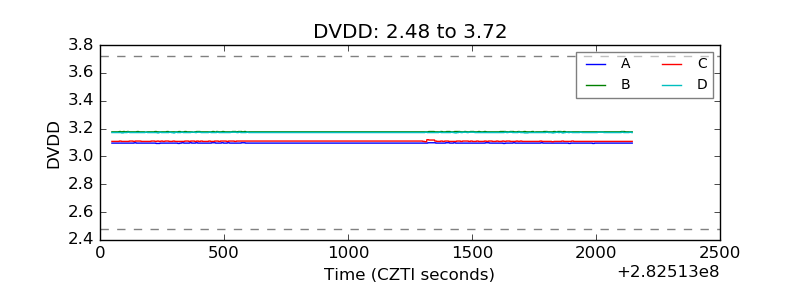 |
| Temperature 1 | 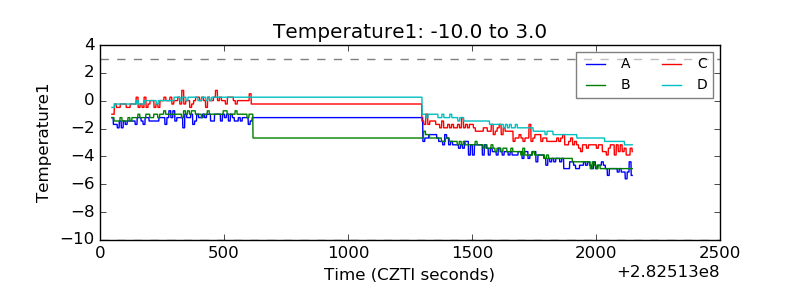 |
| Veto HV Monitor |  |
| Veto LLD | 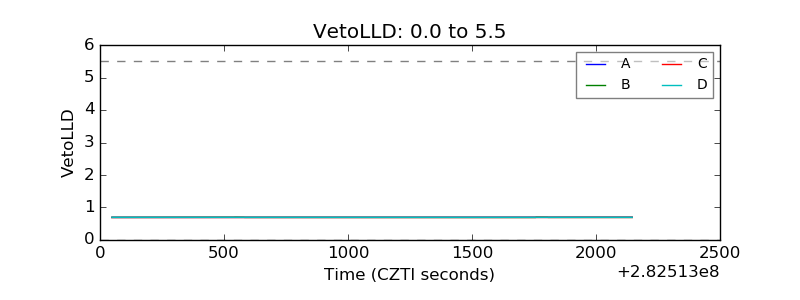 |
| Alpha Counter | 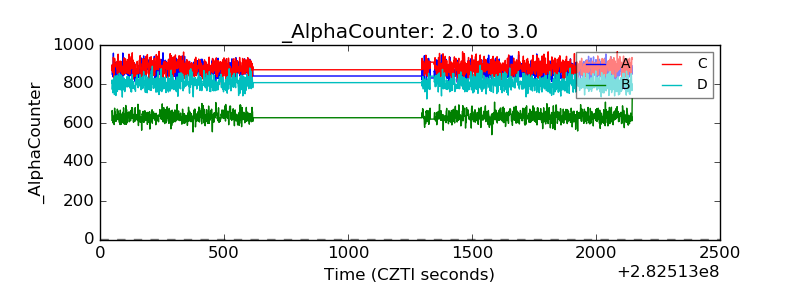 |
| _CPM_Rate | 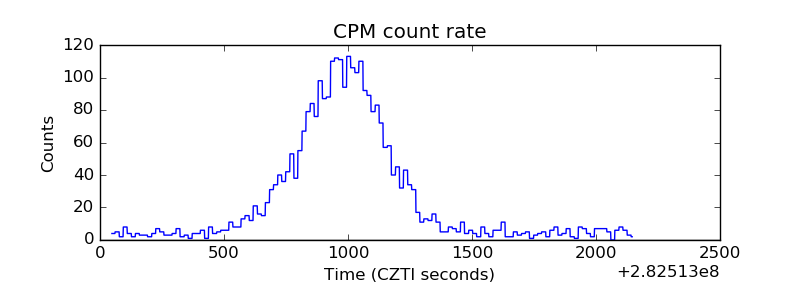 |
| CZT Counter | 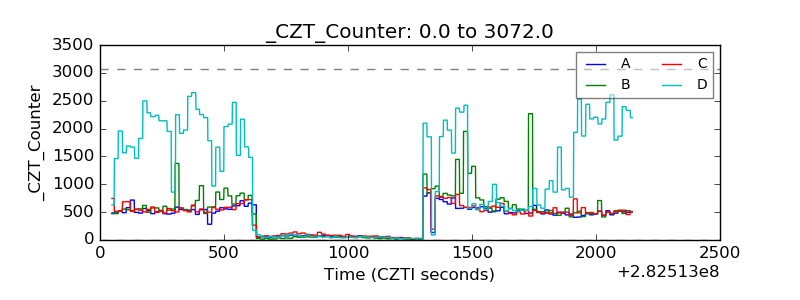 |
| +2.5 Volts monitor |  |
| +5 Volts monitor |  |
| _ROLL_ROT | 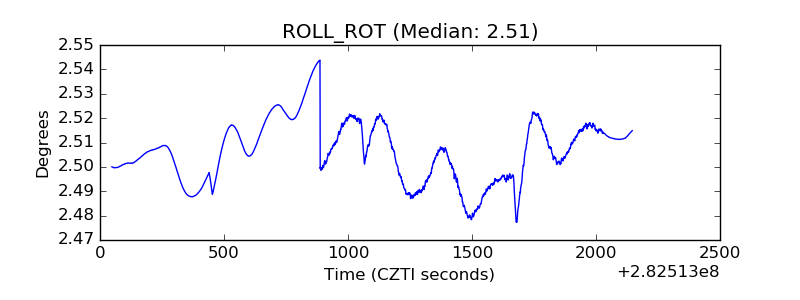 |
| _Roll_DEC | 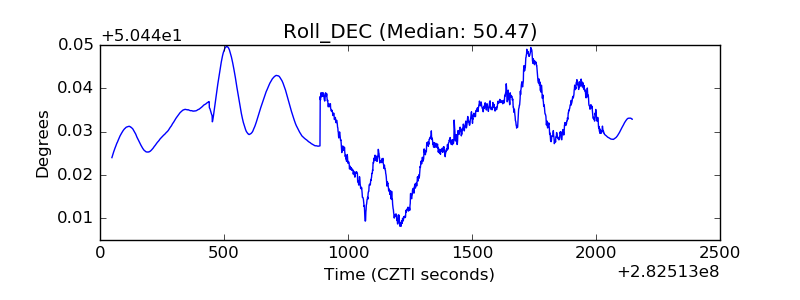 |
| _Roll_RA |  |
| Veto Counter | 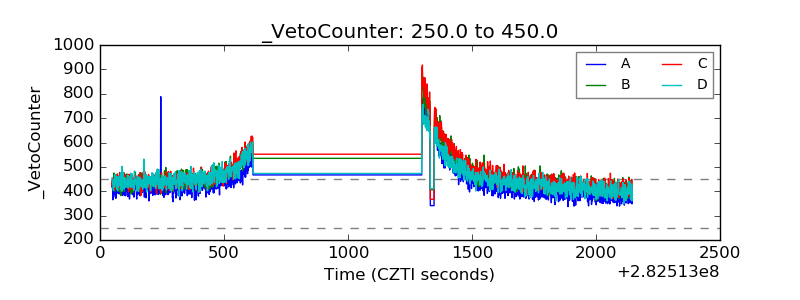 |