| Param | Original file | Final file |
|---|---|---|
| Filename | modeM0/AS1T03_032T01_9000002564_17366cztM0_level2.evt | modeM0/AS1T03_032T01_9000002564_17366cztM0_level2_quad_clean.evt |
| Size (bytes) | 110,828,160 | 17,317,440 |
| Size | 105.7 MB | 16.5 MB |
| Events in quadrant A | 795,457 | 106,727 |
| Events in quadrant B | 791,694 | 109,863 |
| Events in quadrant C | 812,069 | 103,206 |
| Events in quadrant D | 860,558 | 100,961 |
| Mode M9 | |||
|---|---|---|---|
| Quadrant | BADHDUFLAG | Total packets | Discarded packets |
| A | 0 | 8 | 0 |
| B | 0 | 8 | 0 |
| C | 0 | 8 | 0 |
| D | 0 | 8 | 0 |
| Mode SS | |||
|---|---|---|---|
| Quadrant | BADHDUFLAG | Total packets | Discarded packets |
| A | 0 | 28 | 0 |
| B | 0 | 28 | 0 |
| C | 0 | 28 | 0 |
| D | 0 | 28 | 0 |
| Mode M0 | |||
|---|---|---|---|
| Quadrant | BADHDUFLAG | Total packets | Discarded packets |
| A | 0 | 3200 | 1 |
| B | 0 | 3175 | 1 |
| C | 0 | 3272 | 1 |
| D | 0 | 3441 | 2 |
| Quadrant | Total seconds | Saturated seconds | Saturation percentage |
|---|---|---|---|
| A | 1381 | 19 | 1.375815% |
| B | 1381 | 19 | 1.375815% |
| C | 1381 | 26 | 1.882694% |
| D | 1380 | 21 | 1.521739% |
Noise dominated data is calculated using 1-second bins in cleaned event files. If a bin has >2000 counts, and if more than 50% of those come from <1% of pixels, then it is considered to be noise-dominated and hence unusable.
| Quadrant | # 1 sec bins | Bins with >0 counts | Bins with >2000 counts | High rate bins dominated by noise | Noise dominated (total time) | Noise dominated (detector-on time) | Marked lightcurve |
|---|---|---|---|---|---|---|---|
| A | 1381 | 1381 | 0 | 0 | 0.00% | 0.00% | 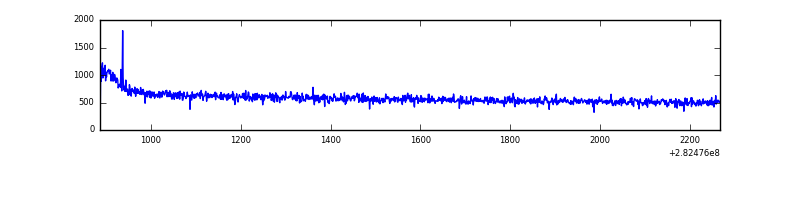 |
| B | 1381 | 1381 | 0 | 0 | 0.00% | 0.00% | 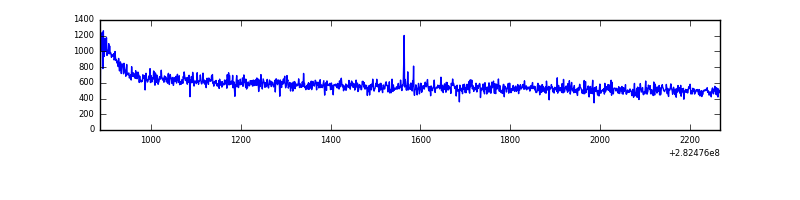 |
| C | 1381 | 1381 | 0 | 0 | 0.00% | 0.00% | 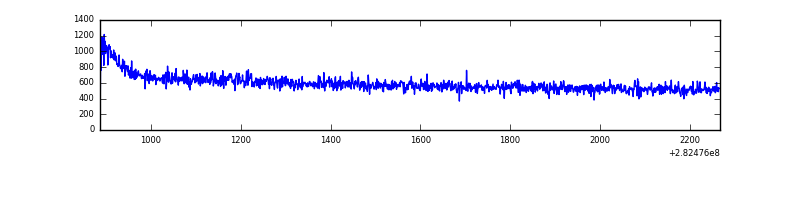 |
| D | 1380 | 1380 | 3 | 3 | 0.22% | 0.22% | 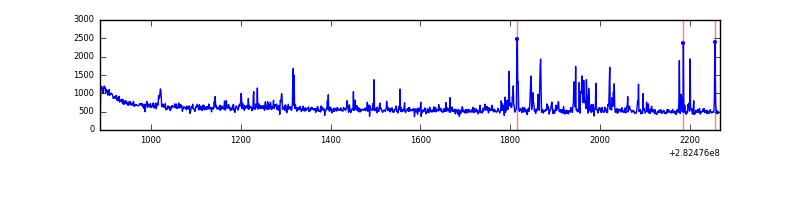 |
Top three noisy pixels from each quadrant. If the there are fewer than three noisy pixels in the level2.evt file, extra rows are filled as -1
| Pixel properties | Quadrant properties | ||||||
|---|---|---|---|---|---|---|---|
| Quadrant | DetID | PixID | Counts | Sigma | Mean | Median | Sigma |
| A | 6 | 16 | 2852 | 62.59 | 206 | 202 | 42.3 |
| A | 0 | 226 | 1785 | 37.39 | 206 | 202 | 42.3 |
| A | 12 | 194 | 1392 | 28.11 | 206 | 202 | 42.3 |
| B | 12 | 111 | 4297 | 103.19 | 202 | 197 | 39.7 |
| B | 11 | 111 | 3976 | 95.11 | 202 | 197 | 39.7 |
| B | 14 | 111 | 3457 | 82.05 | 202 | 197 | 39.7 |
| C | 14 | 238 | 30028 | 632.03 | 198 | 200 | 47.2 |
| C | 3 | 233 | 4184 | 84.42 | 198 | 200 | 47.2 |
| C | 5 | 112 | 1943 | 36.93 | 198 | 200 | 47.2 |
| D | 13 | 232 | 46817 | 910.61 | 202 | 196 | 51.2 |
| D | 10 | 70 | 28695 | 556.65 | 202 | 196 | 51.2 |
| D | 13 | 189 | 15217 | 293.39 | 202 | 196 | 51.2 |
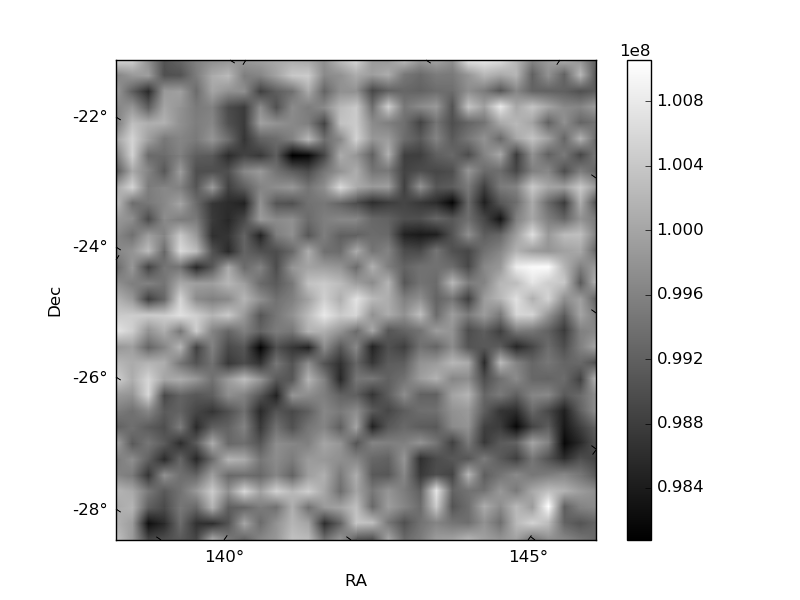
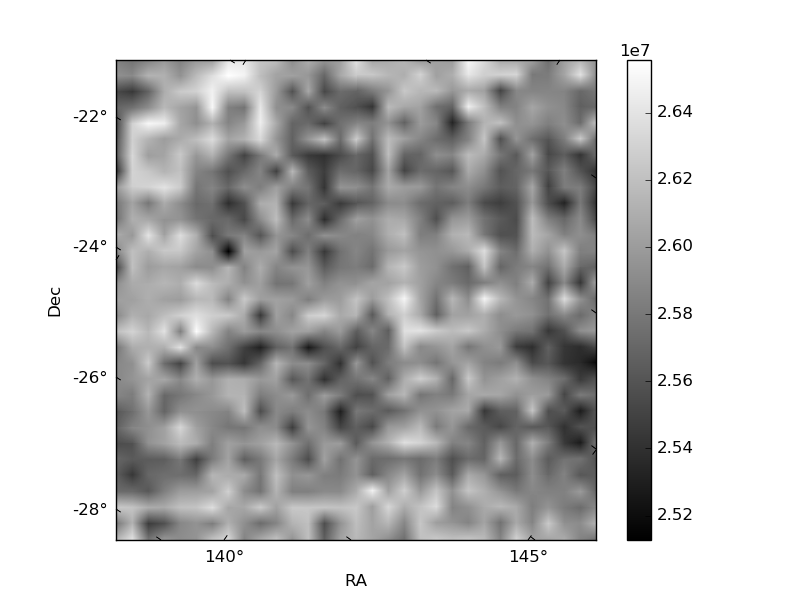
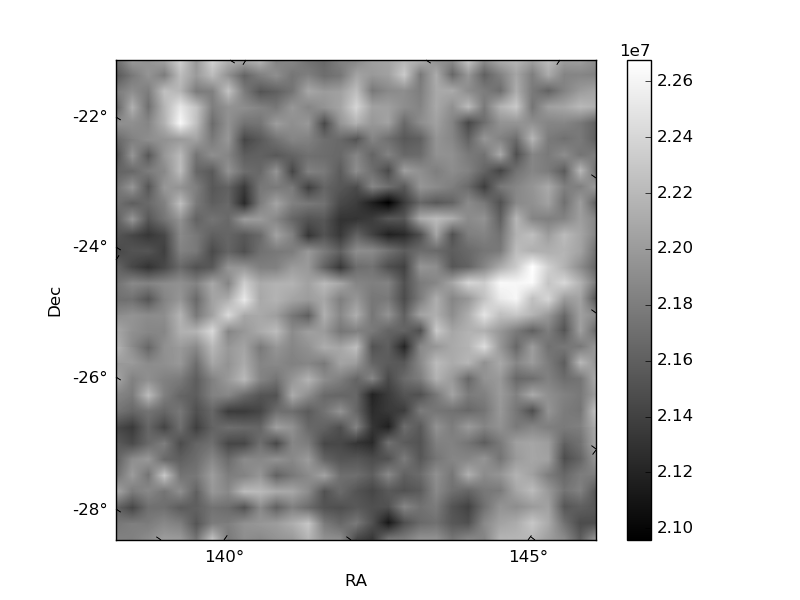
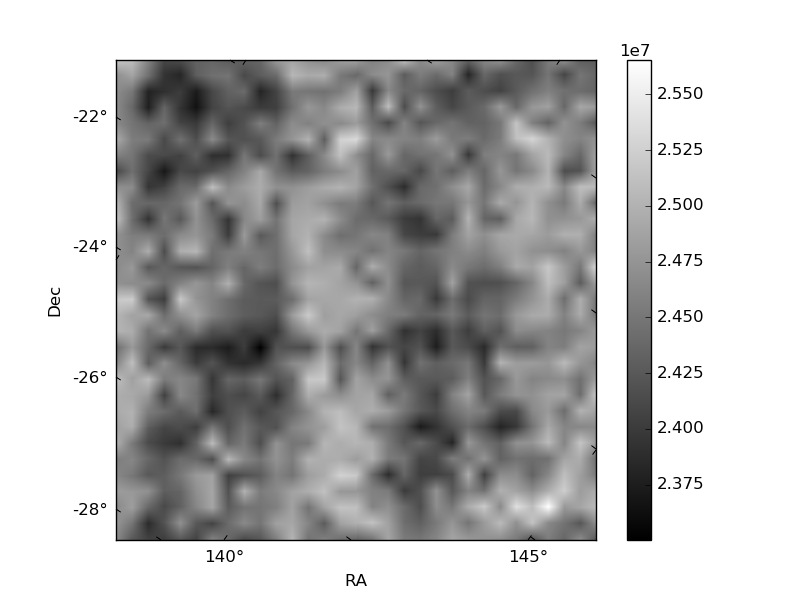
Histogram calculated using DETX and DETY for each event in the final _common_clean file
| Quadrant A | 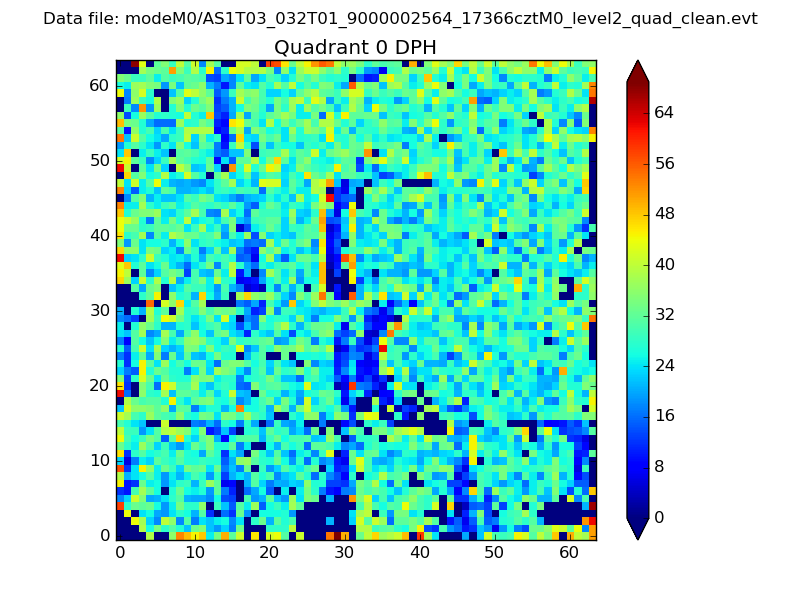 |
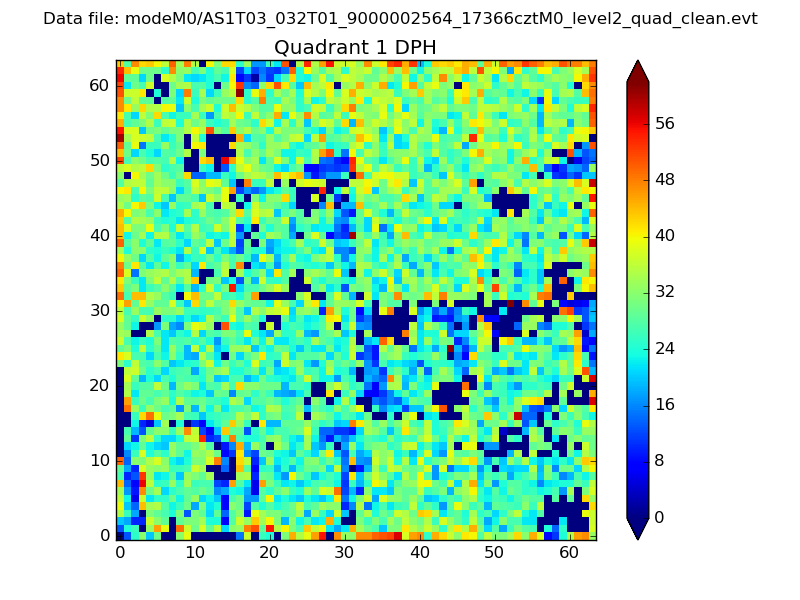 |
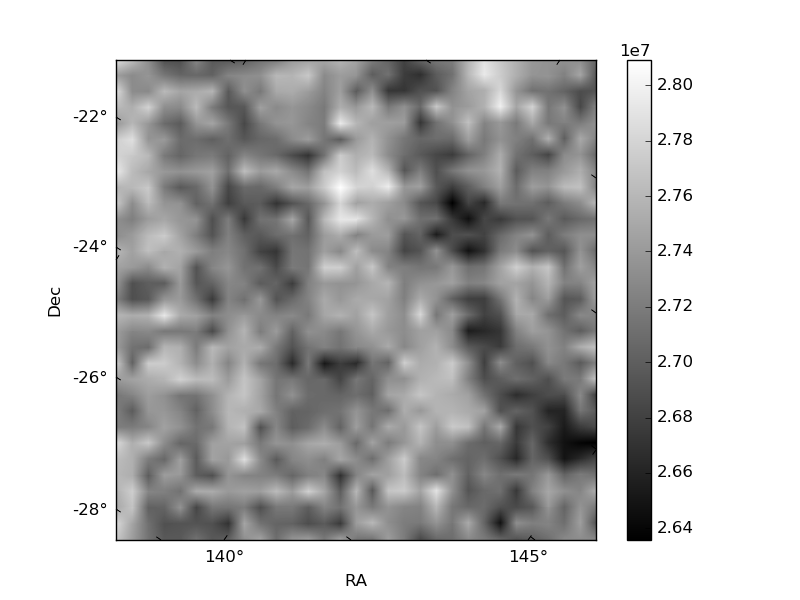
Quadrant B |
|---|---|---|---|
| Quadrant D | 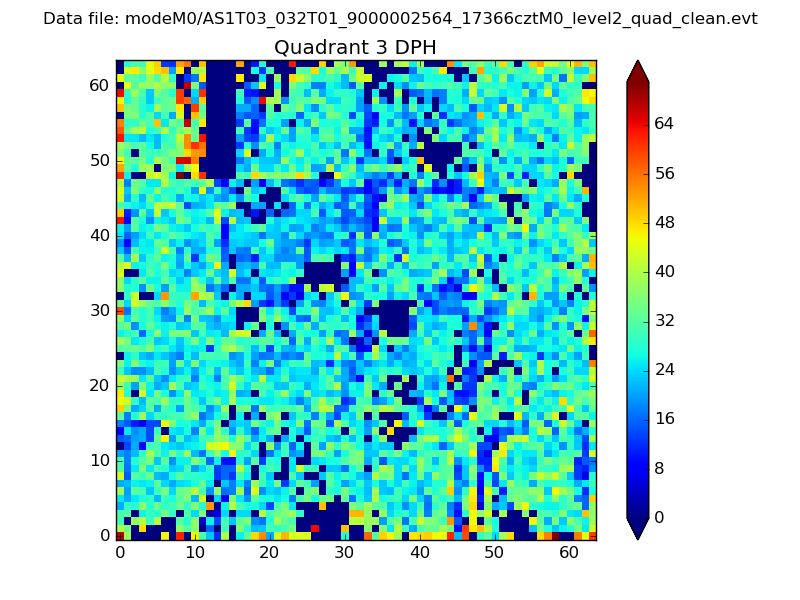 |
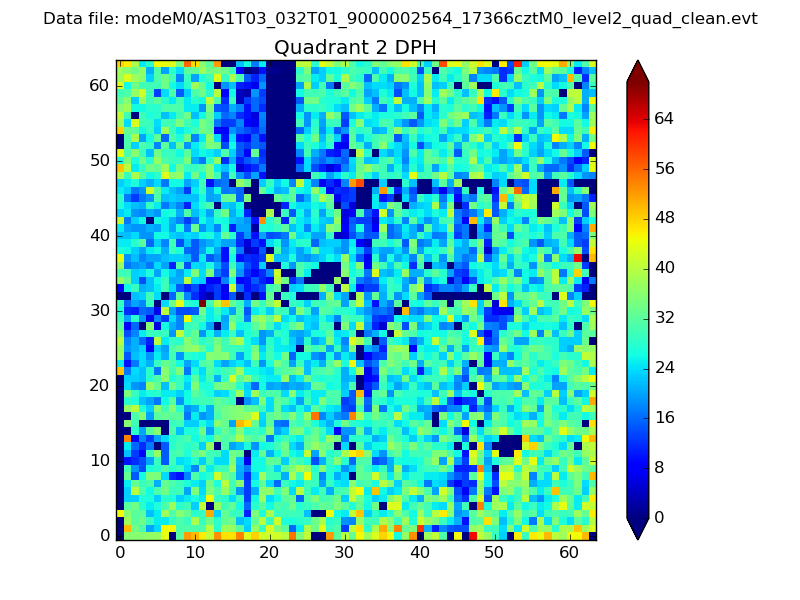 |
Quadrant C |
| Plot type | Count rate plots | Images |
|---|---|---|
| Comparison with Poisson distribution Blue bars denote a histogram of data divided into 1 sec bins. Red curve is a Poisson curve with rate = median count rate of data. |
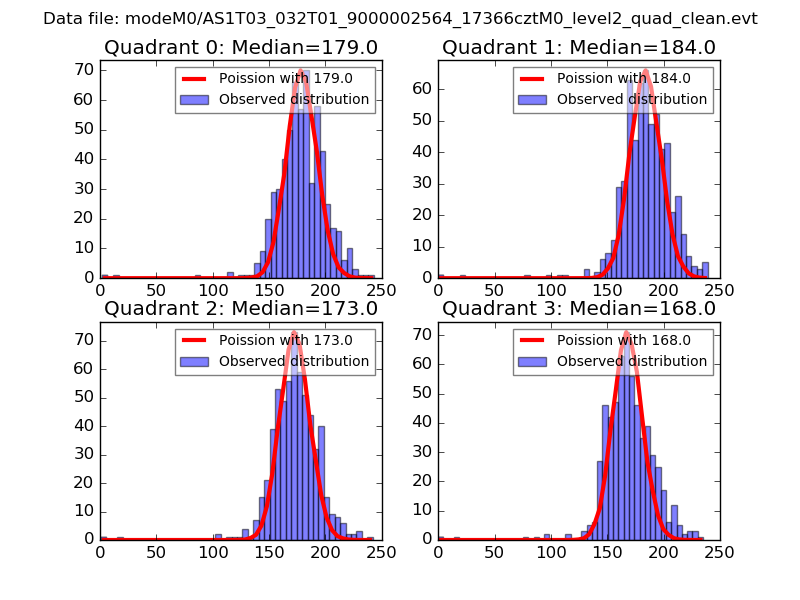 |
 |
| Quadrant-wise count rates Data is divided into 100 sec bins |
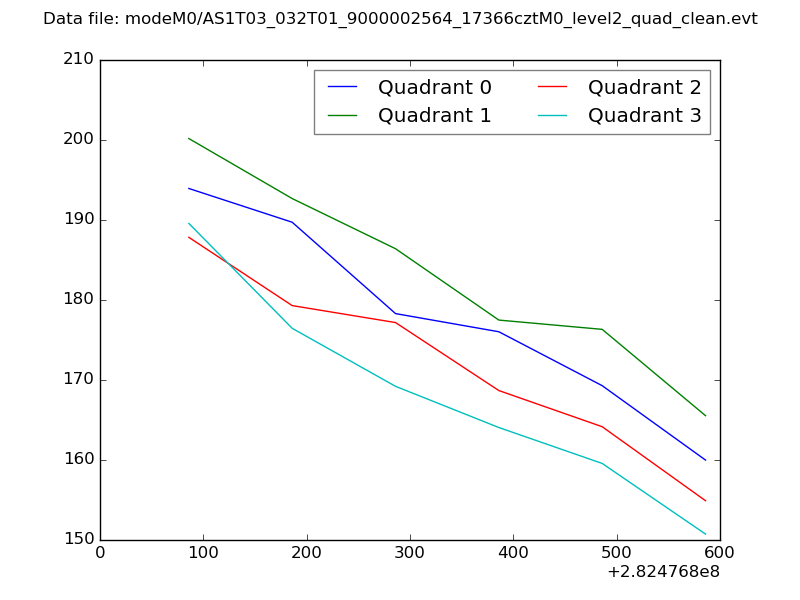 |
|
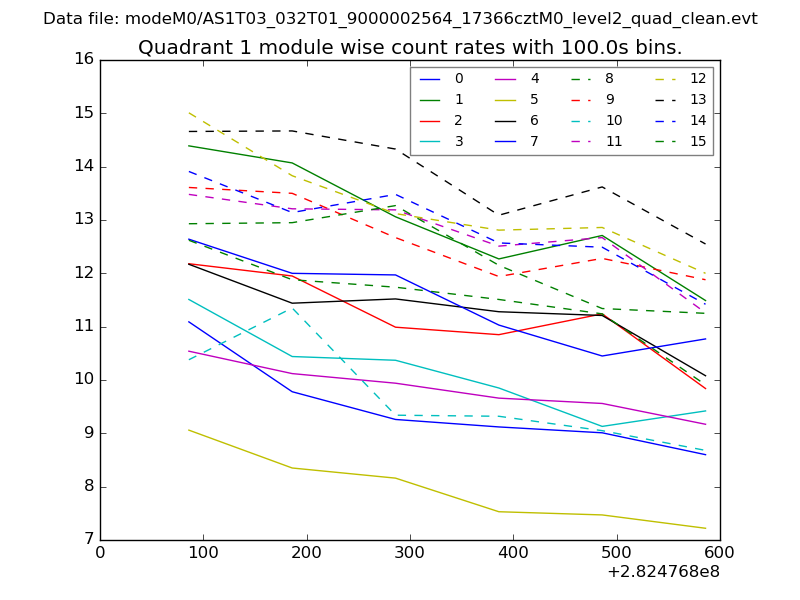
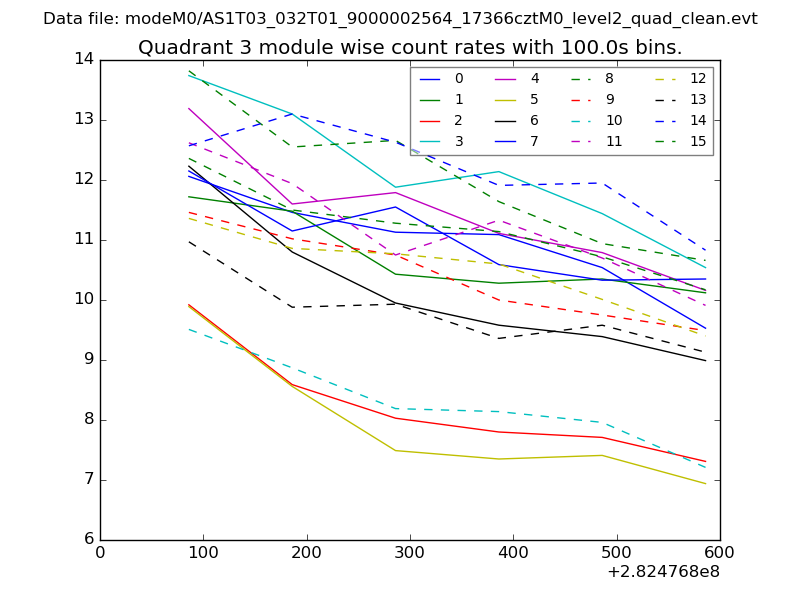
| Module-wise count rates for Quadrant A Data is divided into 100 sec bins |
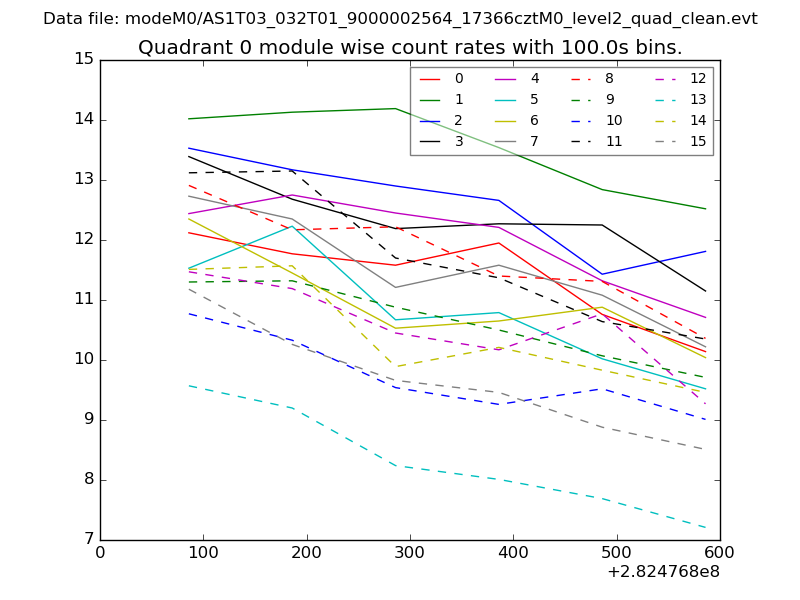 |
 |
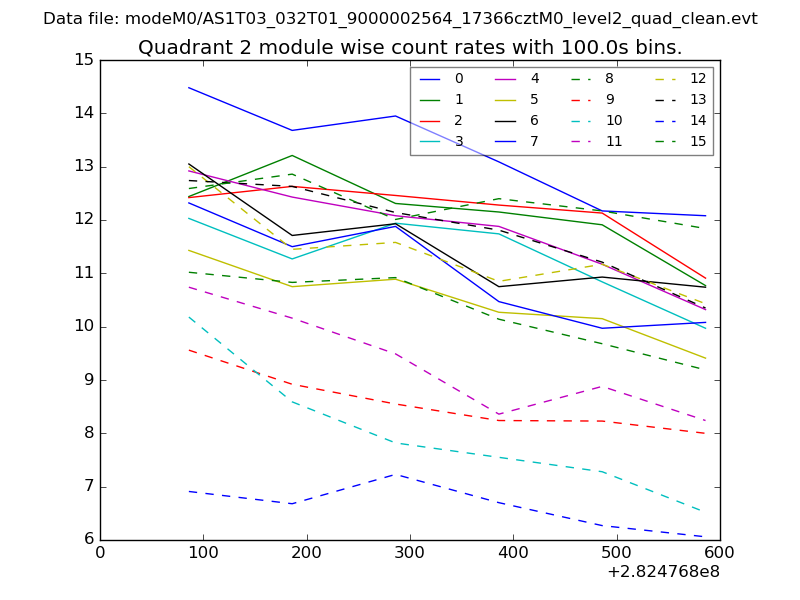
| Module-wise count rates for Quadrant B Data is divided into 100 sec bins |
 |
 |
| Module-wise count rates for Quadrant C Data is divided into 100 sec bins |
 |
 |
| Module-wise count rates for Quadrant D Data is divided into 100 sec bins |
 |
 |
| Parameter | Plot |
|---|---|
| CZT HV Monitor | 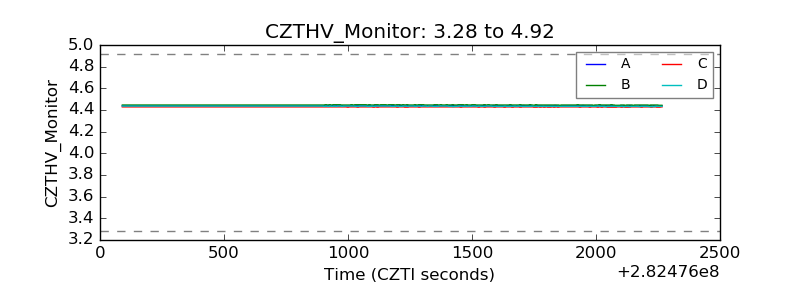 |
| D_VDD | 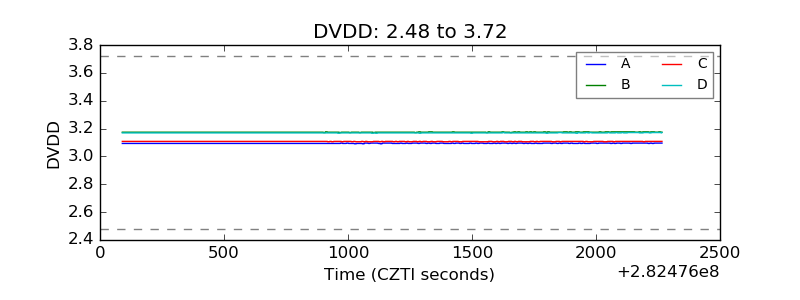 |
| Temperature 1 | 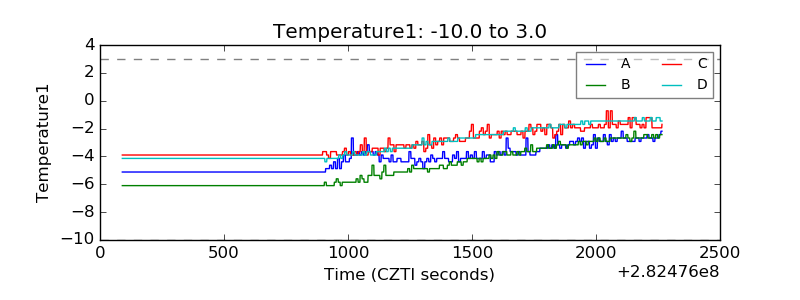 |
| Veto HV Monitor | 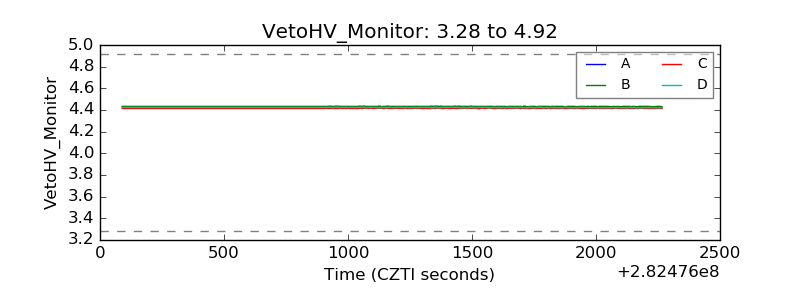 |
| Veto LLD | 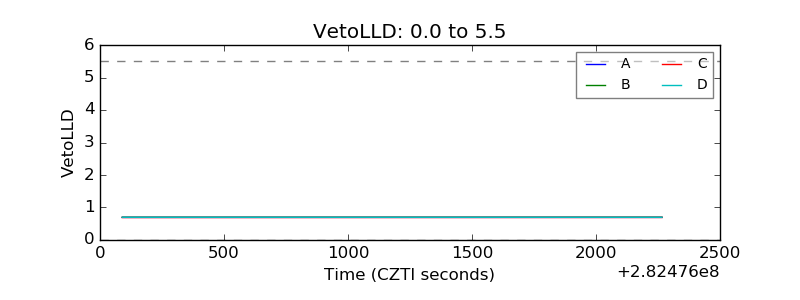 |
| Alpha Counter | 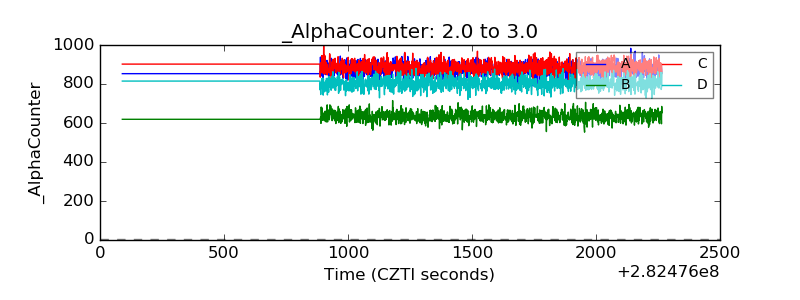 |
| _CPM_Rate | 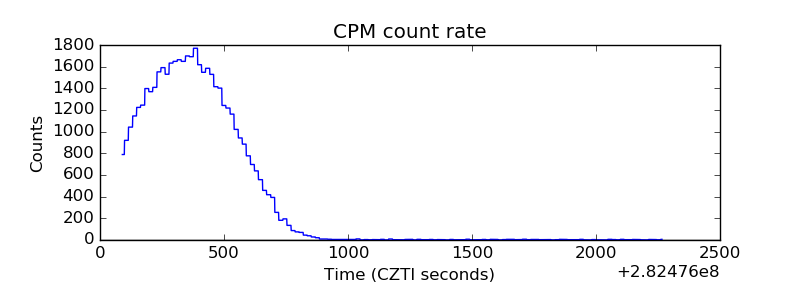 |
| CZT Counter | 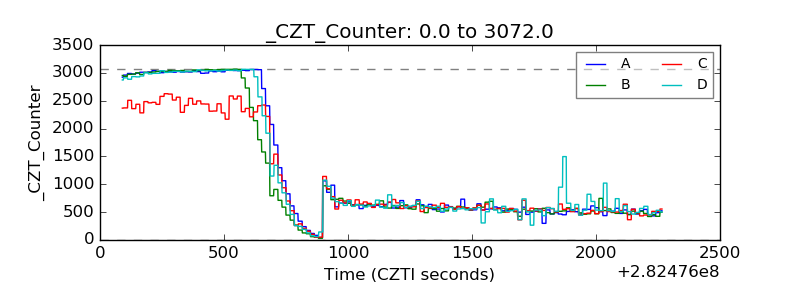 |
| +2.5 Volts monitor |  |
| +5 Volts monitor |  |
| _ROLL_ROT | 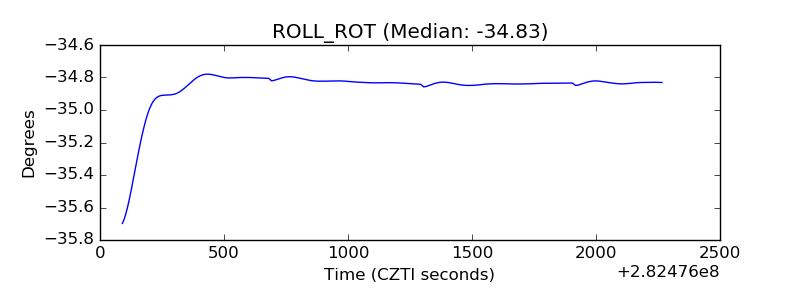 |
| _Roll_DEC | 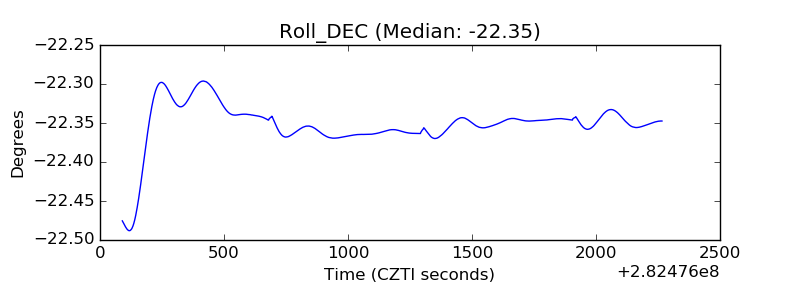 |
| _Roll_RA | 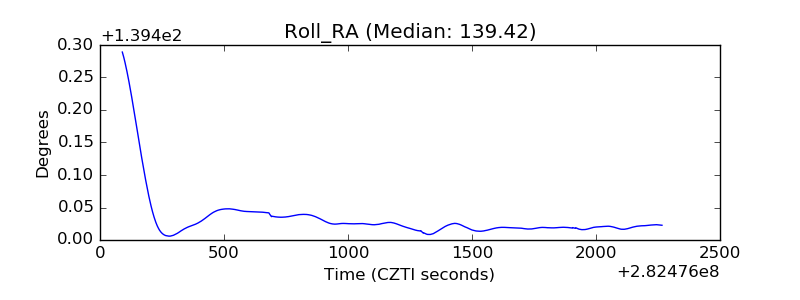 |
| Veto Counter | 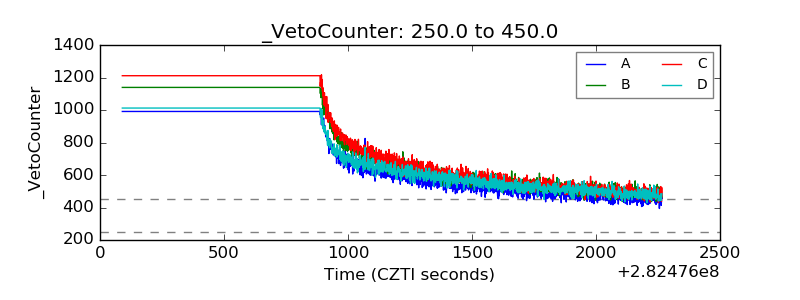 |