| Param | Original file | Final file |
|---|---|---|
| Filename | modeM0/AS1T03_032T01_9000002564_17367cztM0_level2.evt | modeM0/AS1T03_032T01_9000002564_17367cztM0_level2_quad_clean.evt |
| Size (bytes) | 510,595,200 | 72,532,800 |
| Size | 486.9 MB | 69.2 MB |
| Events in quadrant A | 3,506,669 | 441,481 |
| Events in quadrant B | 3,531,590 | 448,565 |
| Events in quadrant C | 3,564,428 | 424,348 |
| Events in quadrant D | 4,405,533 | 414,151 |
| Mode M9 | |||
|---|---|---|---|
| Quadrant | BADHDUFLAG | Total packets | Discarded packets |
| A | 0 | 15 | 0 |
| B | 0 | 16 | 0 |
| C | 0 | 16 | 0 |
| D | 0 | 16 | 0 |
| Mode SS | |||
|---|---|---|---|
| Quadrant | BADHDUFLAG | Total packets | Discarded packets |
| A | 0 | 138 | 0 |
| B | 0 | 138 | 0 |
| C | 0 | 138 | 0 |
| D | 0 | 138 | 0 |
| Mode M0 | |||
|---|---|---|---|
| Quadrant | BADHDUFLAG | Total packets | Discarded packets |
| A | 0 | 14611 | 2 |
| B | 0 | 14602 | 2 |
| C | 0 | 14783 | 2 |
| D | 0 | 17553 | 2 |
| Quadrant | Total seconds | Saturated seconds | Saturation percentage |
|---|---|---|---|
| A | 6703 | 77 | 1.148739% |
| B | 6703 | 73 | 1.089065% |
| C | 6703 | 103 | 1.536625% |
| D | 6703 | 220 | 3.282112% |
Noise dominated data is calculated using 1-second bins in cleaned event files. If a bin has >2000 counts, and if more than 50% of those come from <1% of pixels, then it is considered to be noise-dominated and hence unusable.
| Quadrant | # 1 sec bins | Bins with >0 counts | Bins with >2000 counts | High rate bins dominated by noise | Noise dominated (total time) | Noise dominated (detector-on time) | Marked lightcurve |
|---|---|---|---|---|---|---|---|
| A | 7933 | 6704 | 0 | 0 | 0.00% | 0.00% | 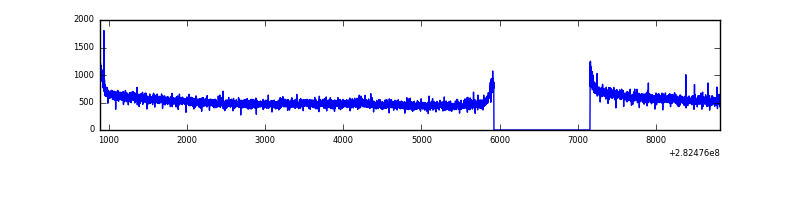 |
| B | 7933 | 6704 | 0 | 0 | 0.00% | 0.00% | 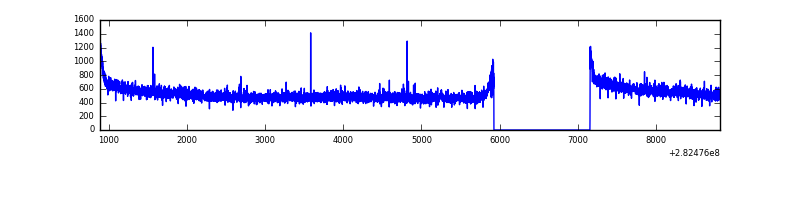 |
| C | 7933 | 6704 | 0 | 0 | 0.00% | 0.00% | 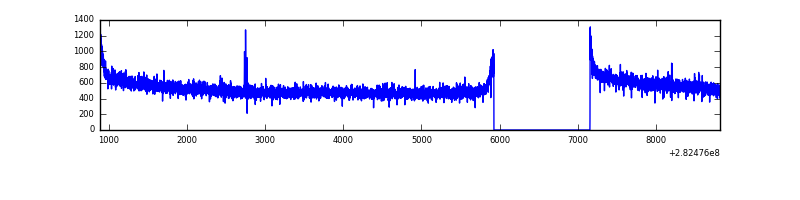 |
| D | 7933 | 6704 | 100 | 100 | 1.26% | 1.49% | 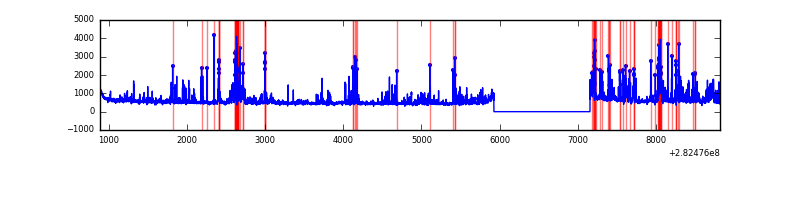 |
Top three noisy pixels from each quadrant. If the there are fewer than three noisy pixels in the level2.evt file, extra rows are filled as -1
| Pixel properties | Quadrant properties | ||||||
|---|---|---|---|---|---|---|---|
| Quadrant | DetID | PixID | Counts | Sigma | Mean | Median | Sigma |
| A | 6 | 16 | 11795 | 60.31 | 910 | 892 | 180.8 |
| A | 0 | 226 | 7977 | 39.19 | 910 | 892 | 180.8 |
| A | 12 | 194 | 6475 | 30.88 | 910 | 892 | 180.8 |
| B | 12 | 111 | 19455 | 110.52 | 900 | 878 | 168.1 |
| B | 11 | 111 | 17099 | 96.5 | 900 | 878 | 168.1 |
| B | 14 | 111 | 15058 | 84.36 | 900 | 878 | 168.1 |
| C | 14 | 238 | 136329 | 677.74 | 870 | 879 | 199.9 |
| C | 3 | 233 | 25085 | 121.12 | 870 | 879 | 199.9 |
| C | 0 | 79 | 10701 | 49.15 | 870 | 879 | 199.9 |
| D | 13 | 232 | 559044 | 2643.66 | 875 | 851 | 211.1 |
| D | 10 | 70 | 202204 | 953.63 | 875 | 851 | 211.1 |
| D | 13 | 189 | 185411 | 874.09 | 875 | 851 | 211.1 |
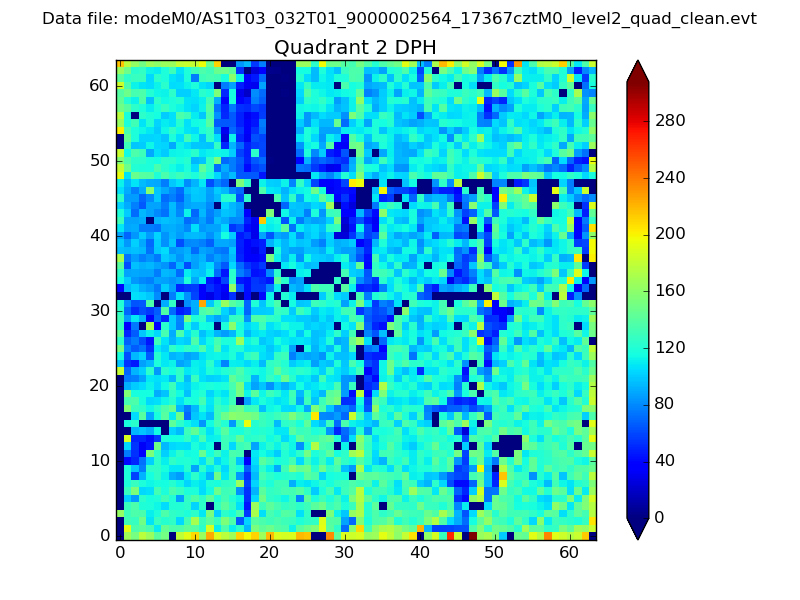
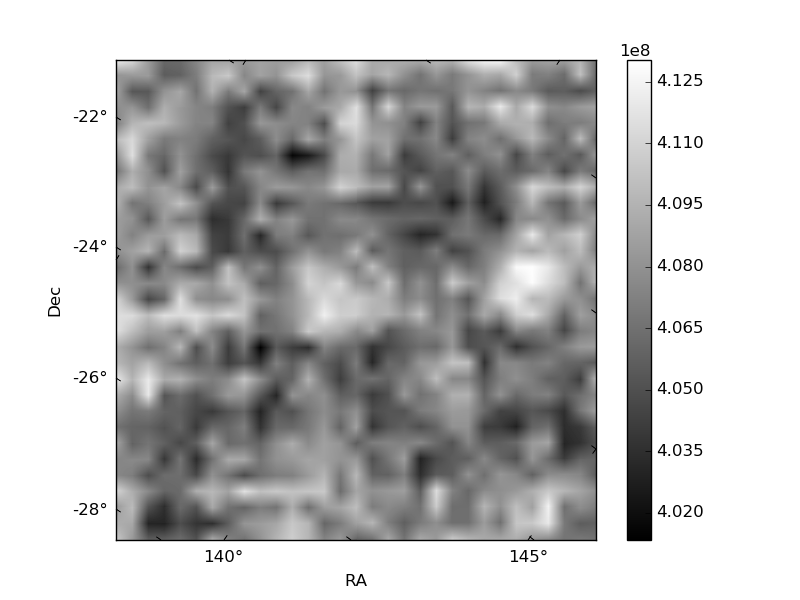
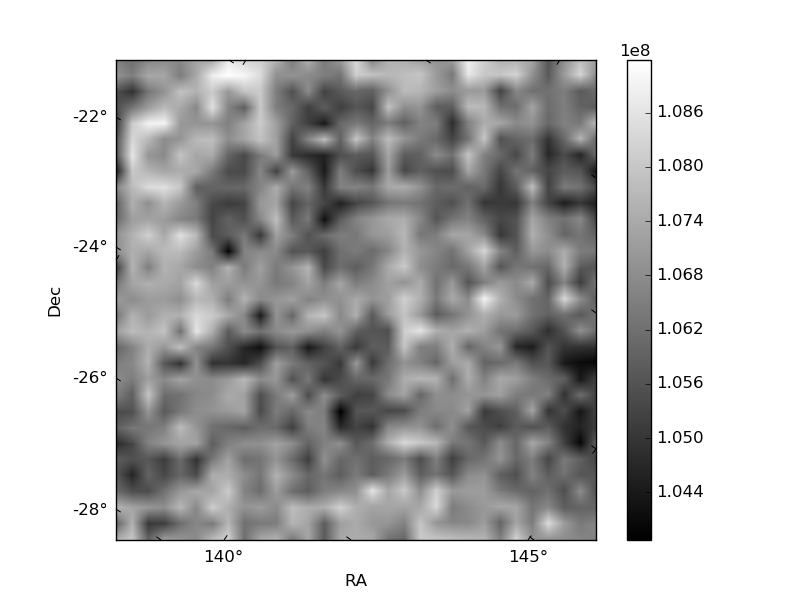
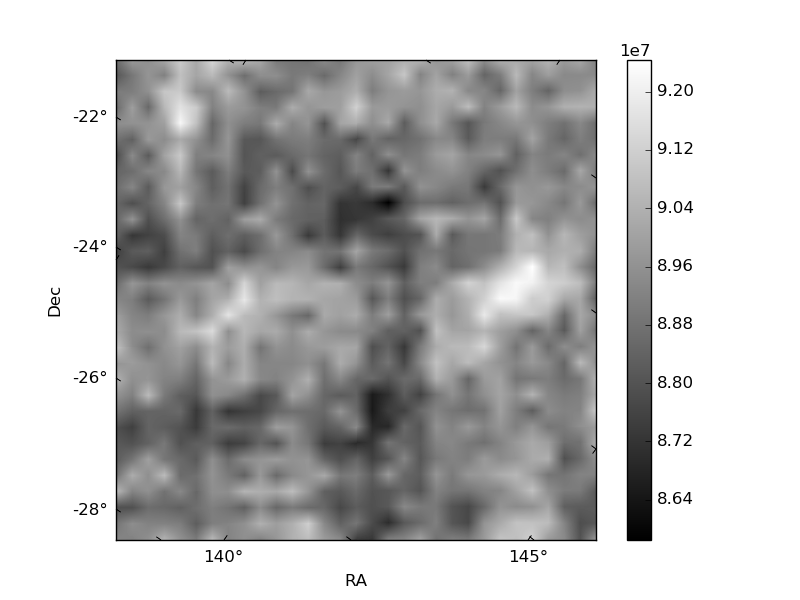
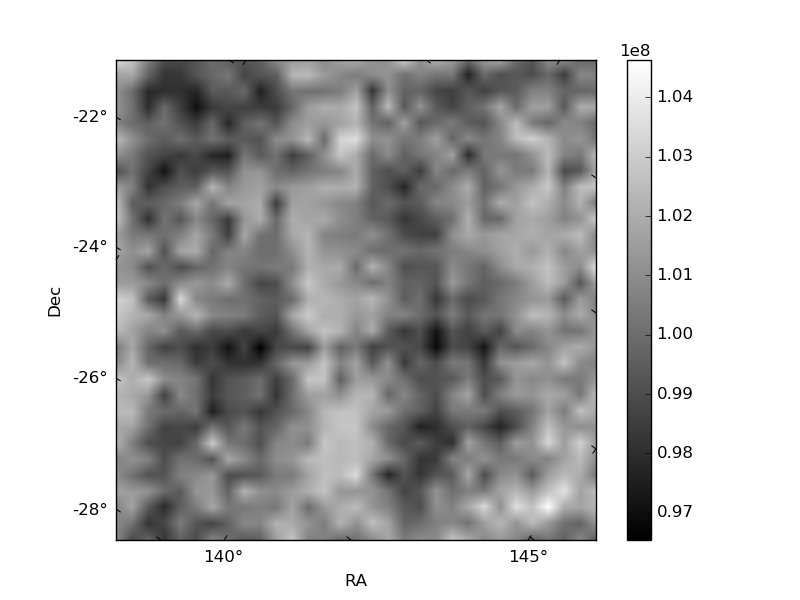
Histogram calculated using DETX and DETY for each event in the final _common_clean file
| Quadrant A | 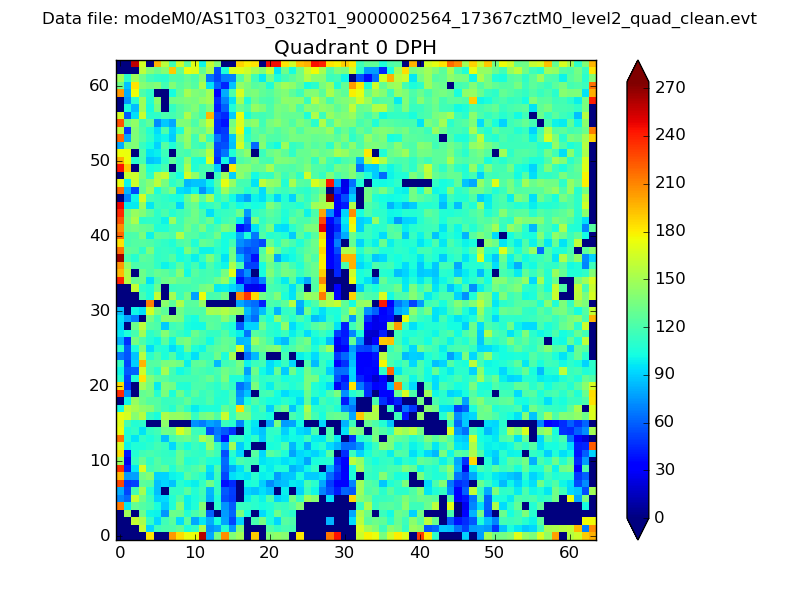 |
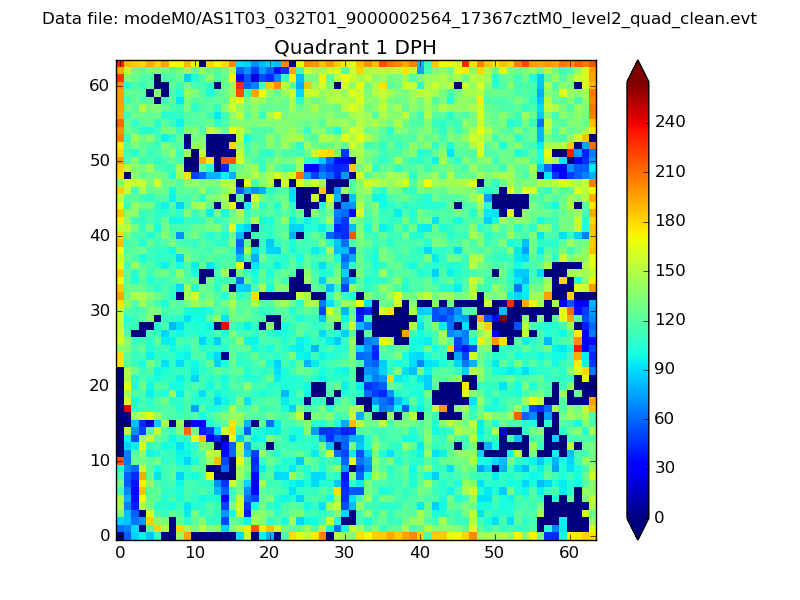 |
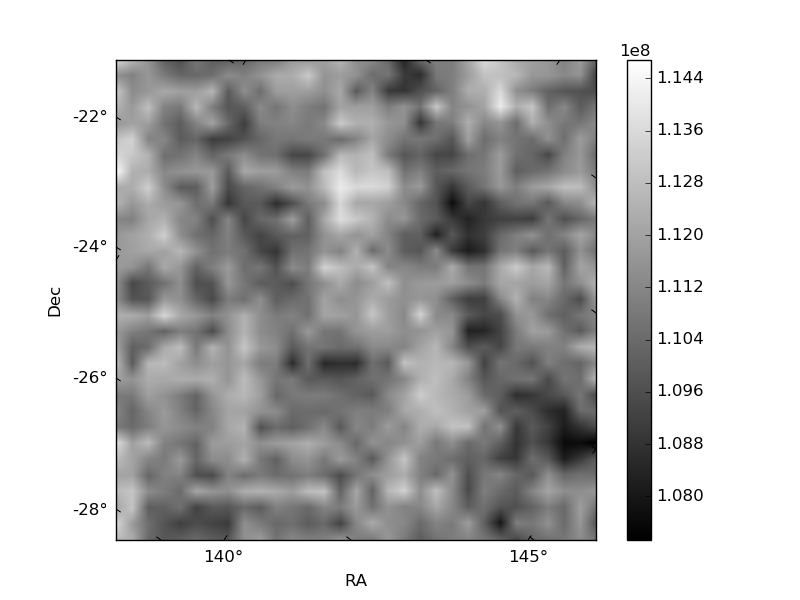
Quadrant B |
|---|---|---|---|
| Quadrant D | 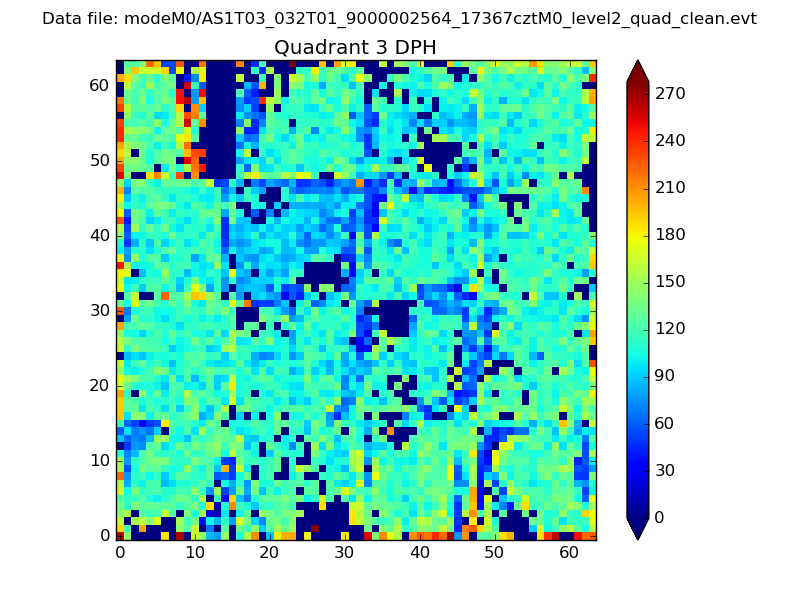 |
 |
Quadrant C |
| Plot type | Count rate plots | Images |
|---|---|---|
| Comparison with Poisson distribution Blue bars denote a histogram of data divided into 1 sec bins. Red curve is a Poisson curve with rate = median count rate of data. |
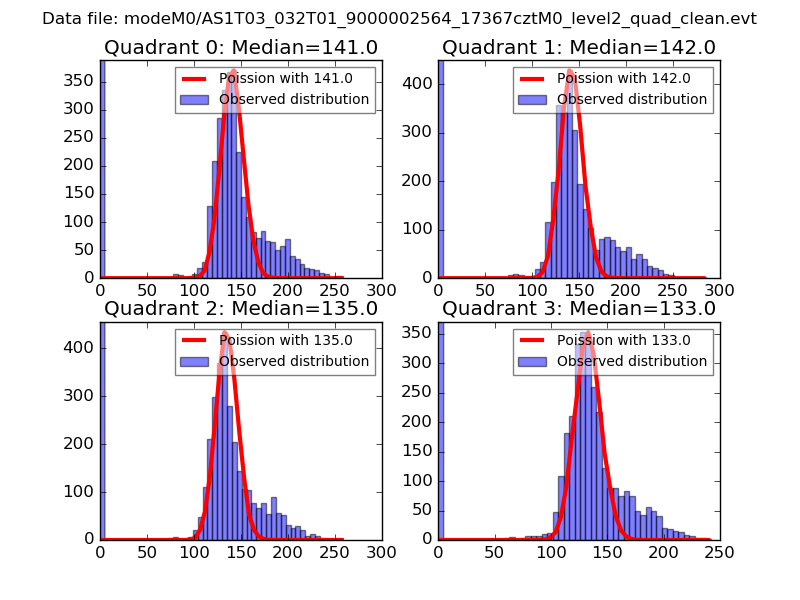 |
 |
| Quadrant-wise count rates Data is divided into 100 sec bins |
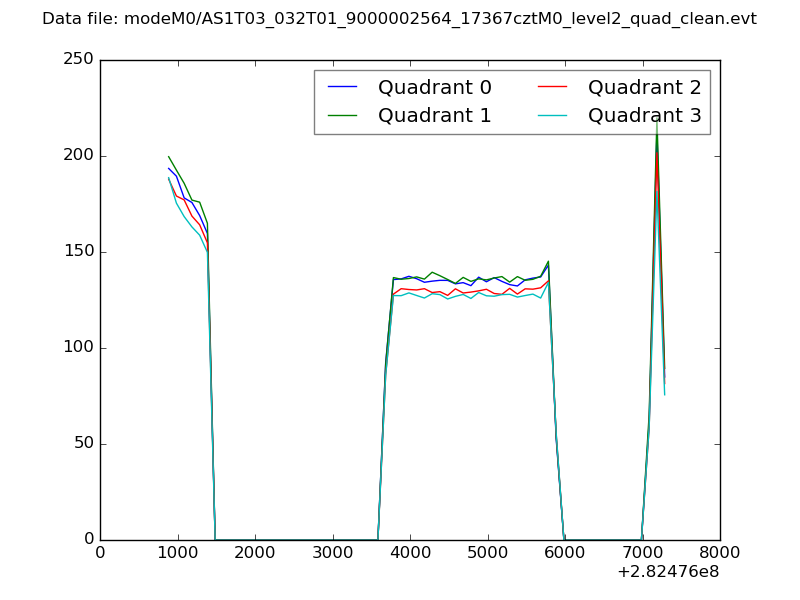 |
|
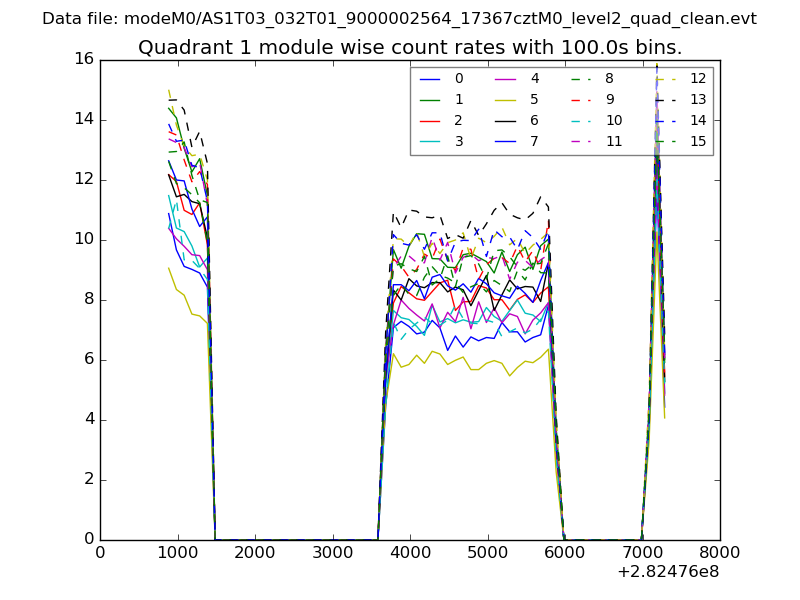
| Module-wise count rates for Quadrant A Data is divided into 100 sec bins |
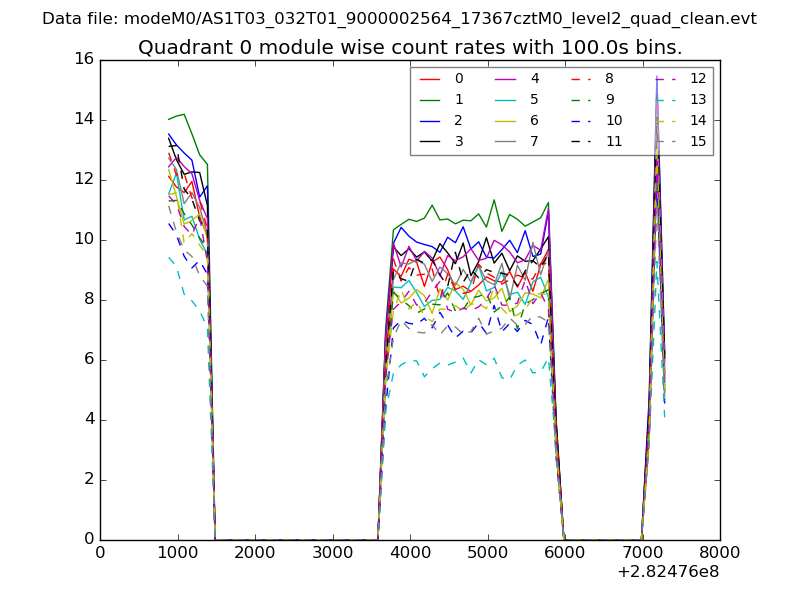 |
 |
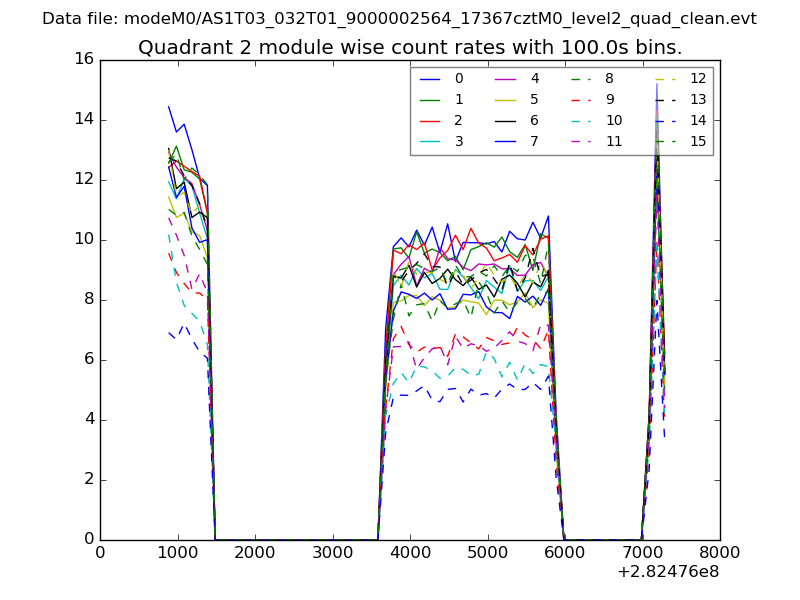
| Module-wise count rates for Quadrant B Data is divided into 100 sec bins |
 |
 |
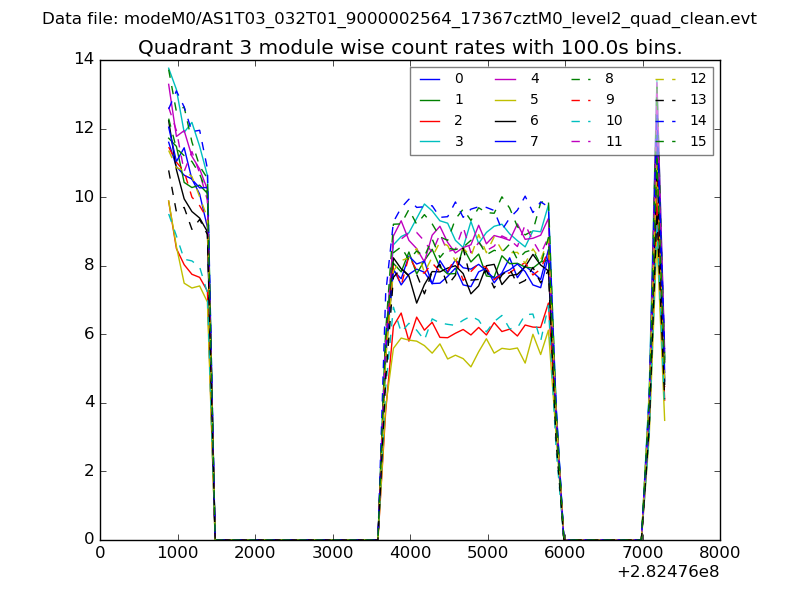
| Module-wise count rates for Quadrant C Data is divided into 100 sec bins |
 |
 |
| Module-wise count rates for Quadrant D Data is divided into 100 sec bins |
 |
 |
| Parameter | Plot |
|---|---|
| CZT HV Monitor | 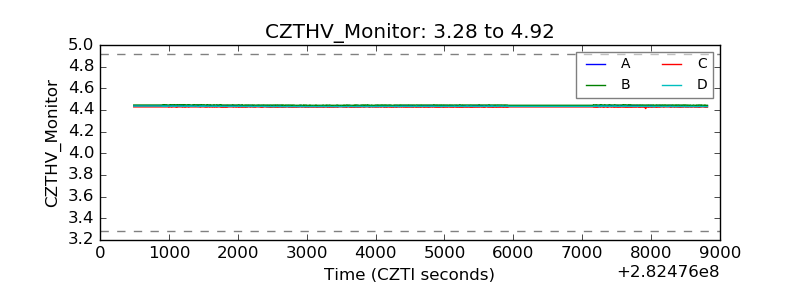 |
| D_VDD | 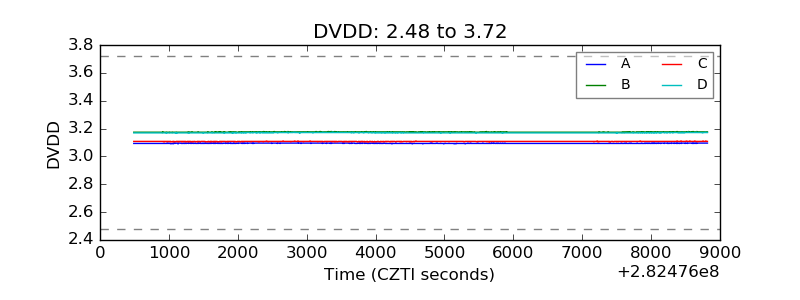 |
| Temperature 1 | 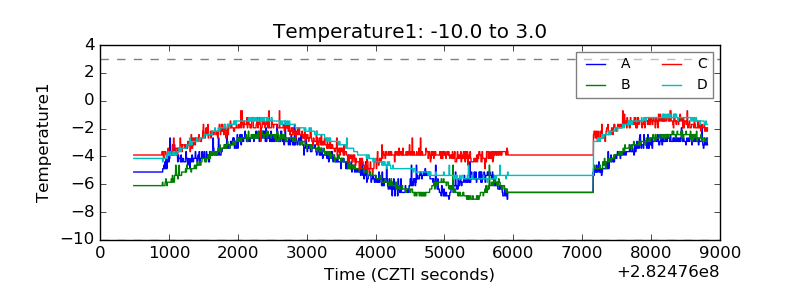 |
| Veto HV Monitor | 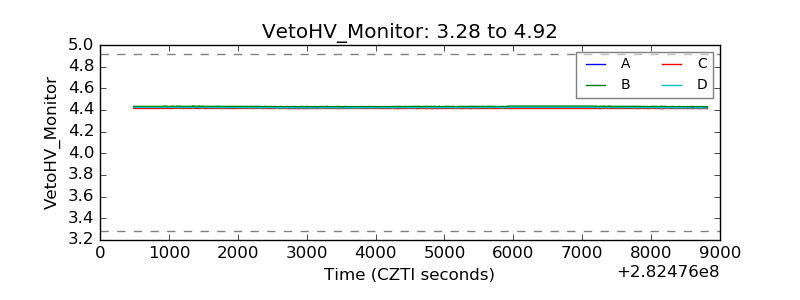 |
| Veto LLD | 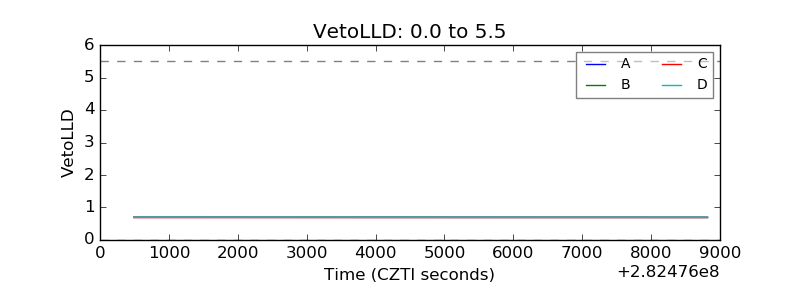 |
| Alpha Counter | 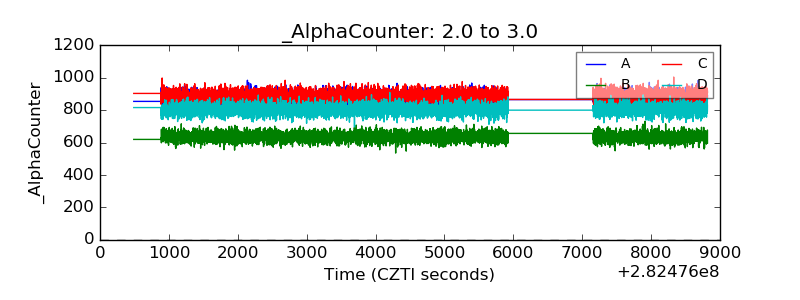 |
| _CPM_Rate | 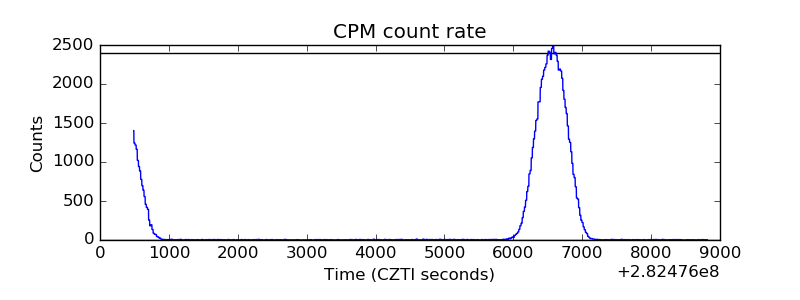 |
| CZT Counter | 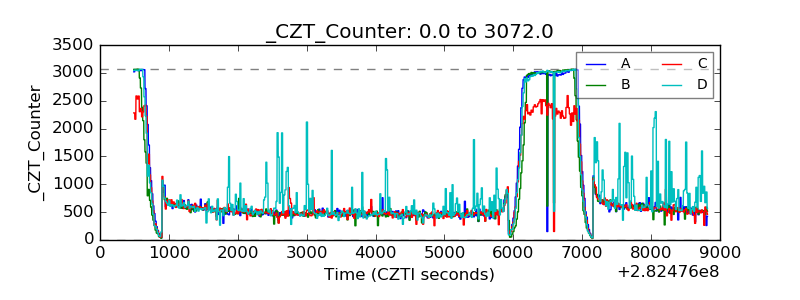 |
| +2.5 Volts monitor | 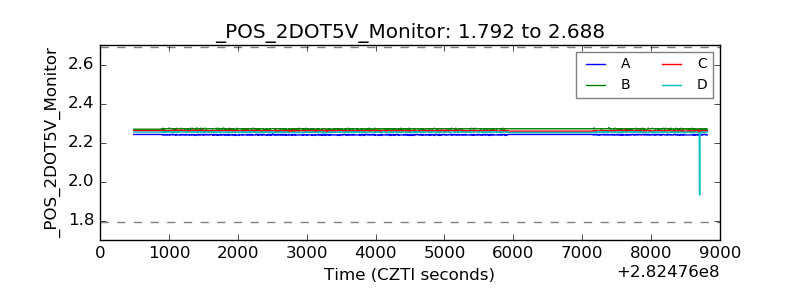 |
| +5 Volts monitor | 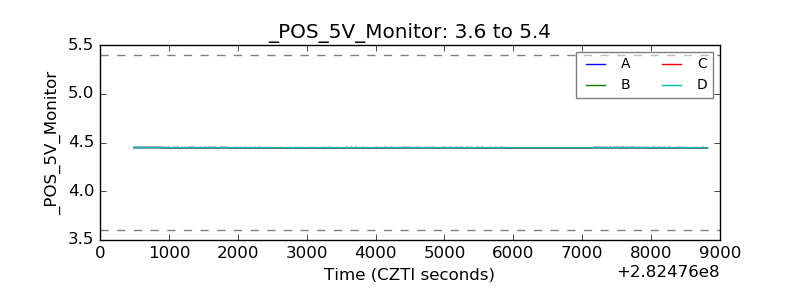 |
| _ROLL_ROT | 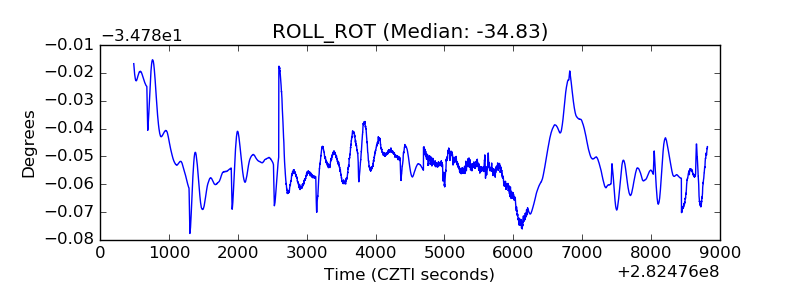 |
| _Roll_DEC | 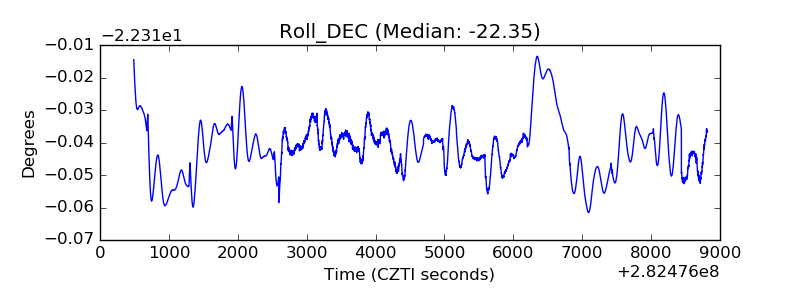 |
| _Roll_RA | 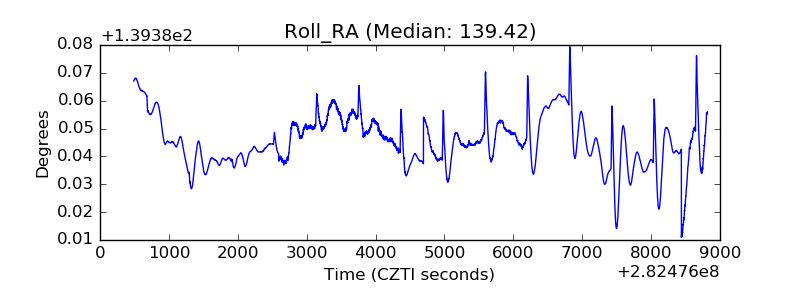 |
| Veto Counter | 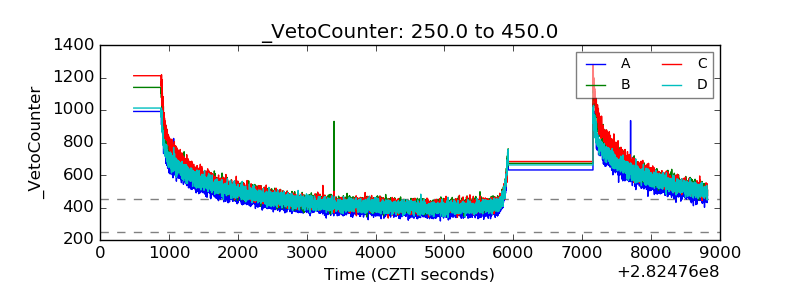 |