| Param | Original file | Final file |
|---|---|---|
| Filename | modeM0/AS1T03_033T01_9000002568cztM0_level2.fits | modeM0/AS1T03_033T01_9000002568cztM0_level2_quad_clean.evt |
| Size (bytes) | 400,489,920 | 352,310,400 |
| Size | 381.9 MB | 336.0 MB |
| Events in quadrant A | 2,478,472 | 2,039,937 |
| Events in quadrant B | 2,378,438 | 2,057,956 |
| Events in quadrant C | 2,417,646 | 1,953,802 |
| Events in quadrant D | 1,889,836 | 1,656,086 |
| Mode M0 | |||
|---|---|---|---|
| Quadrant | BADHDUFLAG | Total packets | Discarded packets |
| A | 0 | 88926 | 0 |
| B | 0 | 89816 | 0 |
| C | 0 | 88796 | 0 |
| D | 0 | 169475 | 0 |
| Mode M9 | |||
|---|---|---|---|
| Quadrant | BADHDUFLAG | Total packets | Discarded packets |
| A | 0 | 42 | 0 |
| B | 0 | 42 | 0 |
| C | 0 | 42 | 0 |
| D | 0 | 42 | 0 |
| Mode SS | |||
|---|---|---|---|
| Quadrant | BADHDUFLAG | Total packets | Discarded packets |
| A | 0 | 878 | 0 |
| B | 0 | 878 | 0 |
| C | 0 | 878 | 0 |
| D | 0 | 878 | 0 |
| Quadrant | Total seconds | Saturated seconds | Saturation percentage |
|---|---|---|---|
| A | 43135 | 318 | 0.737220% |
| B | 43135 | 500 | 1.159152% |
| C | 43135 | 563 | 1.305205% |
| D | 43135 | 7593 | 17.602875% |
Noise dominated data is calculated using 1-second bins in cleaned event files. If a bin has >2000 counts, and if more than 50% of those come from <1% of pixels, then it is considered to be noise-dominated and hence unusable.
| Quadrant | # 1 sec bins | Bins with >0 counts | Bins with >2000 counts | High rate bins dominated by noise | Noise dominated (total time) | Noise dominated (detector-on time) | Marked lightcurve |
|---|---|---|---|---|---|---|---|
| A | 47245 | 43133 | 0 | 0 | 0.00% | 0.00% | 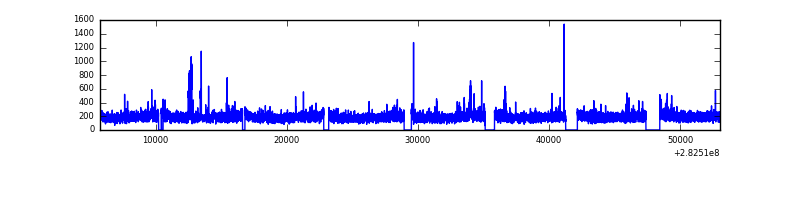 |
| B | 47245 | 43132 | 0 | 0 | 0.00% | 0.00% |  |
| C | 47245 | 43133 | 0 | 0 | 0.00% | 0.00% |  |
| D | 47245 | 42987 | 0 | 0 | 0.00% | 0.00% |  |
Top three noisy pixels from each quadrant. If the there are fewer than three noisy pixels in the level2.evt file, extra rows are filled as -1
| Pixel properties | Quadrant properties | ||||||
|---|---|---|---|---|---|---|---|
| Quadrant | DetID | PixID | Counts | Sigma | Mean | Median | Sigma |
| A | 0 | 29 | 2385 | 10.8 | 645 | 601 | 165.1 |
| A | 7 | 110 | 2001 | 8.48 | 645 | 601 | 165.1 |
| A | 0 | 30 | 1919 | 7.98 | 645 | 601 | 165.1 |
| B | 2 | 9 | 2035 | 11.31 | 628 | 597 | 127.1 |
| B | 2 | 8 | 1685 | 8.56 | 628 | 597 | 127.1 |
| B | 3 | 17 | 1568 | 7.64 | 628 | 597 | 127.1 |
| C | 12 | 241 | 1692 | 6.64 | 639 | 594 | 165.4 |
| C | 3 | 126 | 1657 | 6.43 | 639 | 594 | 165.4 |
| C | 3 | 158 | 1625 | 6.23 | 639 | 594 | 165.4 |
| D | 3 | 14 | 1406 | 6.27 | 540 | 490 | 146.0 |
| D | 3 | 31 | 1339 | 5.81 | 540 | 490 | 146.0 |
| D | 6 | 38 | 1337 | 5.8 | 540 | 490 | 146.0 |
Histogram calculated using DETX and DETY for each event in the final _common_clean file
| Quadrant A | 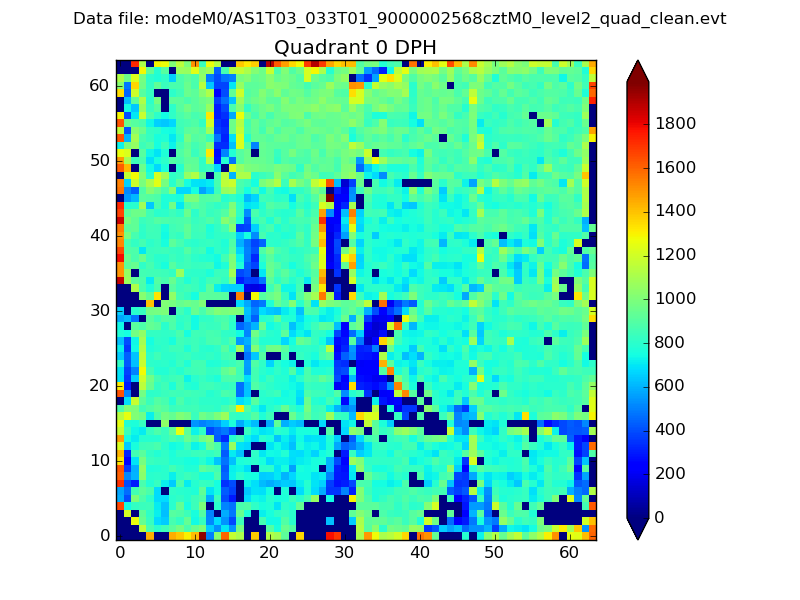 |
 |
Quadrant B |
|---|---|---|---|
| Quadrant D |  |
 |
Quadrant C |
| Plot type | Count rate plots | Images |
|---|---|---|
| Comparison with Poisson distribution Blue bars denote a histogram of data divided into 1 sec bins. Red curve is a Poisson curve with rate = median count rate of data. |
 |
 |
| Quadrant-wise count rates Data is divided into 100 sec bins |
 |
|
| Module-wise count rates for Quadrant A Data is divided into 100 sec bins |
 |
 |
| Module-wise count rates for Quadrant B Data is divided into 100 sec bins |
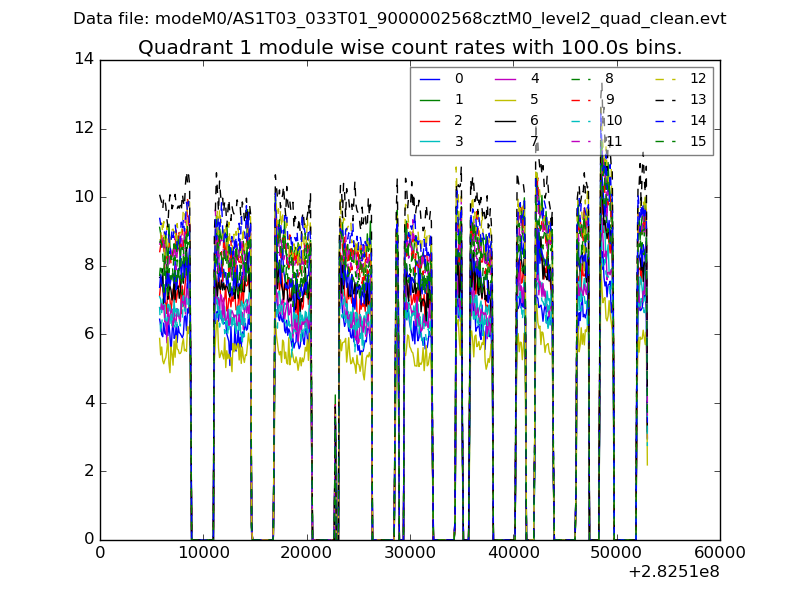 |
 |
| Module-wise count rates for Quadrant C Data is divided into 100 sec bins |
 |
 |
| Module-wise count rates for Quadrant D Data is divided into 100 sec bins |
 |
 |
| Parameter | Plot |
|---|---|
| CZT HV Monitor |  |
| D_VDD |  |
| Temperature 1 |  |
| Veto HV Monitor | 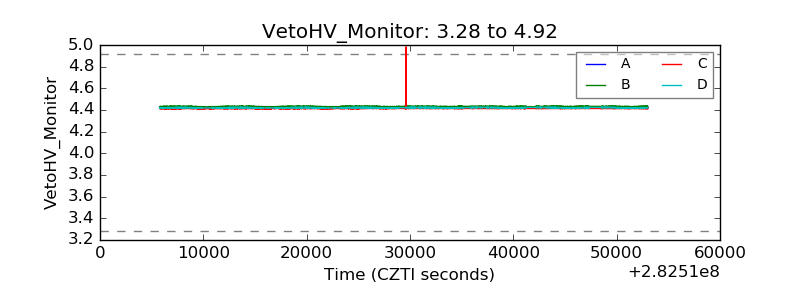 |
| Veto LLD |  |
| Alpha Counter |  |
| _CPM_Rate | 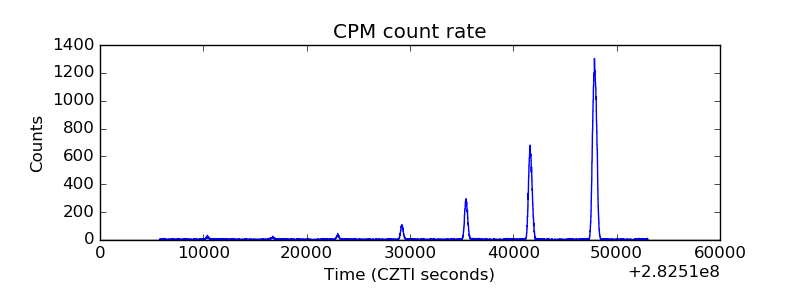 |
| CZT Counter |  |
| +2.5 Volts monitor |  |
| +5 Volts monitor |  |
| _ROLL_ROT |  |
| _Roll_DEC |  |
| _Roll_RA | 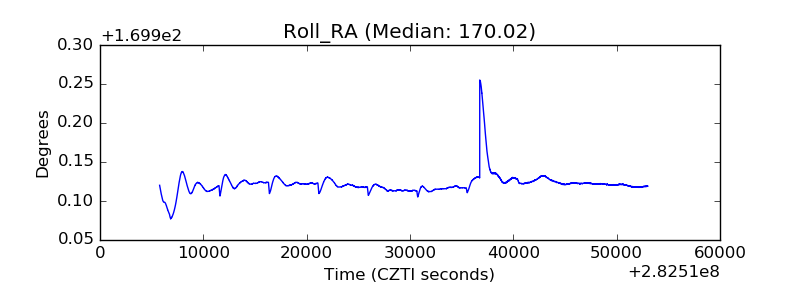 |
| Veto Counter |  |