| Param | Original file | Final file |
|---|---|---|
| Filename | modeM0/AS1T03_033T01_9000002568_17373cztM0_level2.evt | modeM0/AS1T03_033T01_9000002568_17373cztM0_level2_quad_clean.evt |
| Size (bytes) | 542,148,480 | 76,426,560 |
| Size | 517.0 MB | 72.9 MB |
| Events in quadrant A | 2,729,590 | 488,024 |
| Events in quadrant B | 2,886,685 | 492,977 |
| Events in quadrant C | 2,805,721 | 477,506 |
| Events in quadrant D | 7,598,100 | 444,695 |
| Mode M0 | |||
|---|---|---|---|
| Quadrant | BADHDUFLAG | Total packets | Discarded packets |
| A | 0 | 12132 | 1 |
| B | 0 | 12498 | 1 |
| C | 0 | 12152 | 1 |
| D | 0 | 26635 | 1 |
| Mode M9 | |||
|---|---|---|---|
| Quadrant | BADHDUFLAG | Total packets | Discarded packets |
| A | 0 | 3 | 0 |
| B | 0 | 3 | 0 |
| C | 0 | 3 | 0 |
| D | 0 | 3 | 0 |
| Mode SS | |||
|---|---|---|---|
| Quadrant | BADHDUFLAG | Total packets | Discarded packets |
| A | 0 | 122 | 0 |
| B | 0 | 122 | 0 |
| C | 0 | 122 | 0 |
| D | 0 | 122 | 0 |
| Quadrant | Total seconds | Saturated seconds | Saturation percentage |
|---|---|---|---|
| A | 5879 | 39 | 0.663378% |
| B | 5879 | 86 | 1.462834% |
| C | 5879 | 82 | 1.394795% |
| D | 5879 | 1536 | 26.126892% |
Noise dominated data is calculated using 1-second bins in cleaned event files. If a bin has >2000 counts, and if more than 50% of those come from <1% of pixels, then it is considered to be noise-dominated and hence unusable.
| Quadrant | # 1 sec bins | Bins with >0 counts | Bins with >2000 counts | High rate bins dominated by noise | Noise dominated (total time) | Noise dominated (detector-on time) | Marked lightcurve |
|---|---|---|---|---|---|---|---|
| A | 6209 | 5881 | 0 | 0 | 0.00% | 0.00% | 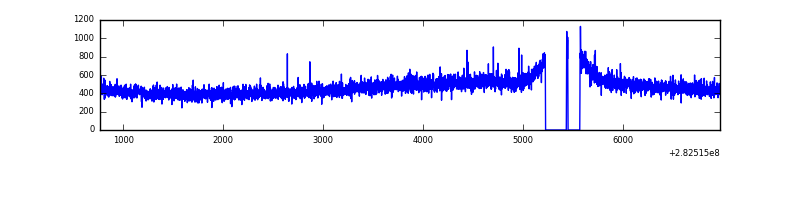 |
| B | 6209 | 5881 | 10 | 10 | 0.16% | 0.17% | 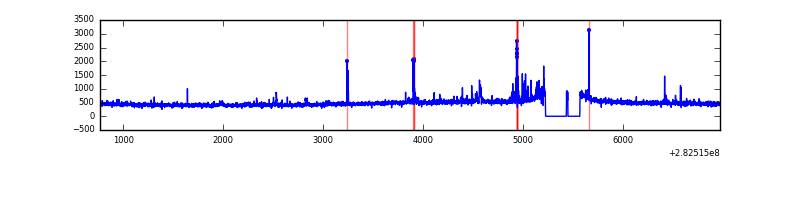 |
| C | 6209 | 5881 | 0 | 0 | 0.00% | 0.00% |  |
| D | 6209 | 5881 | 1282 | 1282 | 20.65% | 21.80% | 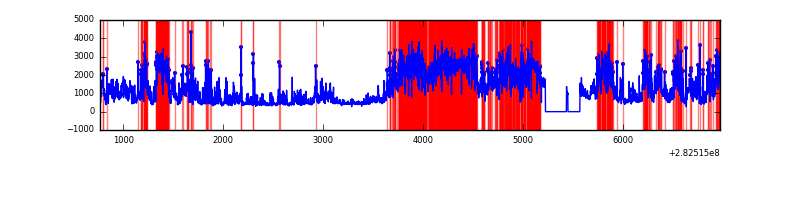 |
Top three noisy pixels from each quadrant. If the there are fewer than three noisy pixels in the level2.evt file, extra rows are filled as -1
| Pixel properties | Quadrant properties | ||||||
|---|---|---|---|---|---|---|---|
| Quadrant | DetID | PixID | Counts | Sigma | Mean | Median | Sigma |
| A | 0 | 226 | 6346 | 38.91 | 709 | 694 | 145.3 |
| A | 12 | 194 | 5192 | 30.96 | 709 | 694 | 145.3 |
| A | 3 | 137 | 5094 | 30.29 | 709 | 694 | 145.3 |
| B | 7 | 220 | 57535 | 412.21 | 706 | 688 | 137.9 |
| B | 4 | 216 | 20095 | 140.72 | 706 | 688 | 137.9 |
| B | 12 | 111 | 16116 | 111.87 | 706 | 688 | 137.9 |
| C | 14 | 238 | 104511 | 648.77 | 680 | 683 | 160.0 |
| C | 3 | 233 | 47890 | 294.97 | 680 | 683 | 160.0 |
| C | 13 | 61 | 4940 | 26.6 | 680 | 683 | 160.0 |
| D | 11 | 176 | 4238140 | 28037.32 | 609 | 591 | 151.1 |
| D | 13 | 232 | 611684 | 4043.24 | 609 | 591 | 151.1 |
| D | 7 | 238 | 124257 | 818.22 | 609 | 591 | 151.1 |
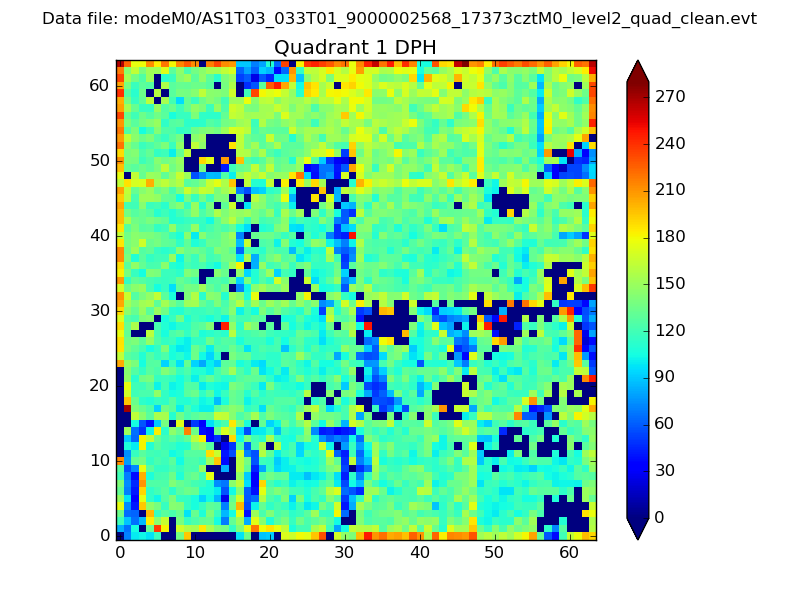
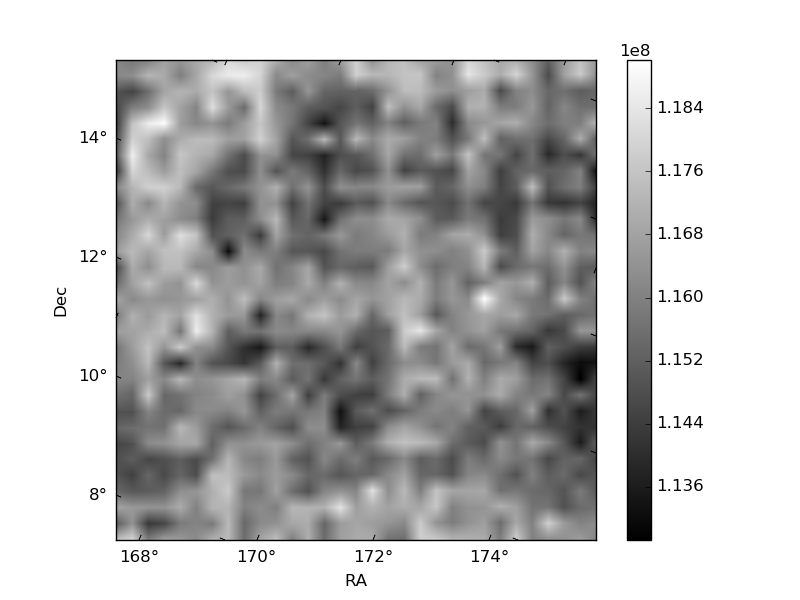
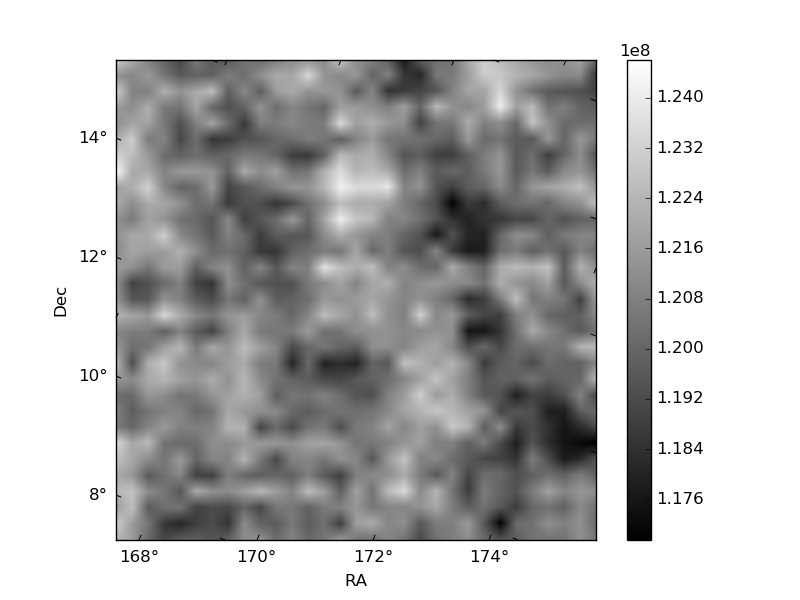
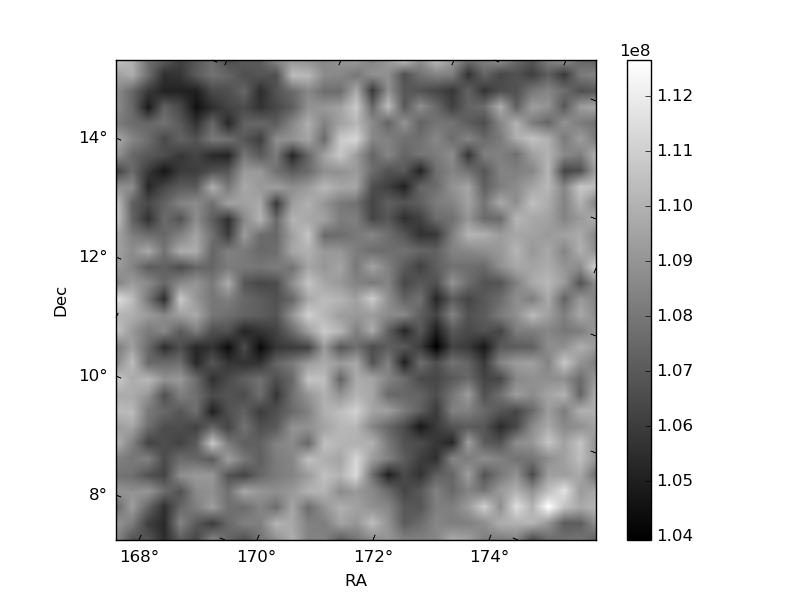
Histogram calculated using DETX and DETY for each event in the final _common_clean file
| Quadrant A | 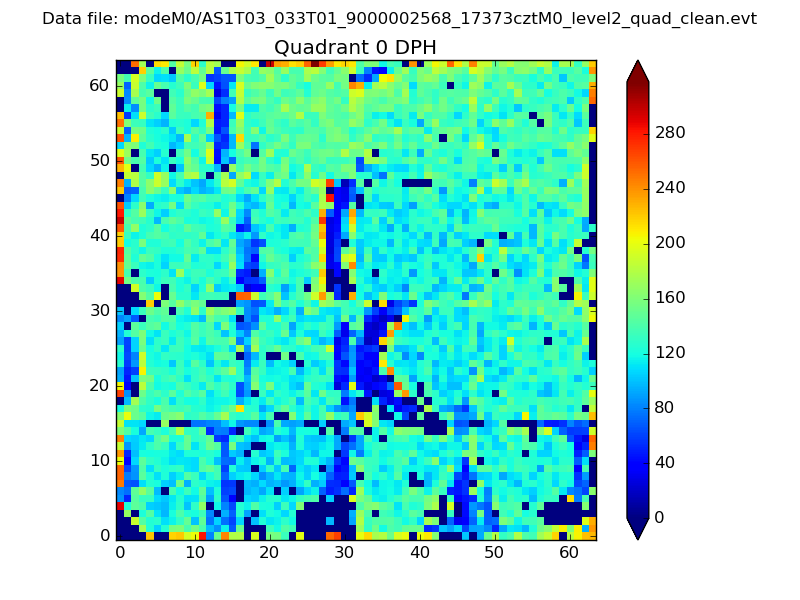 |
 |
Quadrant B |
|---|---|---|---|
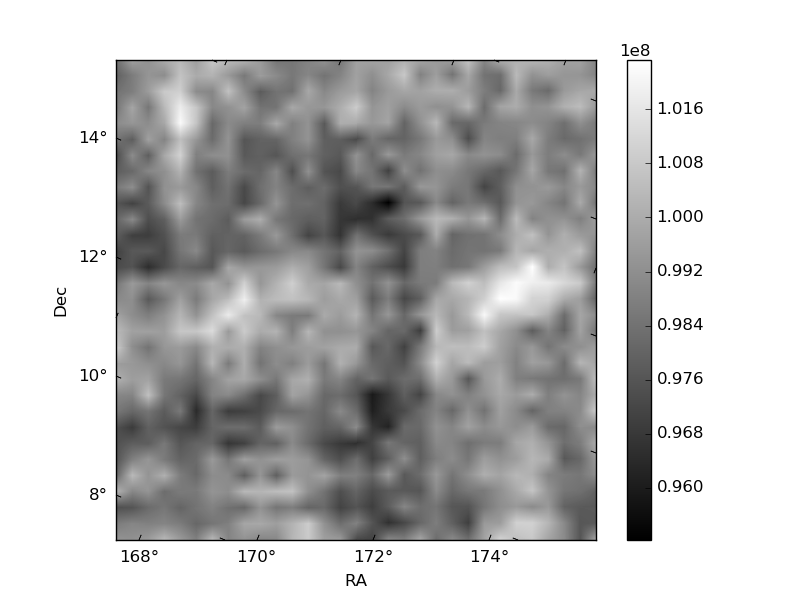
| Quadrant D | 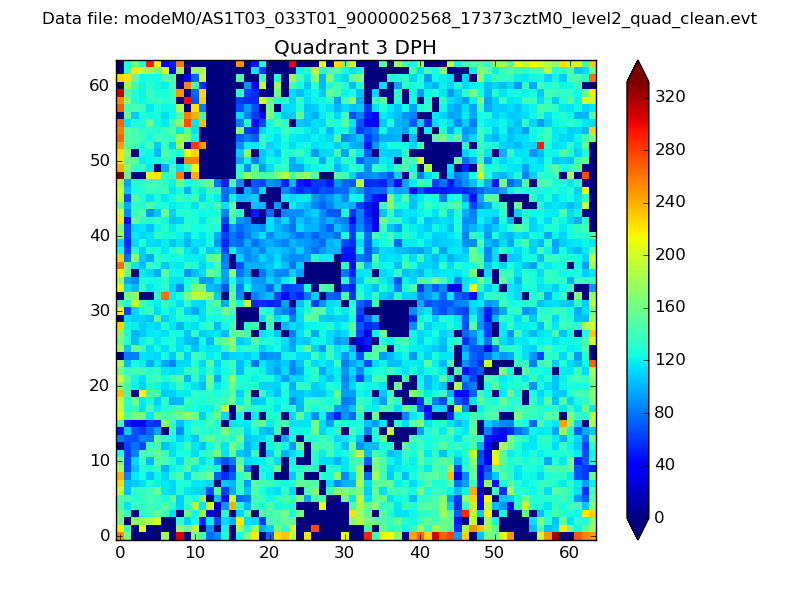 |
 |
Quadrant C |
| Plot type | Count rate plots | Images |
|---|---|---|
| Comparison with Poisson distribution Blue bars denote a histogram of data divided into 1 sec bins. Red curve is a Poisson curve with rate = median count rate of data. |
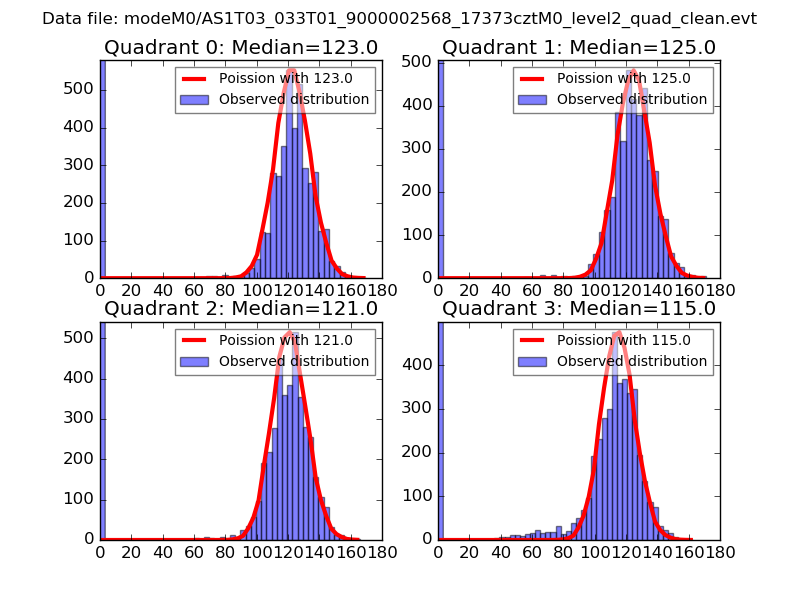 |
 |
| Quadrant-wise count rates Data is divided into 100 sec bins |
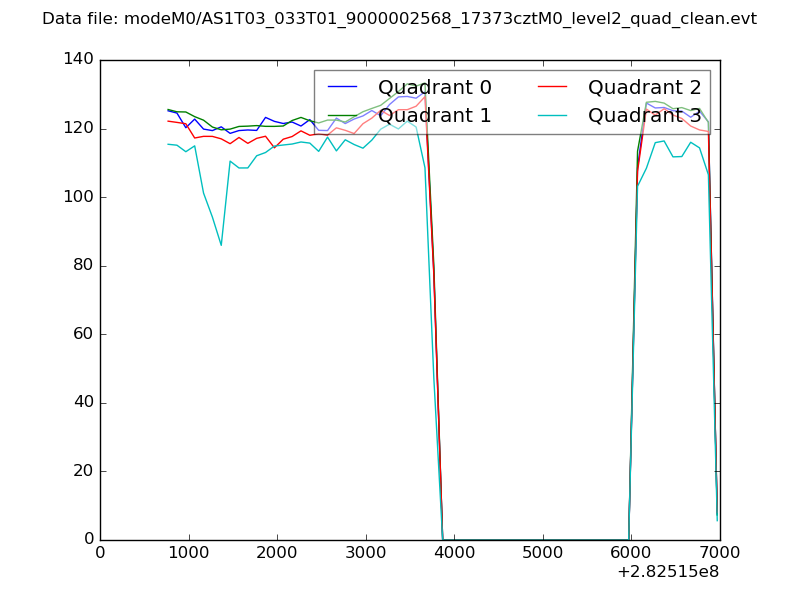 |
|
| Module-wise count rates for Quadrant A Data is divided into 100 sec bins |
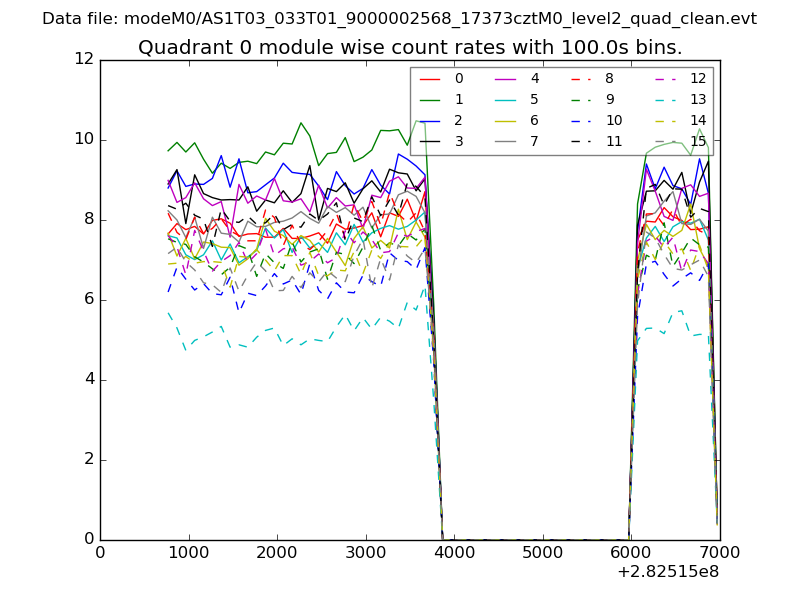 |
 |
| Module-wise count rates for Quadrant B Data is divided into 100 sec bins |
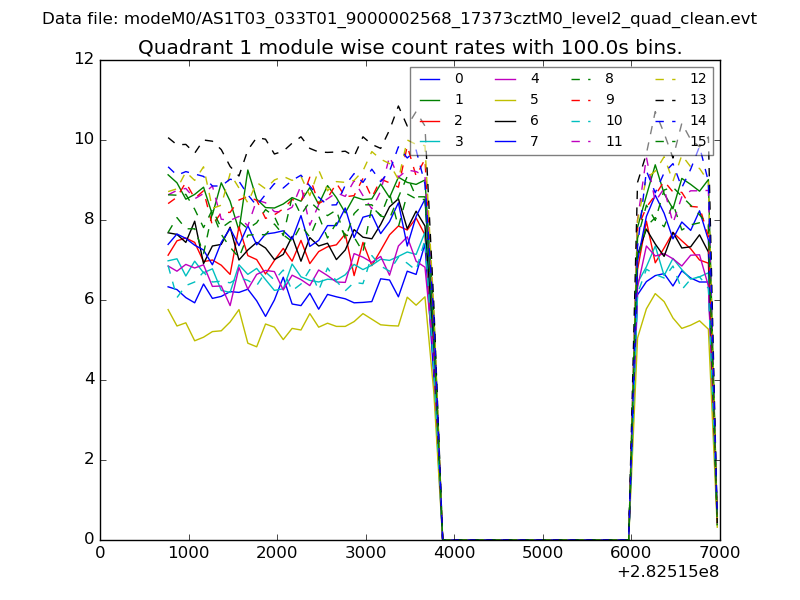 |
 |
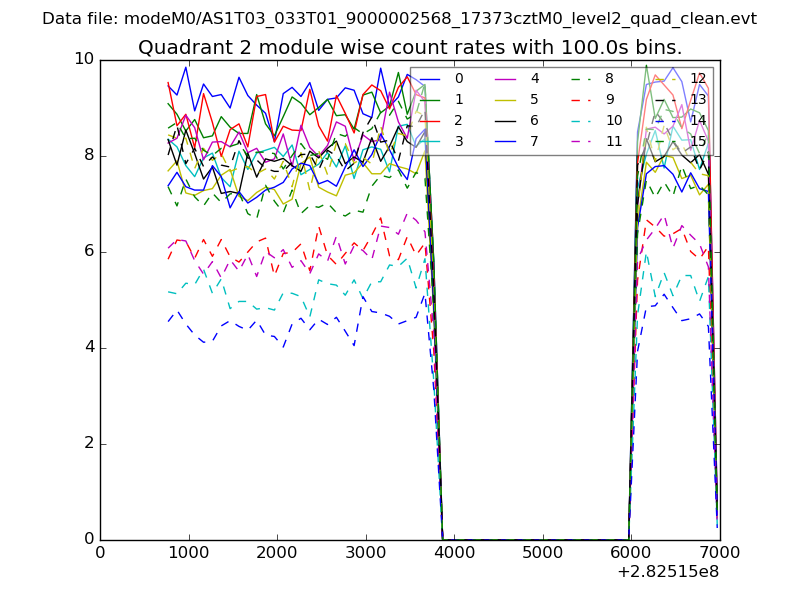
| Module-wise count rates for Quadrant C Data is divided into 100 sec bins |
 |
 |
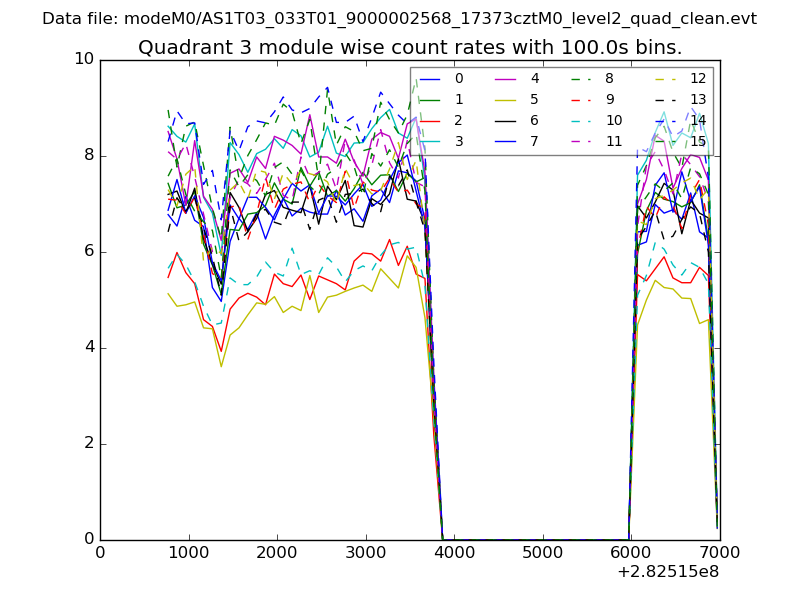
| Module-wise count rates for Quadrant D Data is divided into 100 sec bins |
 |
 |
| Parameter | Plot |
|---|---|
| CZT HV Monitor | 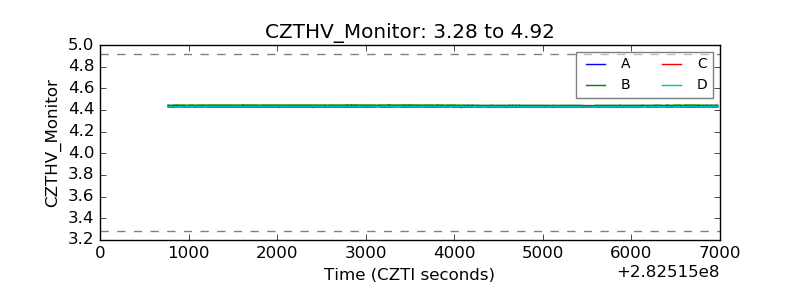 |
| D_VDD | 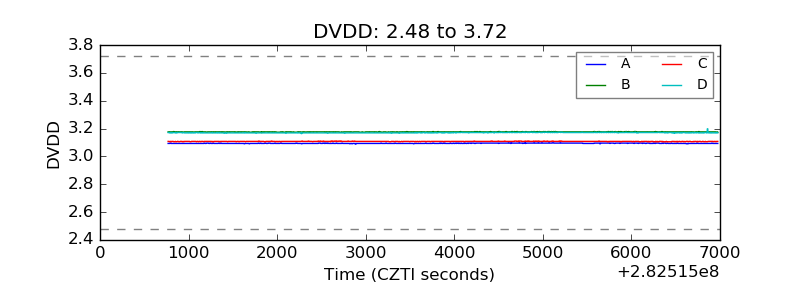 |
| Temperature 1 | 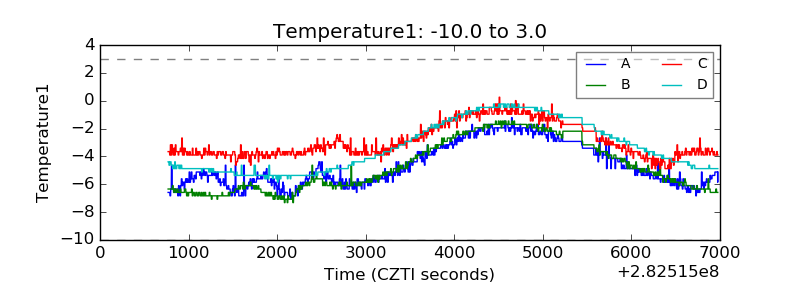 |
| Veto HV Monitor | 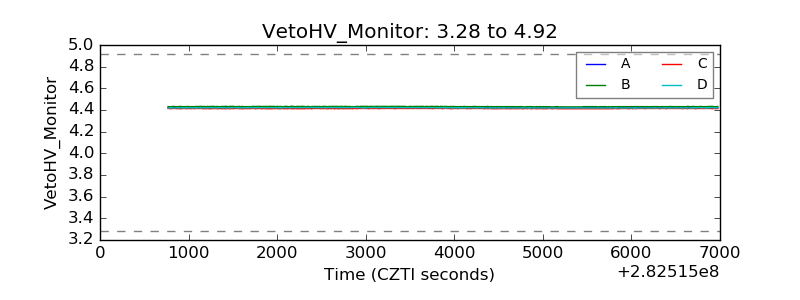 |
| Veto LLD | 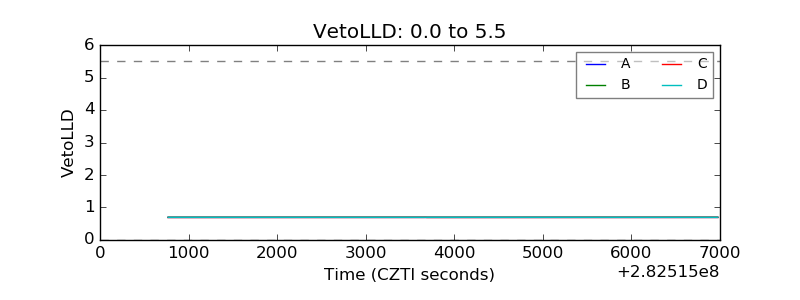 |
| Alpha Counter | 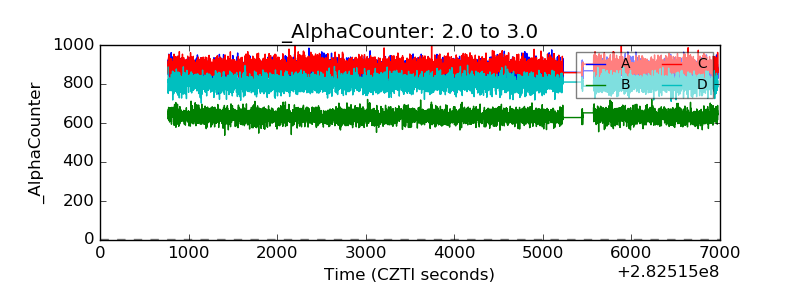 |
| _CPM_Rate | 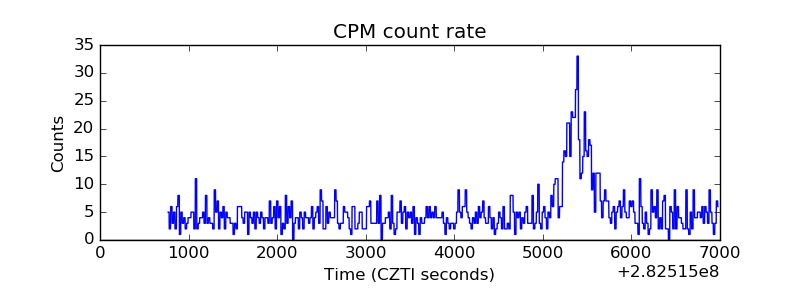 |
| CZT Counter |  |
| +2.5 Volts monitor |  |
| +5 Volts monitor |  |
| _ROLL_ROT | 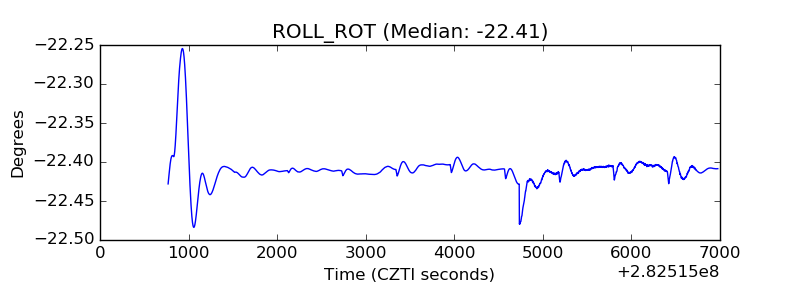 |
| _Roll_DEC | 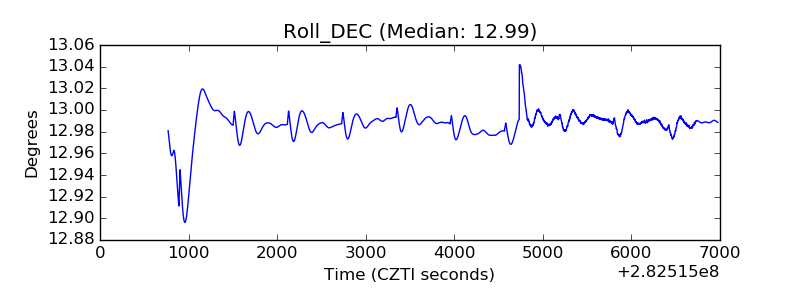 |
| _Roll_RA | 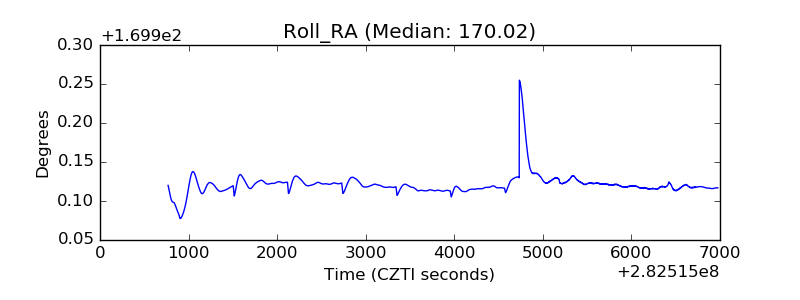 |
| Veto Counter | 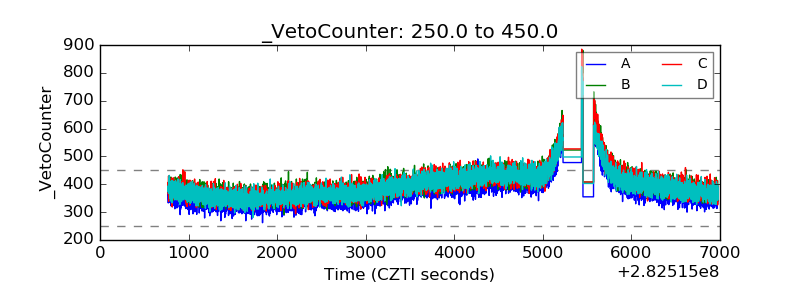 |