| Param | Original file | Final file |
|---|---|---|
| Filename | modeM0/AS1T03_033T01_9000002568_17374cztM0_level2.evt | modeM0/AS1T03_033T01_9000002568_17374cztM0_level2_quad_clean.evt |
| Size (bytes) | 696,784,320 | 96,356,160 |
| Size | 664.5 MB | 91.9 MB |
| Events in quadrant A | 3,811,357 | 614,749 |
| Events in quadrant B | 3,812,943 | 626,538 |
| Events in quadrant C | 3,766,094 | 601,926 |
| Events in quadrant D | 9,190,773 | 538,851 |
| Mode M0 | |||
|---|---|---|---|
| Quadrant | BADHDUFLAG | Total packets | Discarded packets |
| A | 0 | 16541 | 2 |
| B | 0 | 16448 | 2 |
| C | 0 | 16214 | 2 |
| D | 0 | 32691 | 2 |
| Mode M9 | |||
|---|---|---|---|
| Quadrant | BADHDUFLAG | Total packets | Discarded packets |
| A | 0 | 5 | 0 |
| B | 0 | 5 | 0 |
| C | 0 | 5 | 0 |
| D | 0 | 5 | 0 |
| Mode SS | |||
|---|---|---|---|
| Quadrant | BADHDUFLAG | Total packets | Discarded packets |
| A | 0 | 160 | 0 |
| B | 0 | 160 | 0 |
| C | 0 | 160 | 0 |
| D | 0 | 160 | 0 |
| Quadrant | Total seconds | Saturated seconds | Saturation percentage |
|---|---|---|---|
| A | 7699 | 85 | 1.104039% |
| B | 7699 | 177 | 2.299000% |
| C | 7699 | 185 | 2.402909% |
| D | 7699 | 1499 | 19.470061% |
Noise dominated data is calculated using 1-second bins in cleaned event files. If a bin has >2000 counts, and if more than 50% of those come from <1% of pixels, then it is considered to be noise-dominated and hence unusable.
| Quadrant | # 1 sec bins | Bins with >0 counts | Bins with >2000 counts | High rate bins dominated by noise | Noise dominated (total time) | Noise dominated (detector-on time) | Marked lightcurve |
|---|---|---|---|---|---|---|---|
| A | 8214 | 7702 | 0 | 0 | 0.00% | 0.00% | 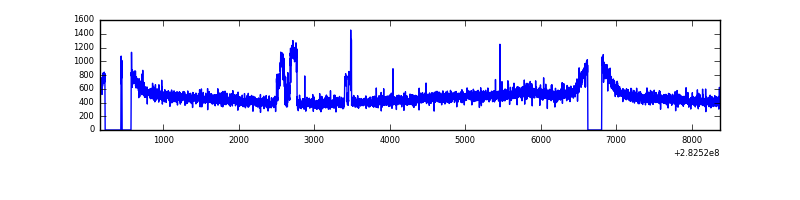 |
| B | 8214 | 7702 | 3 | 3 | 0.04% | 0.04% | 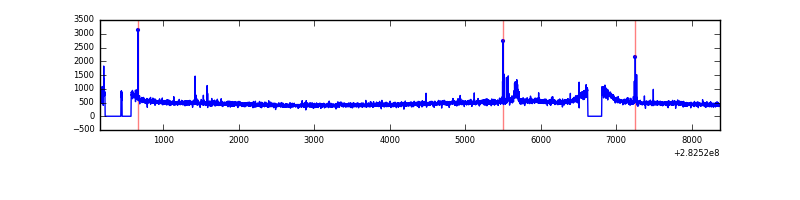 |
| C | 8214 | 7702 | 0 | 0 | 0.00% | 0.00% | 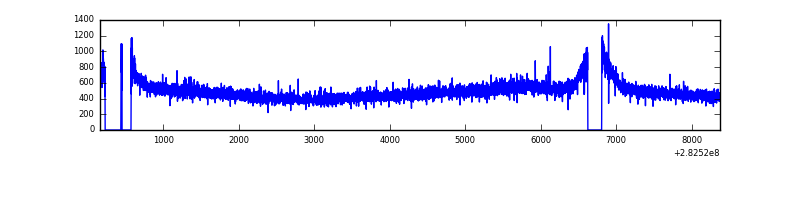 |
| D | 8214 | 7702 | 1276 | 1276 | 15.53% | 16.57% | 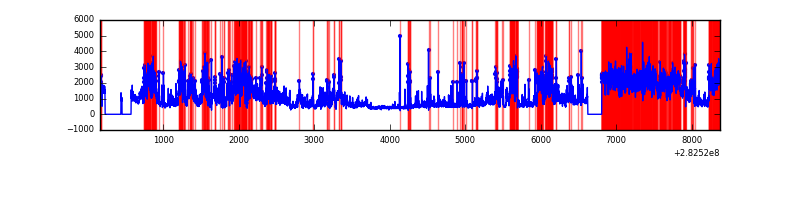 |
Top three noisy pixels from each quadrant. If the there are fewer than three noisy pixels in the level2.evt file, extra rows are filled as -1
| Pixel properties | Quadrant properties | ||||||
|---|---|---|---|---|---|---|---|
| Quadrant | DetID | PixID | Counts | Sigma | Mean | Median | Sigma |
| A | 0 | 23 | 150041 | 767.86 | 950 | 929 | 194.2 |
| A | 0 | 226 | 16904 | 82.26 | 950 | 929 | 194.2 |
| A | 3 | 137 | 7137 | 31.97 | 950 | 929 | 194.2 |
| B | 4 | 216 | 49221 | 263.17 | 951 | 927 | 183.5 |
| B | 12 | 111 | 22047 | 115.09 | 951 | 927 | 183.5 |
| B | 11 | 111 | 19120 | 99.14 | 951 | 927 | 183.5 |
| C | 14 | 238 | 140558 | 645.72 | 912 | 920 | 216.3 |
| C | 3 | 233 | 63771 | 290.64 | 912 | 920 | 216.3 |
| C | 13 | 61 | 6552 | 26.04 | 912 | 920 | 216.3 |
| D | 11 | 176 | 4056546 | 19338.0 | 856 | 831 | 209.7 |
| D | 1 | 20 | 733784 | 3494.78 | 856 | 831 | 209.7 |
| D | 13 | 232 | 572891 | 2727.63 | 856 | 831 | 209.7 |
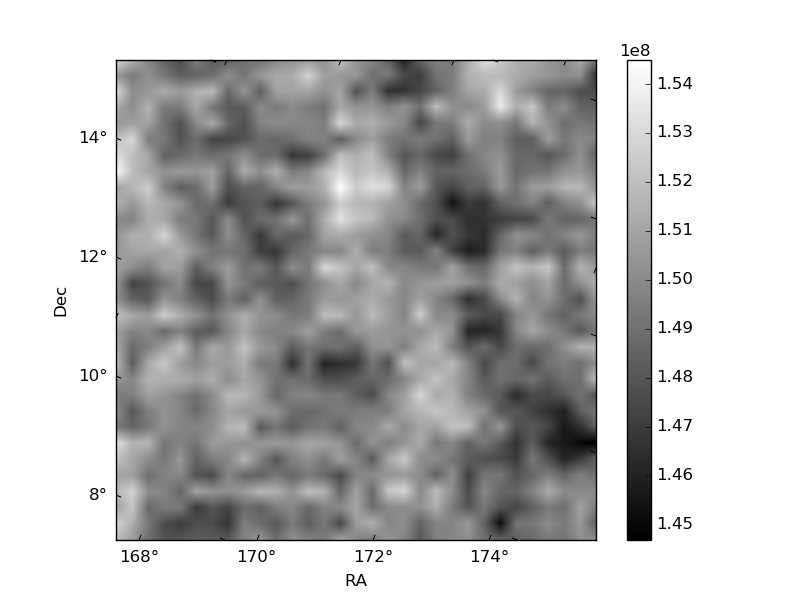
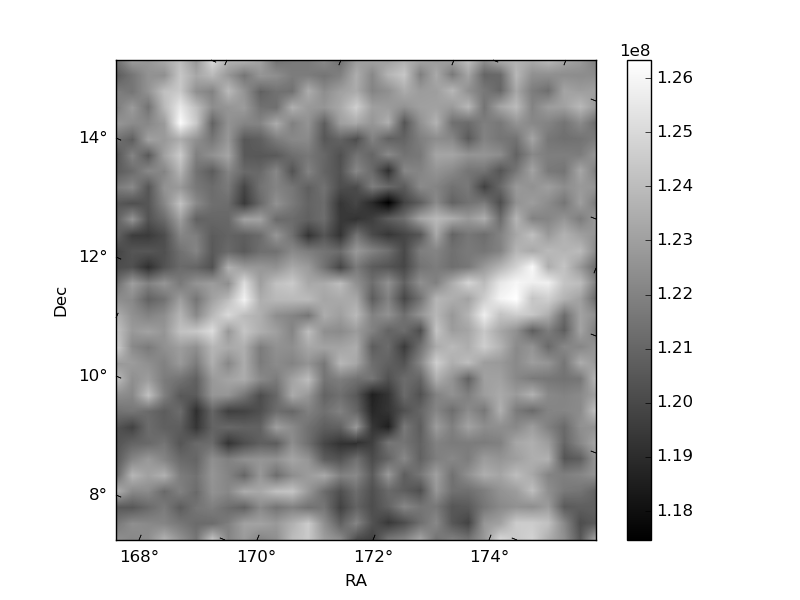
Histogram calculated using DETX and DETY for each event in the final _common_clean file
| Quadrant A | 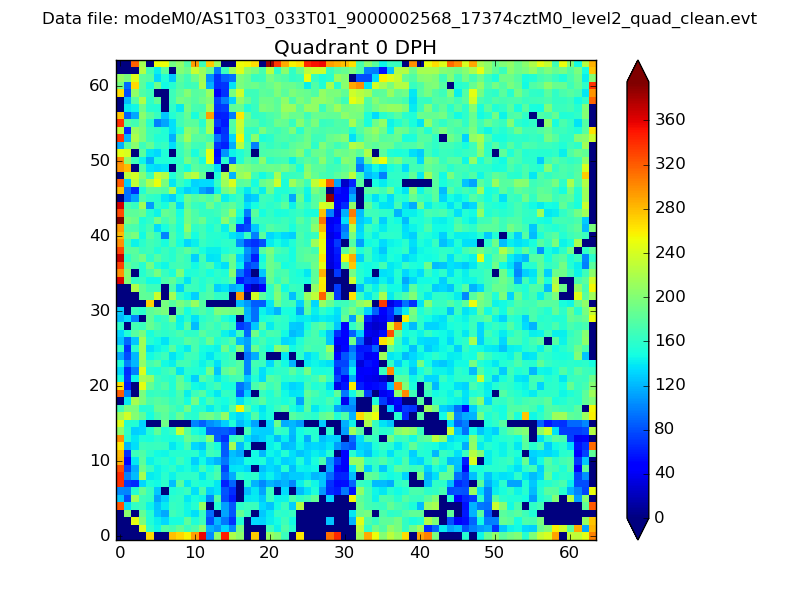 |
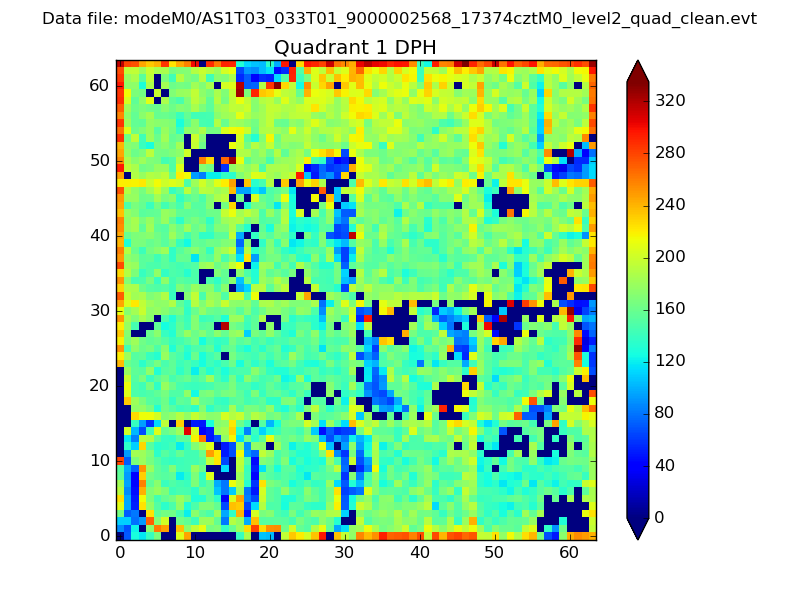 |
Quadrant B |
|---|---|---|---|
| Quadrant D | 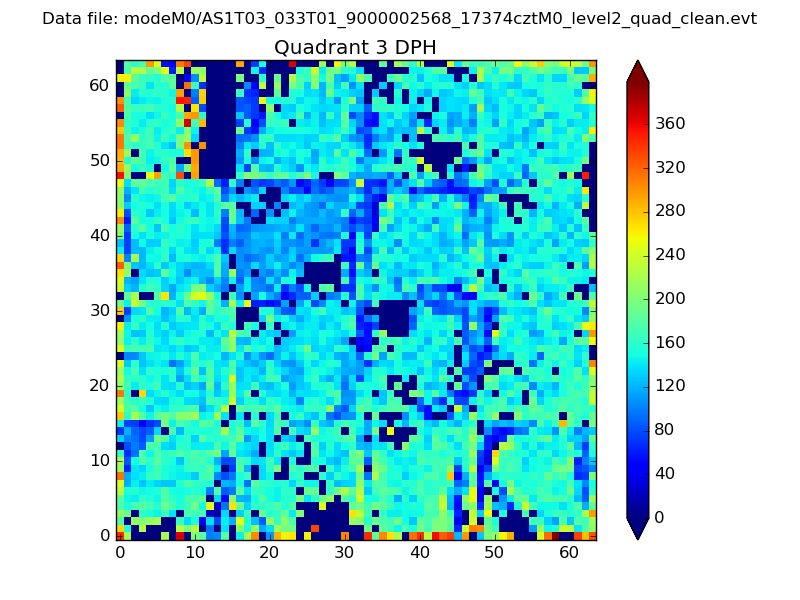 |
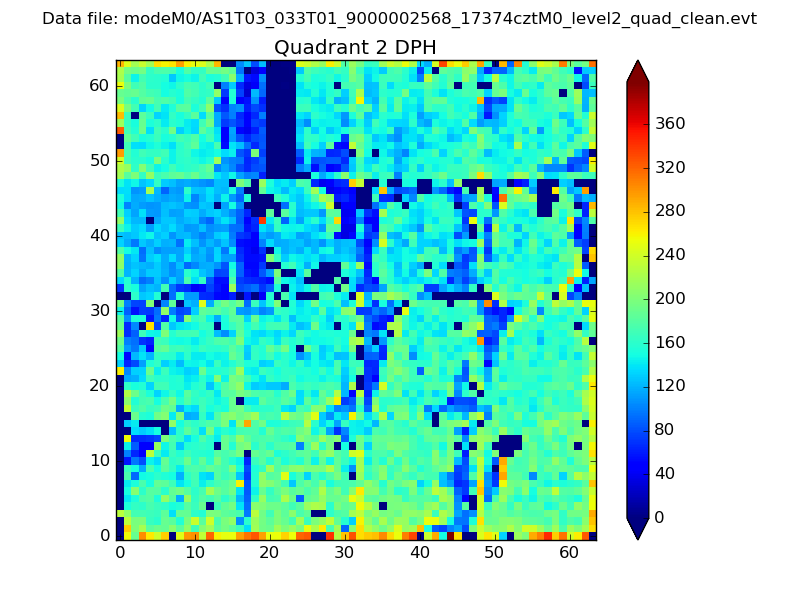 |
Quadrant C |
| Plot type | Count rate plots | Images |
|---|---|---|
| Comparison with Poisson distribution Blue bars denote a histogram of data divided into 1 sec bins. Red curve is a Poisson curve with rate = median count rate of data. |
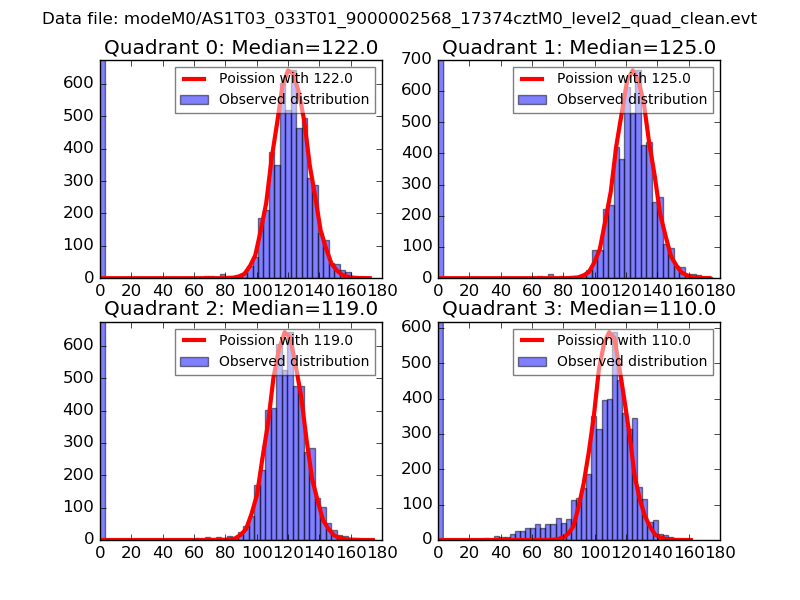 |
 |
| Quadrant-wise count rates Data is divided into 100 sec bins |
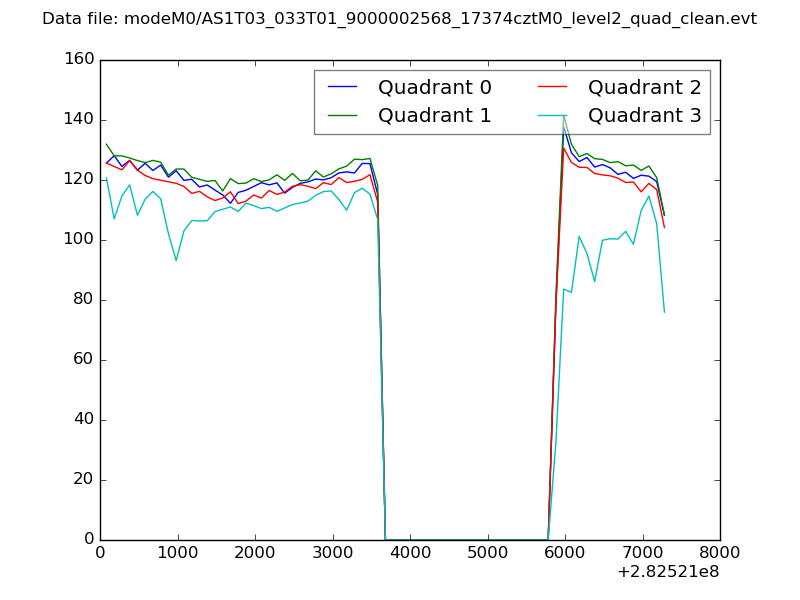 |
|
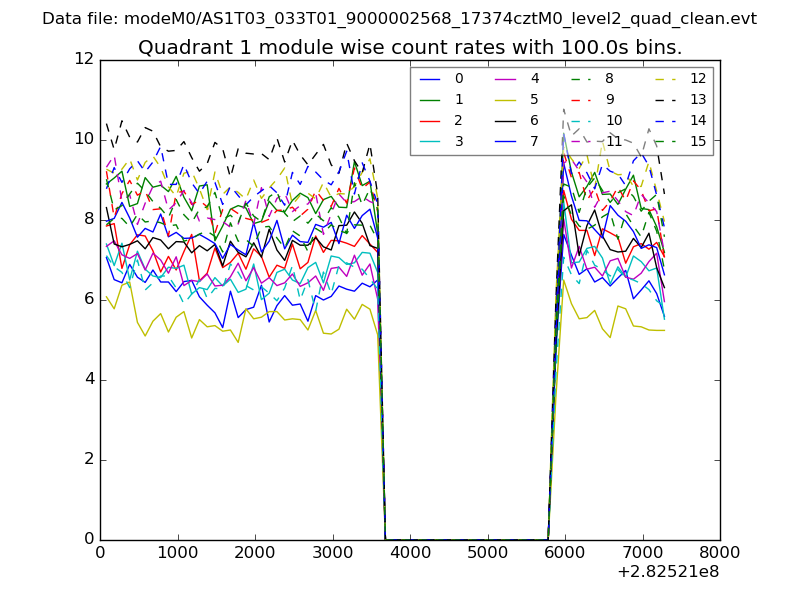
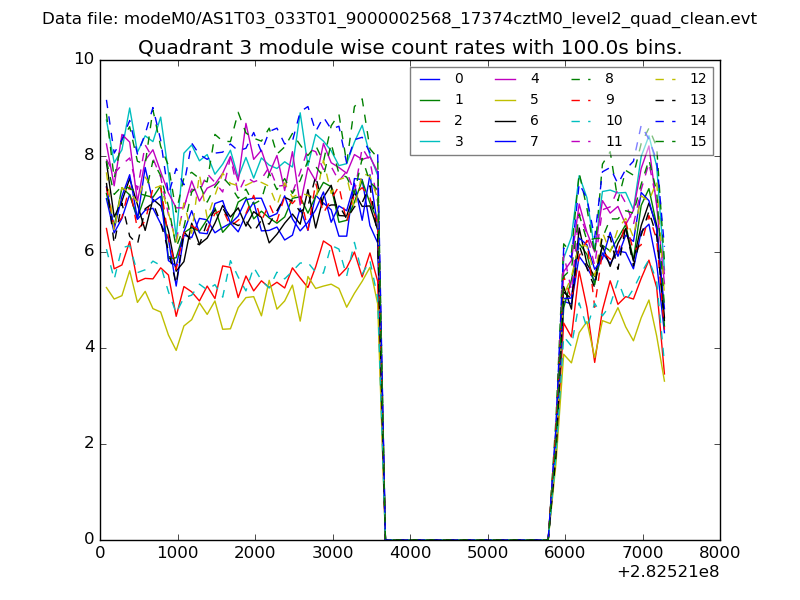
| Module-wise count rates for Quadrant A Data is divided into 100 sec bins |
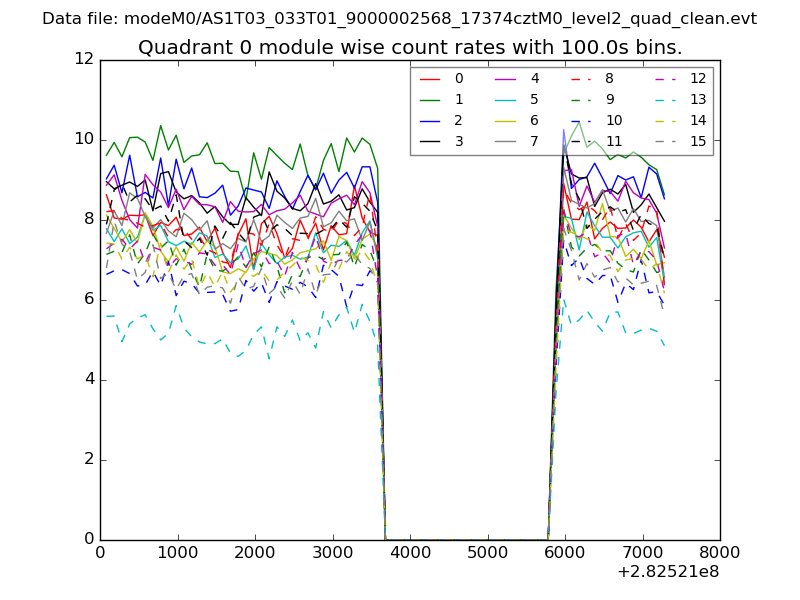 |
 |
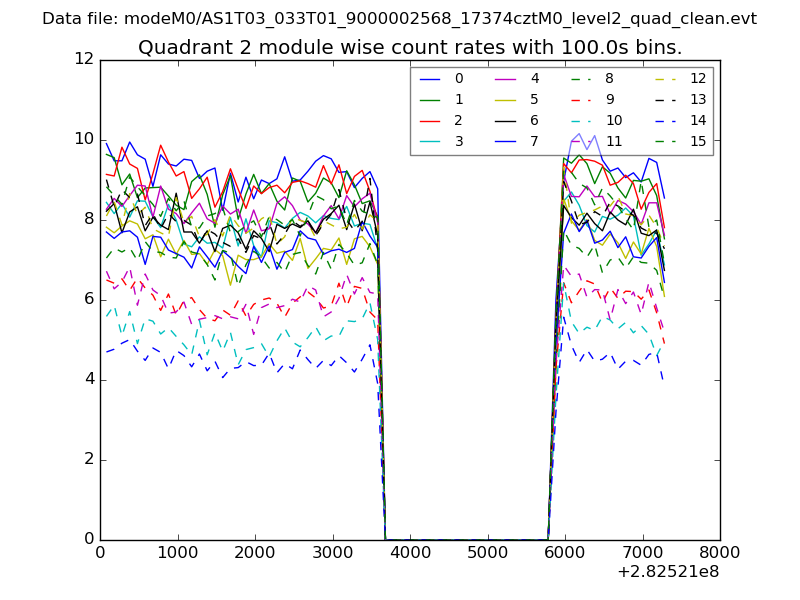
| Module-wise count rates for Quadrant B Data is divided into 100 sec bins |
 |
 |
| Module-wise count rates for Quadrant C Data is divided into 100 sec bins |
 |
 |
| Module-wise count rates for Quadrant D Data is divided into 100 sec bins |
 |
 |
| Parameter | Plot |
|---|---|
| CZT HV Monitor | 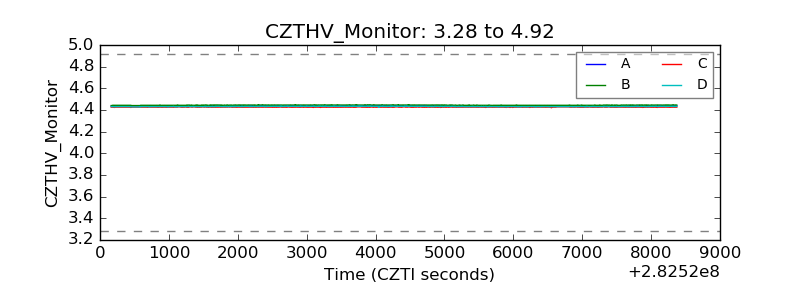 |
| D_VDD | 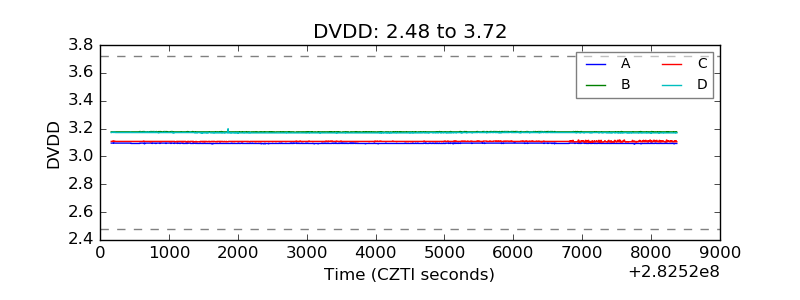 |
| Temperature 1 | 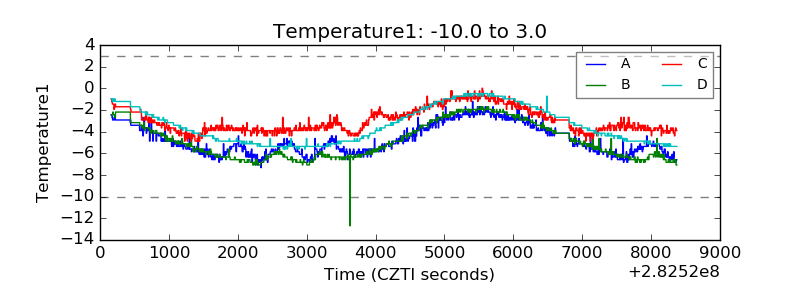 |
| Veto HV Monitor | 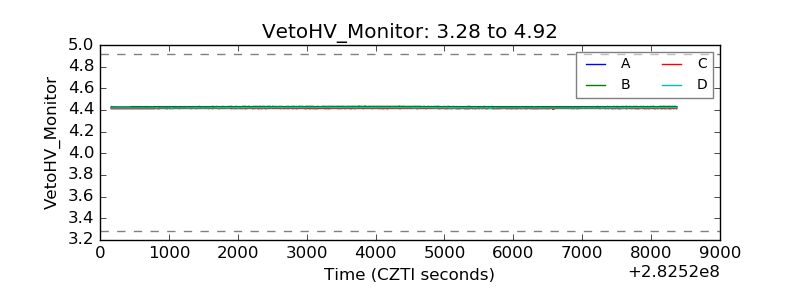 |
| Veto LLD | 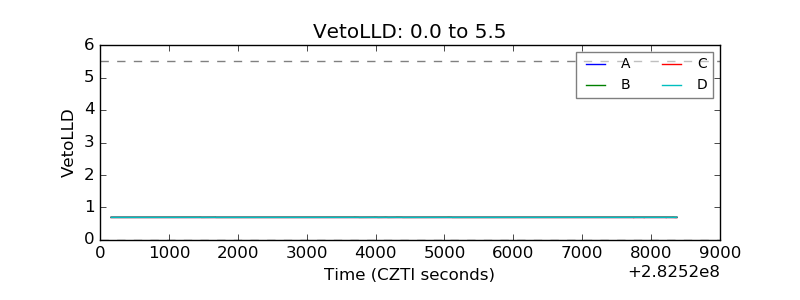 |
| Alpha Counter | 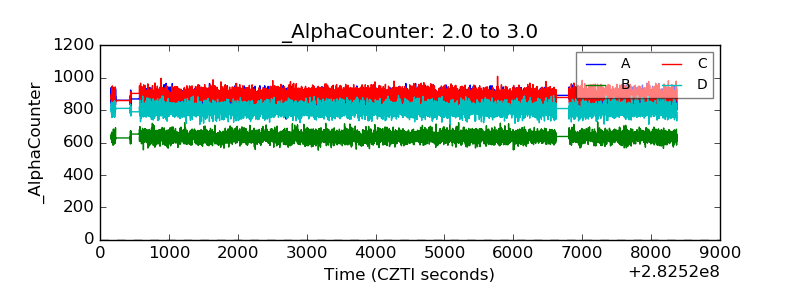 |
| _CPM_Rate | 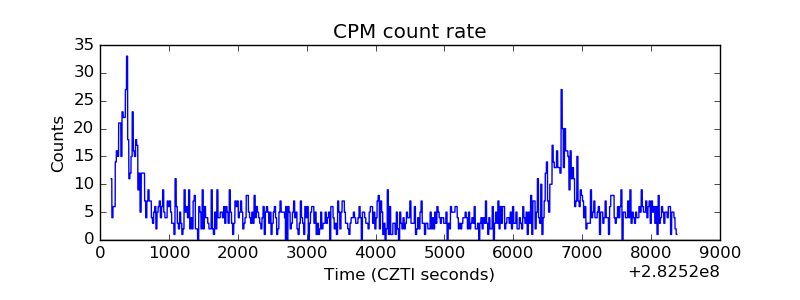 |
| CZT Counter | 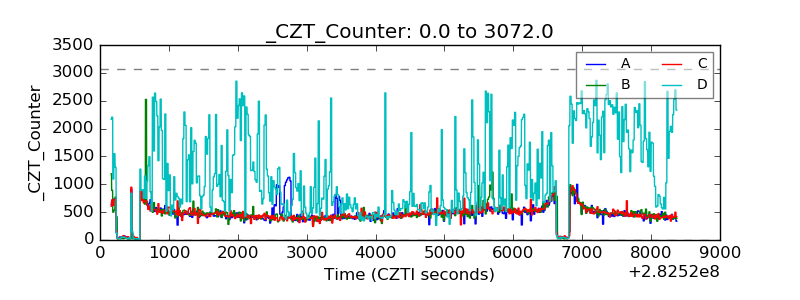 |
| +2.5 Volts monitor |  |
| +5 Volts monitor |  |
| _ROLL_ROT | 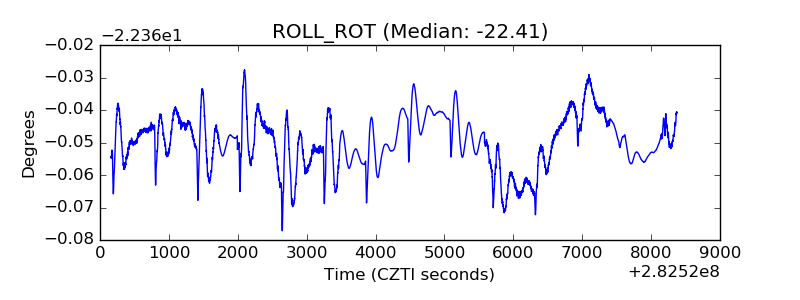 |
| _Roll_DEC | 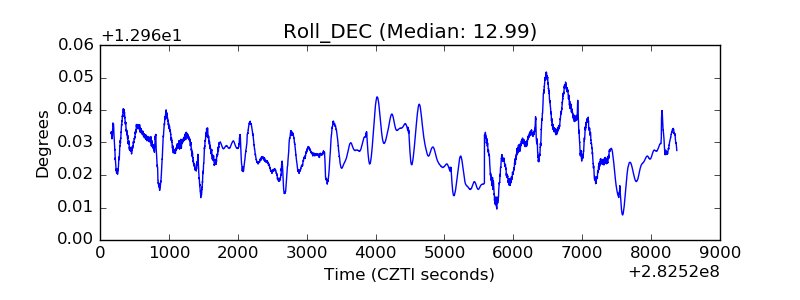 |
| _Roll_RA | 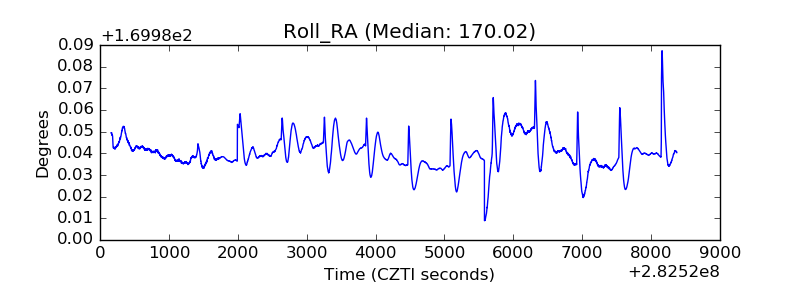 |
| Veto Counter | 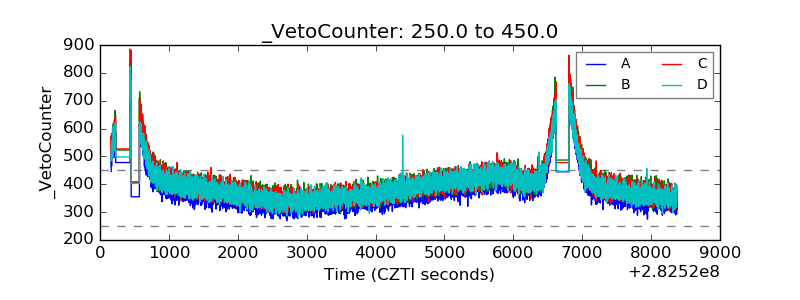 |