| Param | Original file | Final file |
|---|---|---|
| Filename | modeM0/AS1T03_033T01_9000002568_17377cztM0_level2.evt | modeM0/AS1T03_033T01_9000002568_17377cztM0_level2_quad_clean.evt |
| Size (bytes) | 1,664,962,560 | 231,696,000 |
| Size | 1.6 GB | 221.0 MB |
| Events in quadrant A | 9,090,534 | 1,455,775 |
| Events in quadrant B | 9,344,612 | 1,481,065 |
| Events in quadrant C | 9,337,228 | 1,420,861 |
| Events in quadrant D | 21,336,080 | 1,316,068 |
| Mode M0 | |||
|---|---|---|---|
| Quadrant | BADHDUFLAG | Total packets | Discarded packets |
| A | 0 | 40381 | 4 |
| B | 0 | 40880 | 4 |
| C | 0 | 40480 | 4 |
| D | 0 | 77296 | 4 |
| Mode M9 | |||
|---|---|---|---|
| Quadrant | BADHDUFLAG | Total packets | Discarded packets |
| A | 0 | 19 | 0 |
| B | 0 | 19 | 0 |
| C | 0 | 19 | 0 |
| D | 0 | 19 | 0 |
| Mode SS | |||
|---|---|---|---|
| Quadrant | BADHDUFLAG | Total packets | Discarded packets |
| A | 0 | 396 | 0 |
| B | 0 | 396 | 0 |
| C | 0 | 396 | 0 |
| D | 0 | 396 | 0 |
| Quadrant | Total seconds | Saturated seconds | Saturation percentage |
|---|---|---|---|
| A | 19502 | 178 | 0.912727% |
| B | 19503 | 295 | 1.512588% |
| C | 19503 | 318 | 1.630518% |
| D | 19503 | 3360 | 17.228119% |
Noise dominated data is calculated using 1-second bins in cleaned event files. If a bin has >2000 counts, and if more than 50% of those come from <1% of pixels, then it is considered to be noise-dominated and hence unusable.
| Quadrant | # 1 sec bins | Bins with >0 counts | Bins with >2000 counts | High rate bins dominated by noise | Noise dominated (total time) | Noise dominated (detector-on time) | Marked lightcurve |
|---|---|---|---|---|---|---|---|
| A | 21332 | 19505 | 1 | 1 | 0.00% | 0.01% | 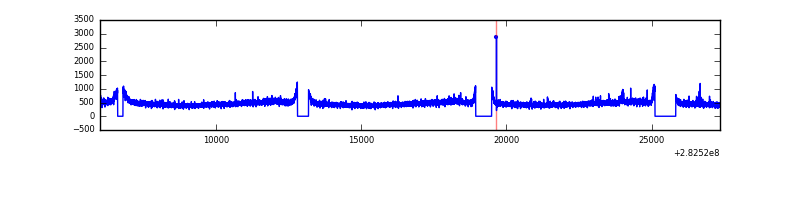 |
| B | 21333 | 19506 | 8 | 8 | 0.04% | 0.04% | 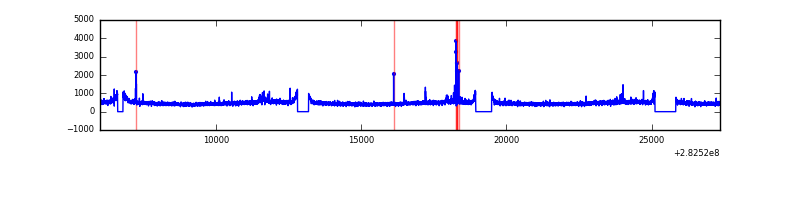 |
| C | 21333 | 19506 | 0 | 0 | 0.00% | 0.00% | 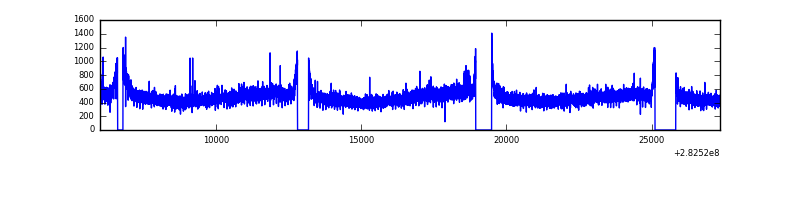 |
| D | 21333 | 19507 | 3021 | 3021 | 14.16% | 15.49% |  |
Top three noisy pixels from each quadrant. If the there are fewer than three noisy pixels in the level2.evt file, extra rows are filled as -1
| Pixel properties | Quadrant properties | ||||||
|---|---|---|---|---|---|---|---|
| Quadrant | DetID | PixID | Counts | Sigma | Mean | Median | Sigma |
| A | 13 | 210 | 32883 | 64.17 | 2352 | 2296 | 476.7 |
| A | 0 | 226 | 20615 | 38.43 | 2352 | 2296 | 476.7 |
| A | 3 | 137 | 18115 | 33.19 | 2352 | 2296 | 476.7 |
| B | 4 | 216 | 79094 | 168.56 | 2352 | 2291 | 455.6 |
| B | 12 | 111 | 56227 | 118.38 | 2352 | 2291 | 455.6 |
| B | 11 | 111 | 47942 | 100.19 | 2352 | 2291 | 455.6 |
| C | 14 | 238 | 345479 | 648.22 | 2252 | 2263 | 529.5 |
| C | 3 | 233 | 196627 | 367.09 | 2252 | 2263 | 529.5 |
| C | 13 | 61 | 16056 | 26.05 | 2252 | 2263 | 529.5 |
| D | 11 | 176 | 9465967 | 18078.53 | 2128 | 2067 | 523.5 |
| D | 13 | 232 | 1297173 | 2473.99 | 2128 | 2067 | 523.5 |
| D | 1 | 52 | 934176 | 1780.57 | 2128 | 2067 | 523.5 |
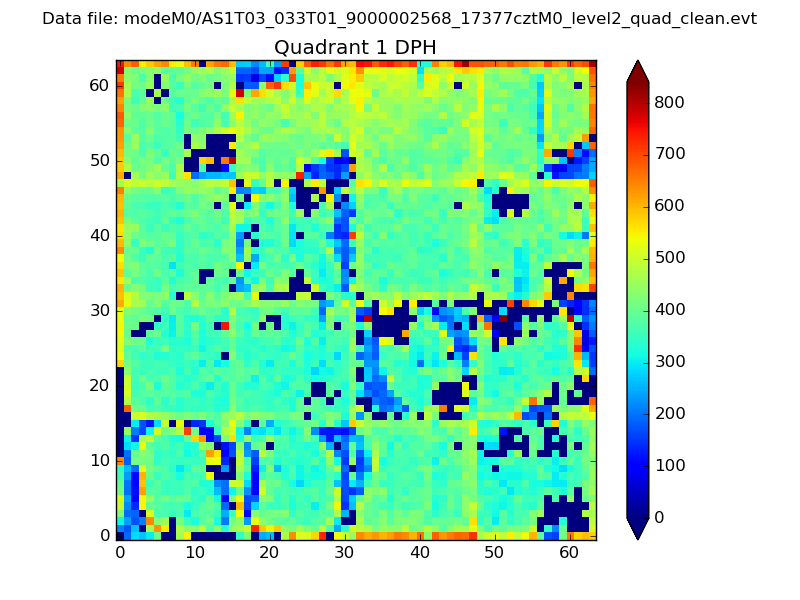
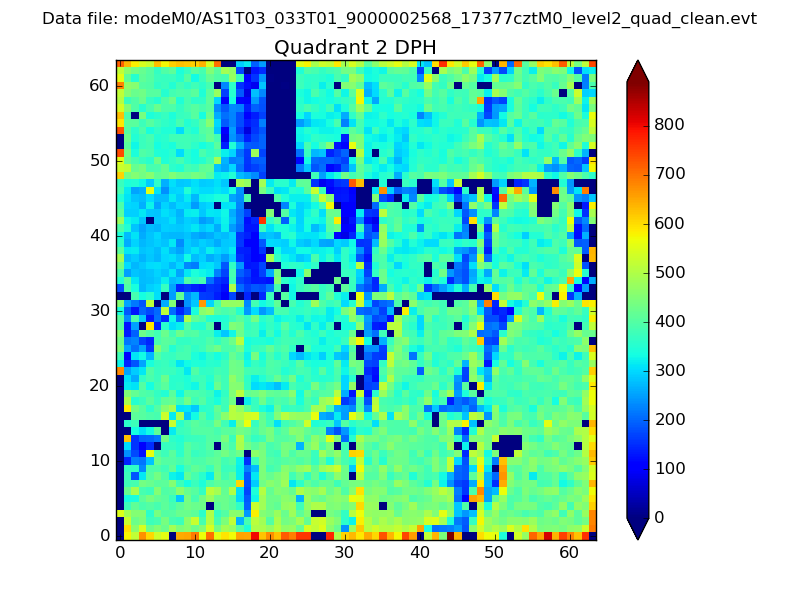
Histogram calculated using DETX and DETY for each event in the final _common_clean file
| Quadrant A | 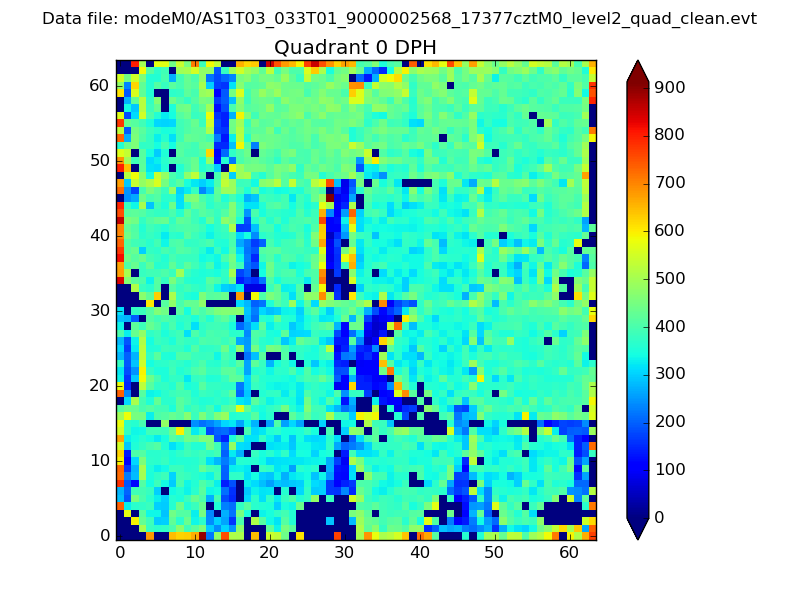 |
 |
Quadrant B |
|---|---|---|---|
| Quadrant D | 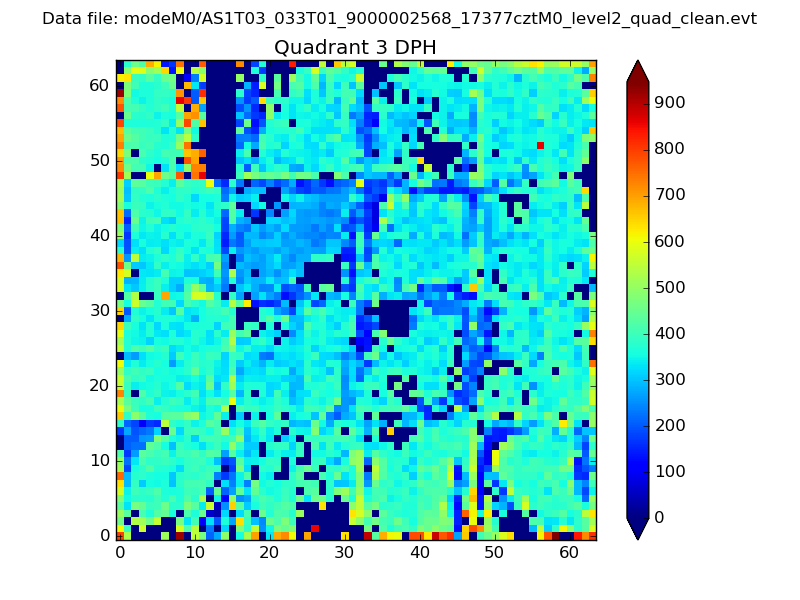 |
 |
Quadrant C |
| Plot type | Count rate plots | Images |
|---|---|---|
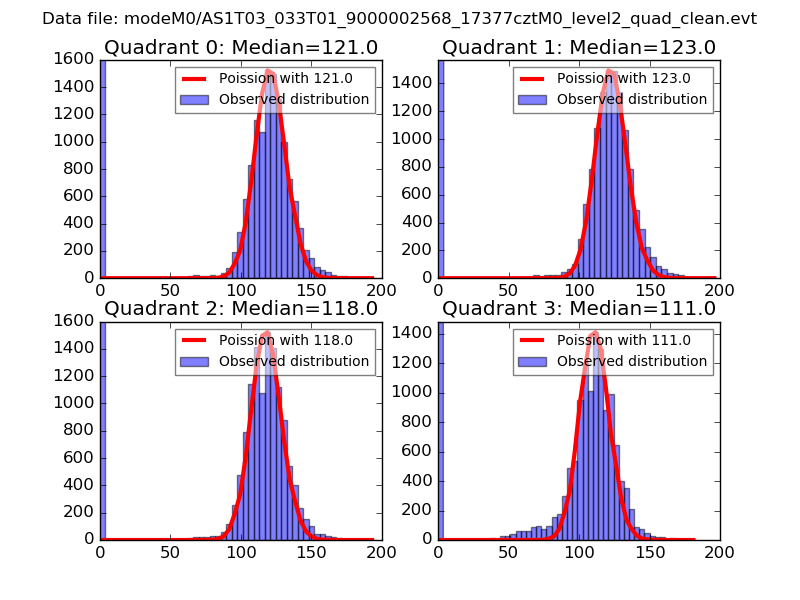
| Comparison with Poisson distribution Blue bars denote a histogram of data divided into 1 sec bins. Red curve is a Poisson curve with rate = median count rate of data. |
 |
 |
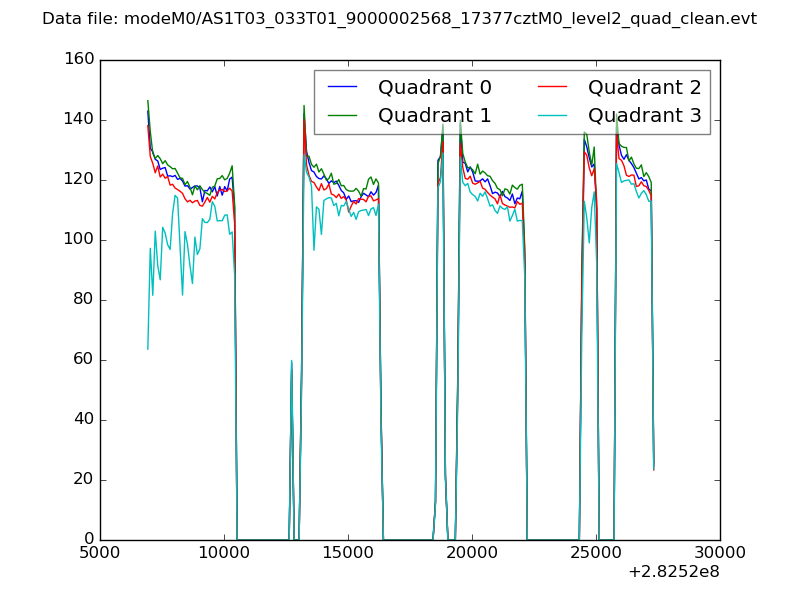
| Quadrant-wise count rates Data is divided into 100 sec bins |
 |
|
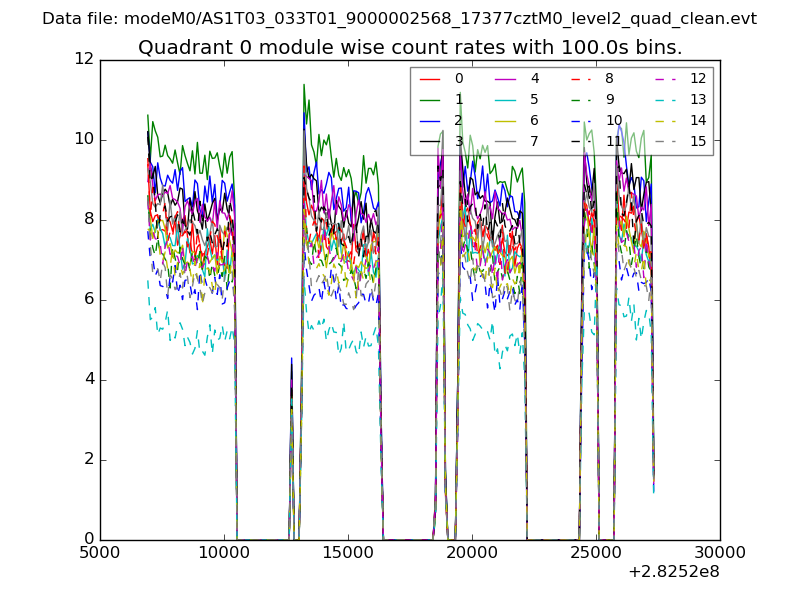
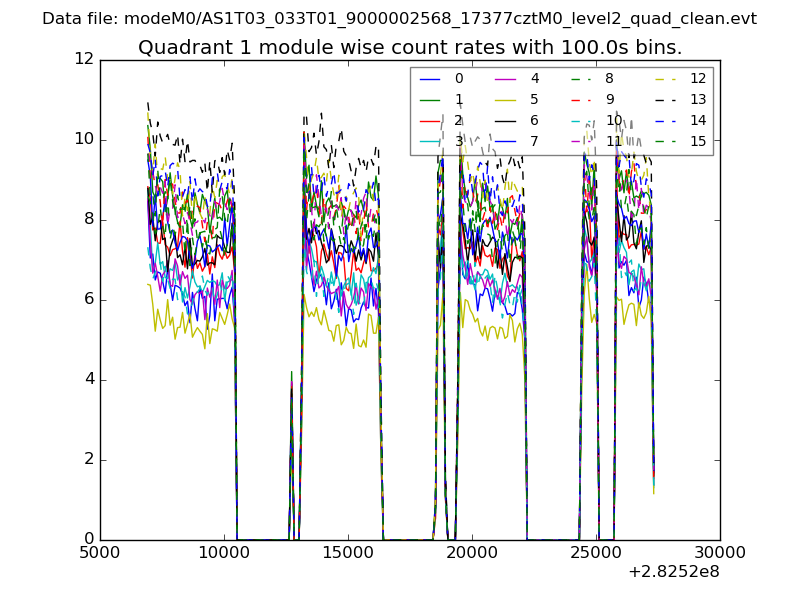
| Module-wise count rates for Quadrant A Data is divided into 100 sec bins |
 |
 |
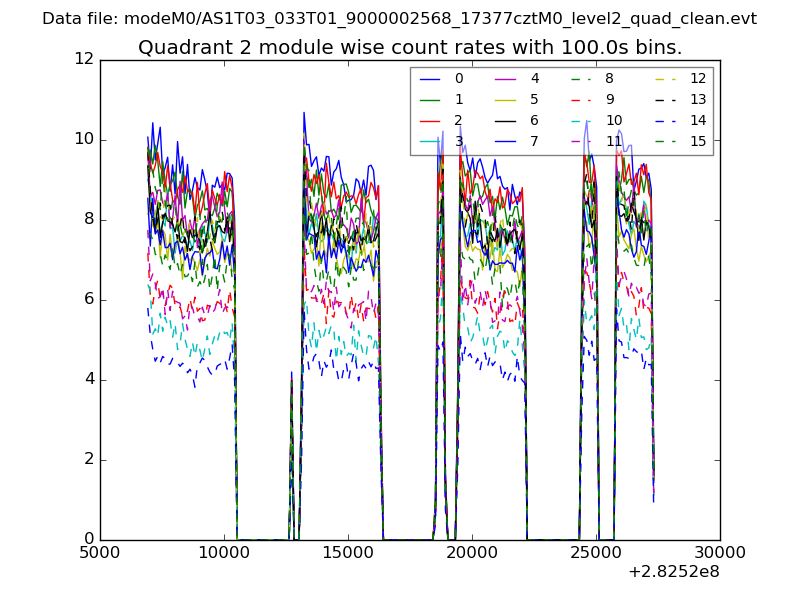
| Module-wise count rates for Quadrant B Data is divided into 100 sec bins |
 |
 |
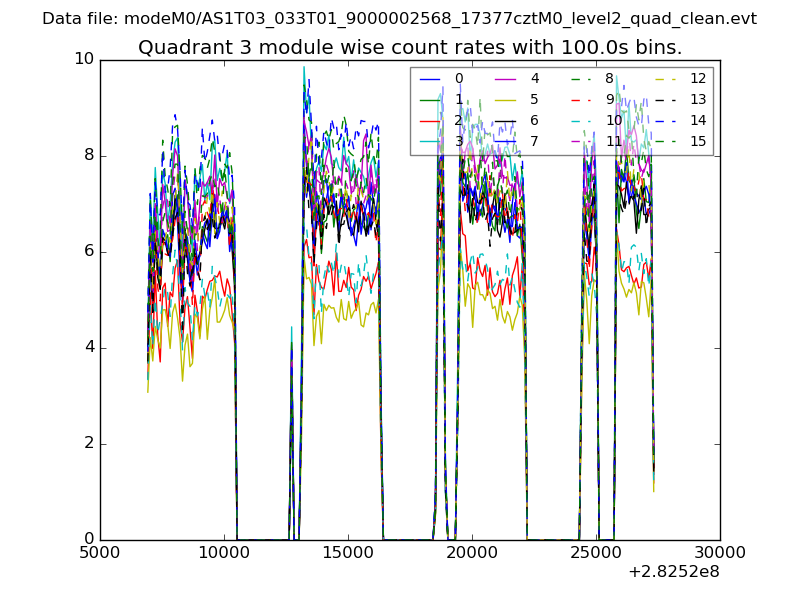
| Module-wise count rates for Quadrant C Data is divided into 100 sec bins |
 |
 |
| Module-wise count rates for Quadrant D Data is divided into 100 sec bins |
 |
 |
| Parameter | Plot |
|---|---|
| CZT HV Monitor | 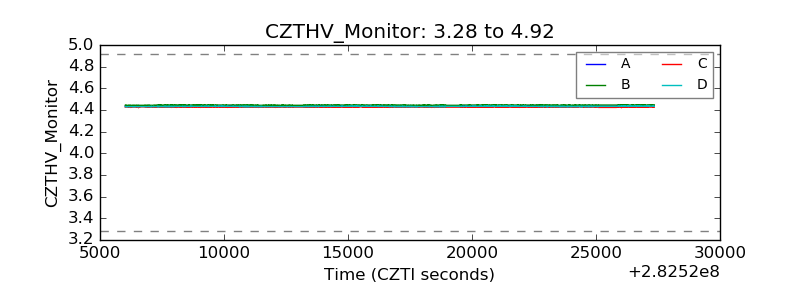 |
| D_VDD | 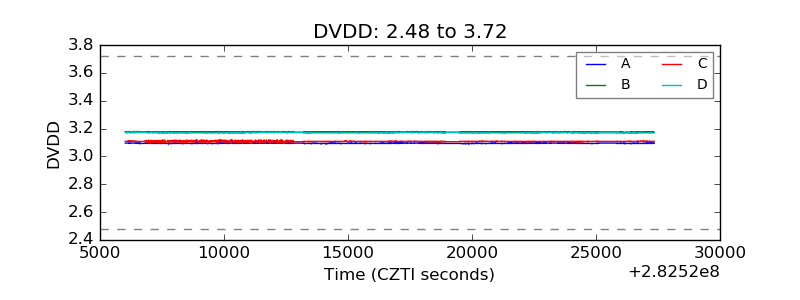 |
| Temperature 1 | 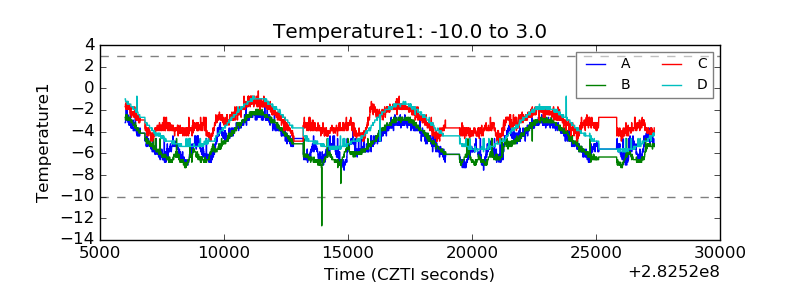 |
| Veto HV Monitor | 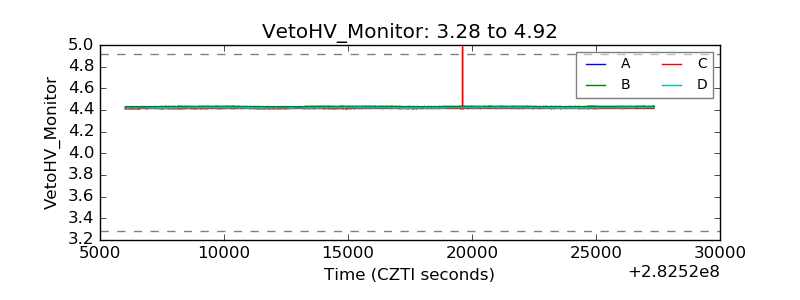 |
| Veto LLD |  |
| Alpha Counter | 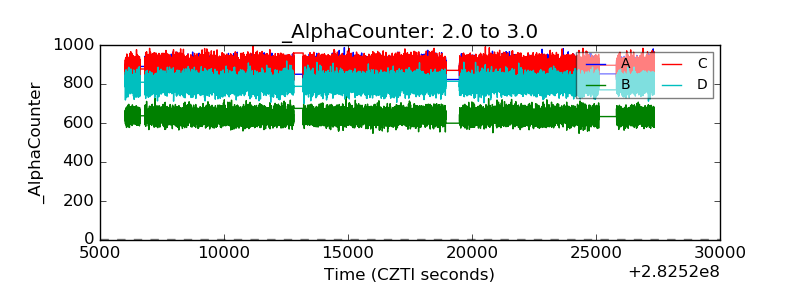 |
| _CPM_Rate | 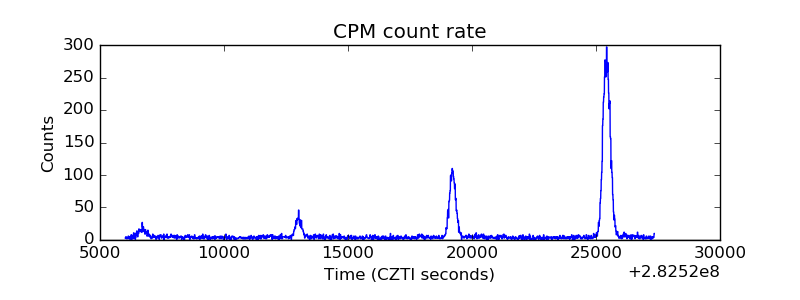 |
| CZT Counter | 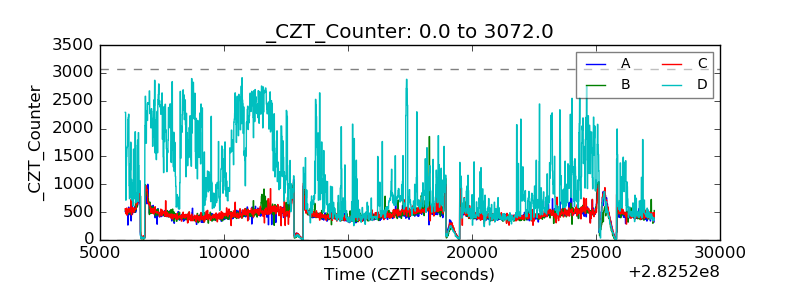 |
| +2.5 Volts monitor |  |
| +5 Volts monitor |  |
| _ROLL_ROT | 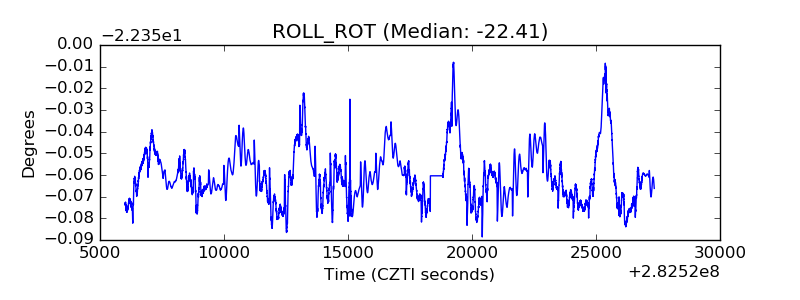 |
| _Roll_DEC | 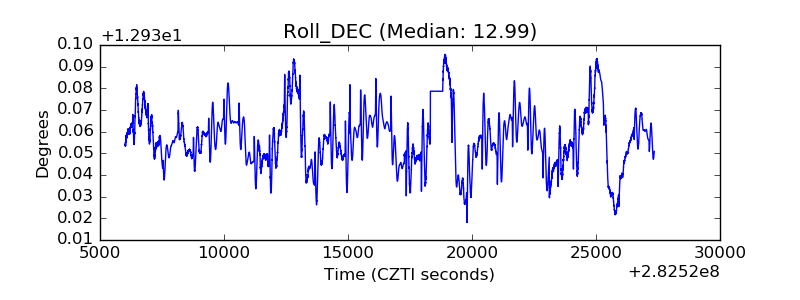 |
| _Roll_RA | 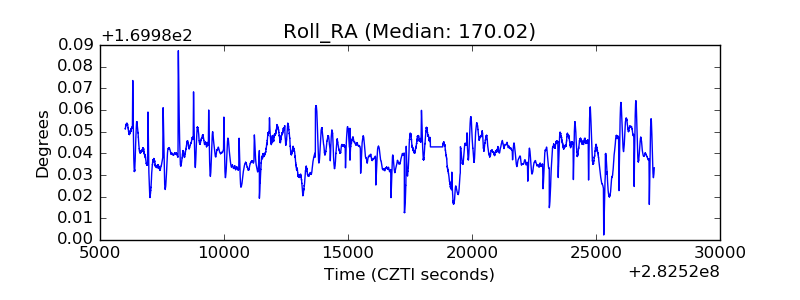 |
| Veto Counter | 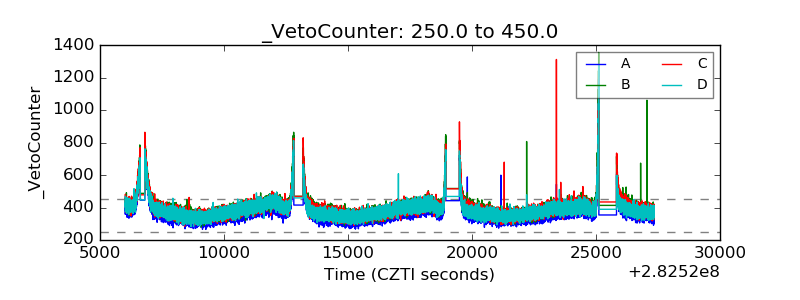 |