| Param | Original file | Final file |
|---|---|---|
| Filename | modeM0/AS1T03_033T01_9000002568_17379cztM0_level2.evt | modeM0/AS1T03_033T01_9000002568_17379cztM0_level2_quad_clean.evt |
| Size (bytes) | 541,612,800 | 83,721,600 |
| Size | 516.5 MB | 79.8 MB |
| Events in quadrant A | 2,995,228 | 545,673 |
| Events in quadrant B | 3,013,525 | 557,946 |
| Events in quadrant C | 3,041,846 | 534,599 |
| Events in quadrant D | 6,925,485 | 457,847 |
| Mode M0 | |||
|---|---|---|---|
| Quadrant | BADHDUFLAG | Total packets | Discarded packets |
| A | 0 | 12814 | 1 |
| B | 0 | 12839 | 1 |
| C | 0 | 12895 | 1 |
| D | 0 | 24871 | 1 |
| Mode M9 | |||
|---|---|---|---|
| Quadrant | BADHDUFLAG | Total packets | Discarded packets |
| A | 0 | 11 | 0 |
| B | 0 | 11 | 0 |
| C | 0 | 11 | 0 |
| D | 0 | 11 | 0 |
| Mode SS | |||
|---|---|---|---|
| Quadrant | BADHDUFLAG | Total packets | Discarded packets |
| A | 0 | 126 | 0 |
| B | 0 | 126 | 0 |
| C | 0 | 126 | 0 |
| D | 0 | 126 | 0 |
| Quadrant | Total seconds | Saturated seconds | Saturation percentage |
|---|---|---|---|
| A | 6296 | 40 | 0.635324% |
| B | 6296 | 42 | 0.667090% |
| C | 6296 | 52 | 0.825921% |
| D | 6297 | 1293 | 20.533587% |
Noise dominated data is calculated using 1-second bins in cleaned event files. If a bin has >2000 counts, and if more than 50% of those come from <1% of pixels, then it is considered to be noise-dominated and hence unusable.
| Quadrant | # 1 sec bins | Bins with >0 counts | Bins with >2000 counts | High rate bins dominated by noise | Noise dominated (total time) | Noise dominated (detector-on time) | Marked lightcurve |
|---|---|---|---|---|---|---|---|
| A | 7351 | 6296 | 0 | 0 | 0.00% | 0.00% | 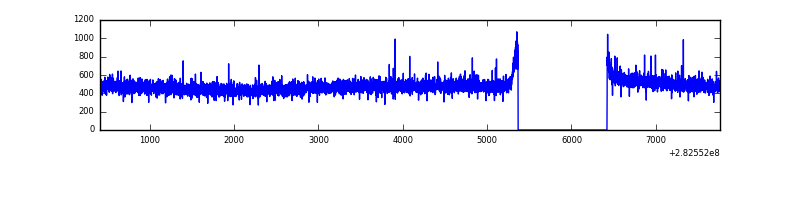 |
| B | 7351 | 6296 | 0 | 0 | 0.00% | 0.00% | 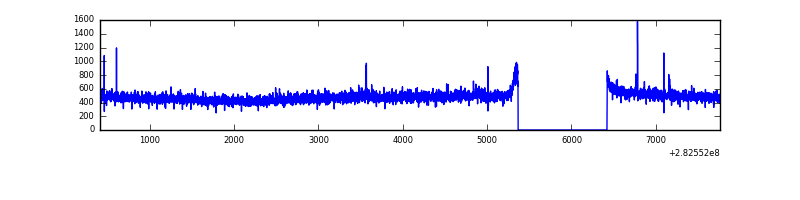 |
| C | 7351 | 6297 | 1 | 1 | 0.01% | 0.02% | 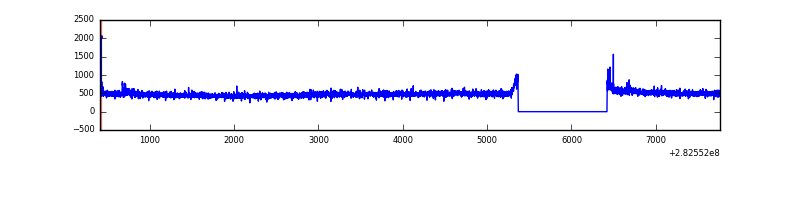 |
| D | 7352 | 6297 | 1060 | 1060 | 14.42% | 16.83% | 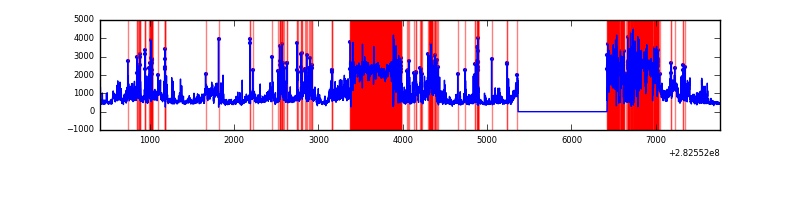 |
Top three noisy pixels from each quadrant. If the there are fewer than three noisy pixels in the level2.evt file, extra rows are filled as -1
| Pixel properties | Quadrant properties | ||||||
|---|---|---|---|---|---|---|---|
| Quadrant | DetID | PixID | Counts | Sigma | Mean | Median | Sigma |
| A | 0 | 226 | 6759 | 38.05 | 777 | 759 | 157.7 |
| A | 13 | 210 | 6189 | 34.43 | 777 | 759 | 157.7 |
| A | 3 | 137 | 5708 | 31.38 | 777 | 759 | 157.7 |
| B | 12 | 111 | 17796 | 115.68 | 768 | 750 | 147.4 |
| B | 11 | 111 | 15948 | 103.14 | 768 | 750 | 147.4 |
| B | 14 | 111 | 13541 | 86.8 | 768 | 750 | 147.4 |
| C | 14 | 238 | 113457 | 649.91 | 741 | 744 | 173.4 |
| C | 9 | 54 | 30417 | 171.1 | 741 | 744 | 173.4 |
| C | 3 | 233 | 6712 | 34.41 | 741 | 744 | 173.4 |
| D | 1 | 52 | 3318570 | 21221.93 | 646 | 631 | 156.3 |
| D | 11 | 176 | 745628 | 4765.09 | 646 | 631 | 156.3 |
| D | 13 | 232 | 282987 | 1805.98 | 646 | 631 | 156.3 |
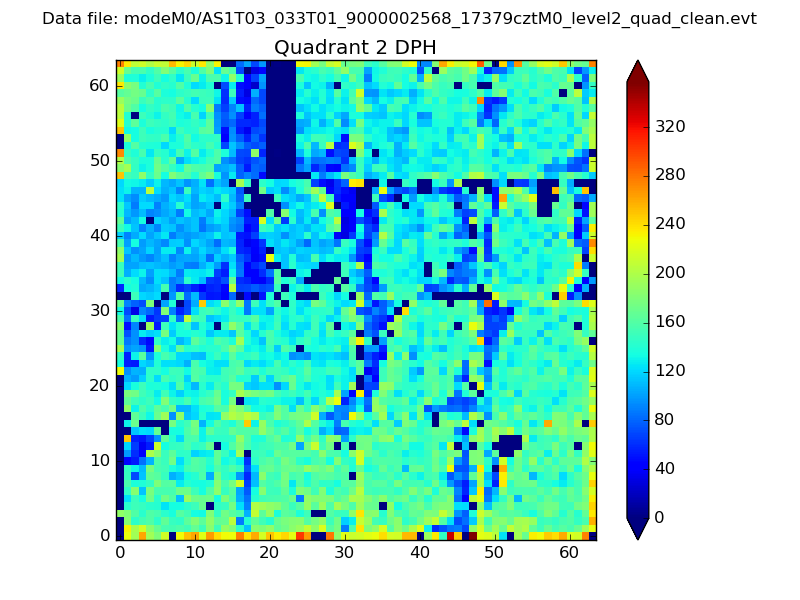
Histogram calculated using DETX and DETY for each event in the final _common_clean file
| Quadrant A | 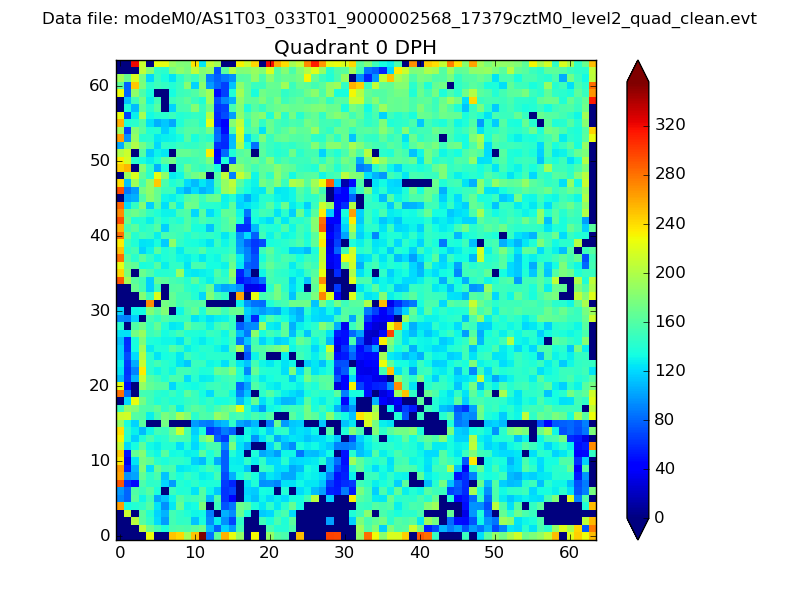 |
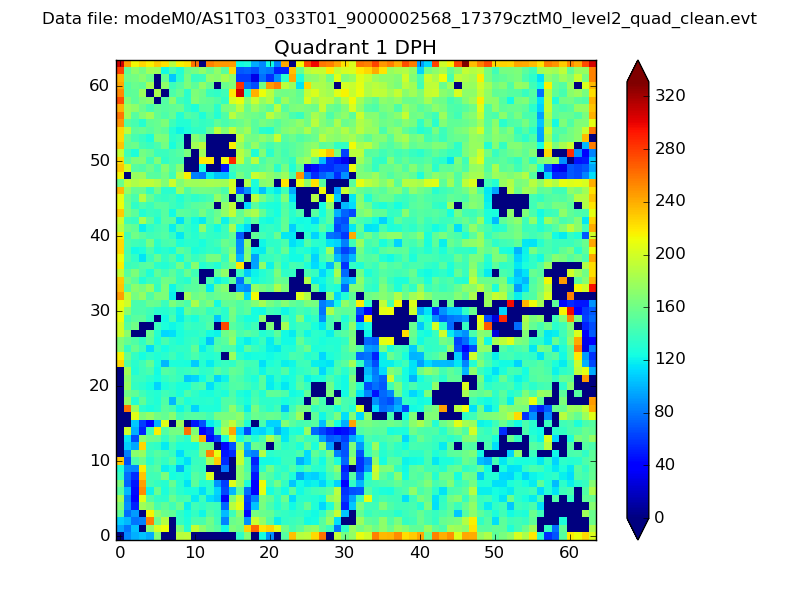 |
Quadrant B |
|---|---|---|---|
| Quadrant D | 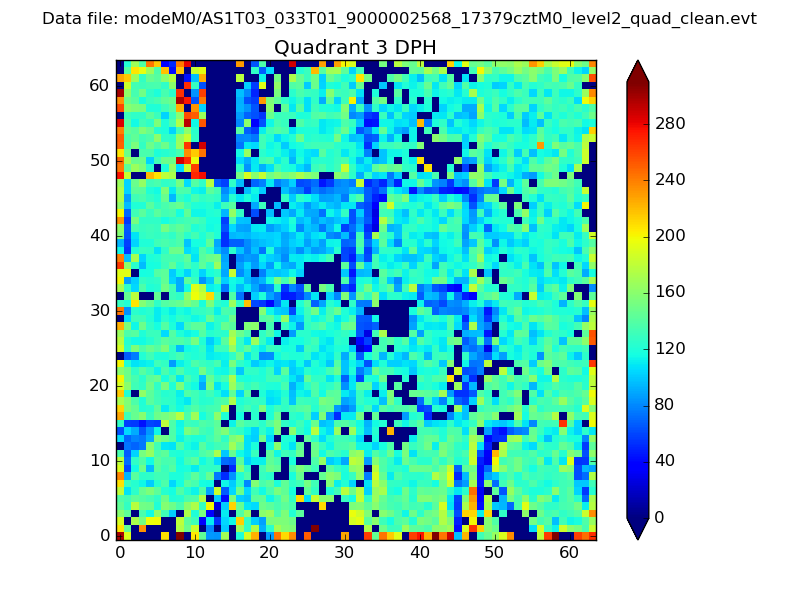 |
 |
Quadrant C |
| Plot type | Count rate plots | Images |
|---|---|---|
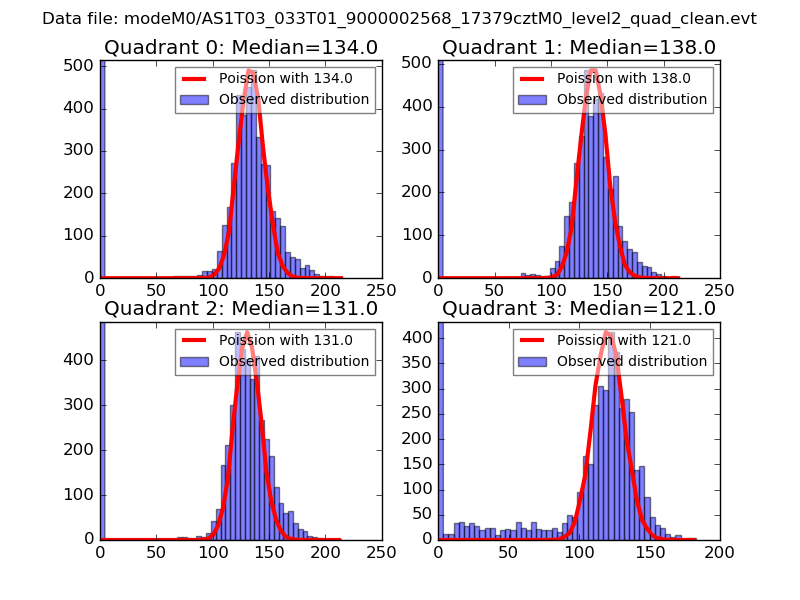
| Comparison with Poisson distribution Blue bars denote a histogram of data divided into 1 sec bins. Red curve is a Poisson curve with rate = median count rate of data. |
 |
 |
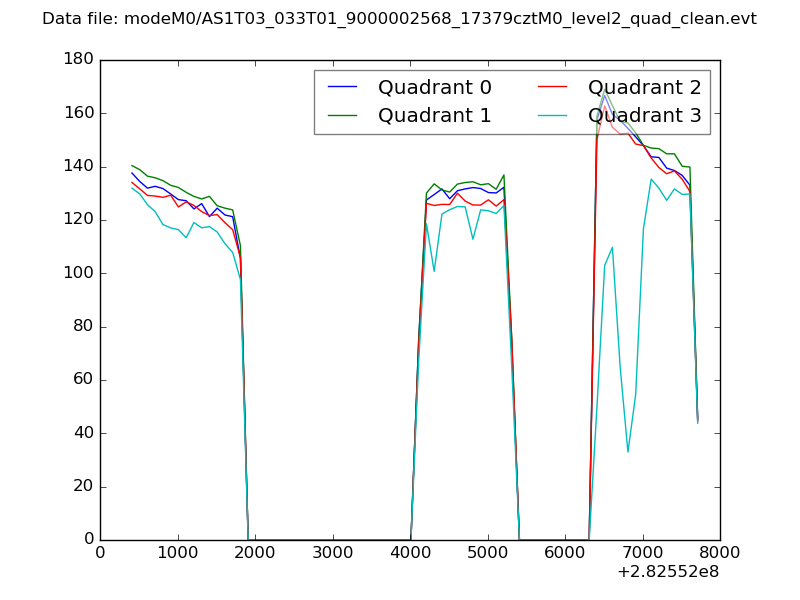
| Quadrant-wise count rates Data is divided into 100 sec bins |
 |
|
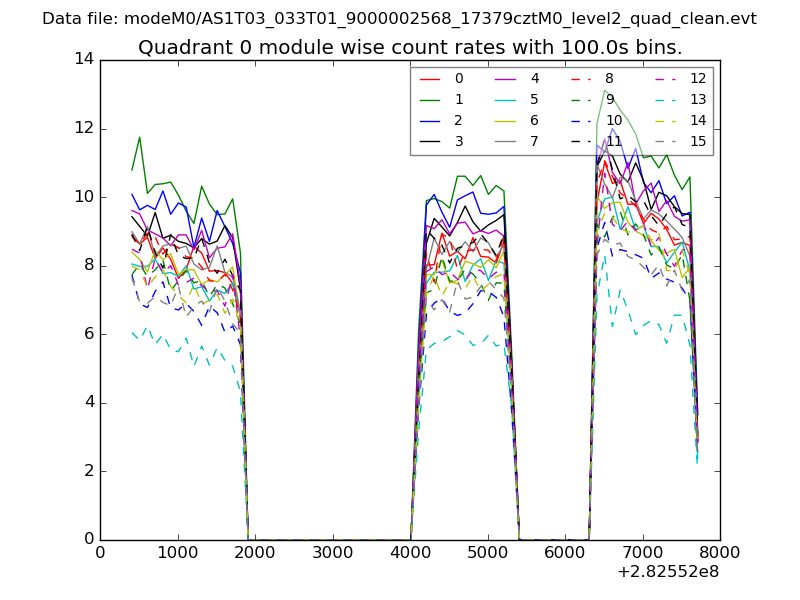
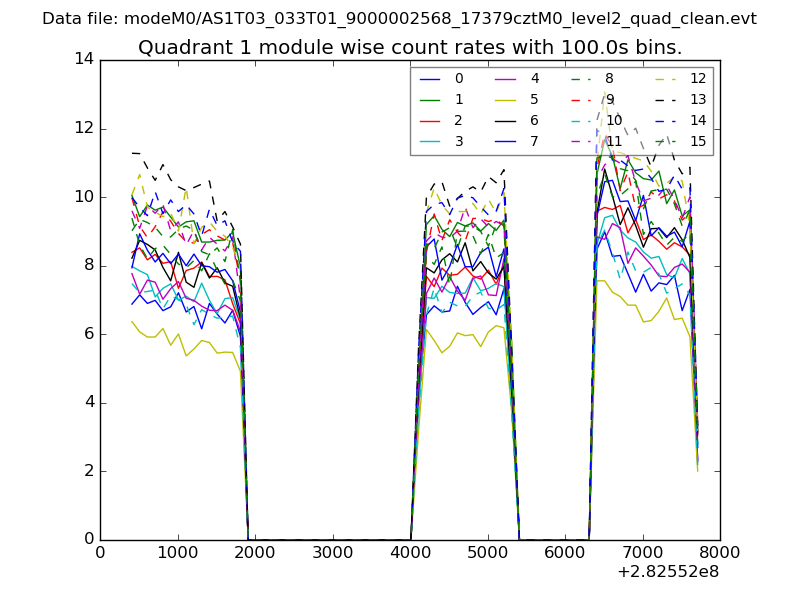
| Module-wise count rates for Quadrant A Data is divided into 100 sec bins |
 |
 |
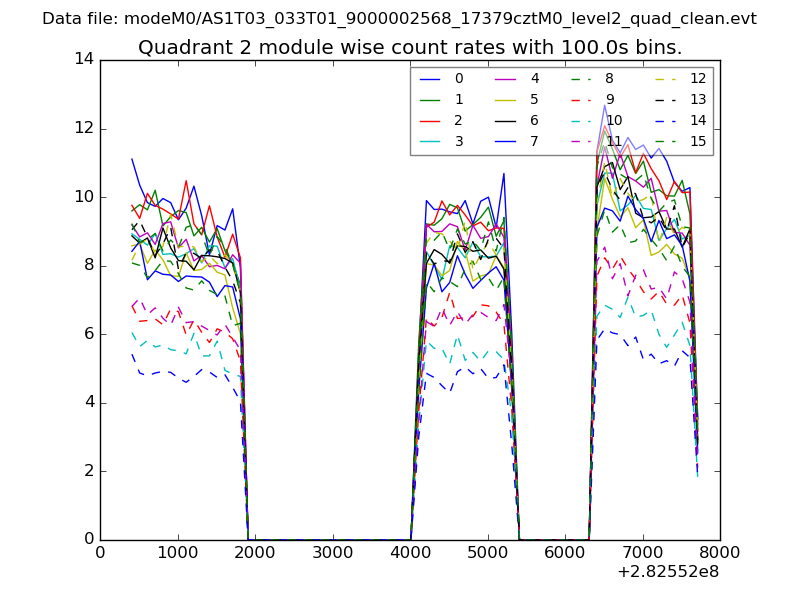
| Module-wise count rates for Quadrant B Data is divided into 100 sec bins |
 |
 |
| Module-wise count rates for Quadrant C Data is divided into 100 sec bins |
 |
 |
| Module-wise count rates for Quadrant D Data is divided into 100 sec bins |
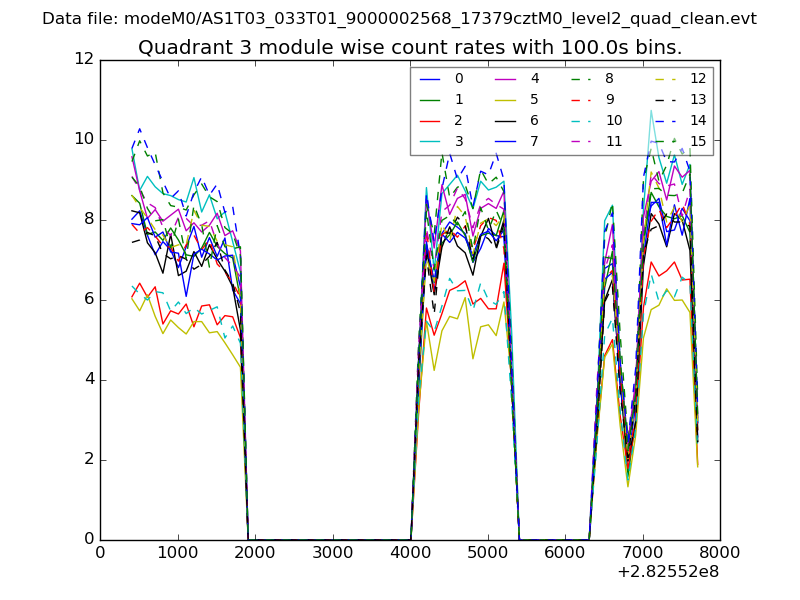 |
 |
| Parameter | Plot |
|---|---|
| CZT HV Monitor | 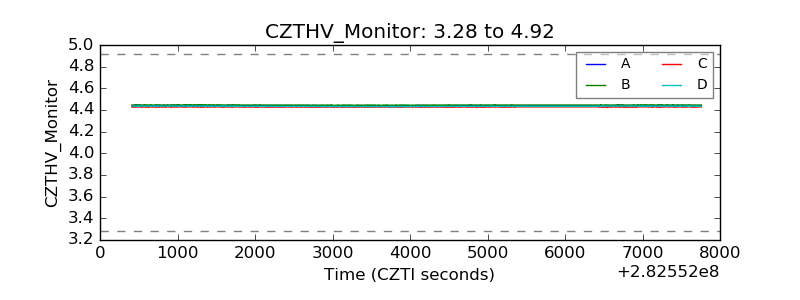 |
| D_VDD | 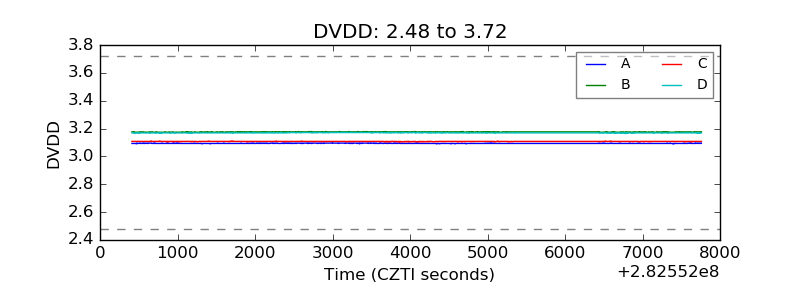 |
| Temperature 1 | 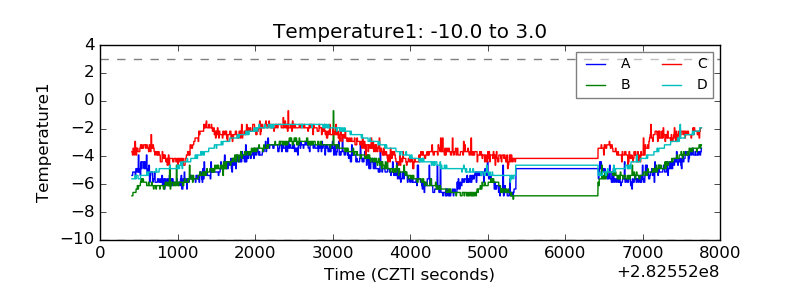 |
| Veto HV Monitor | 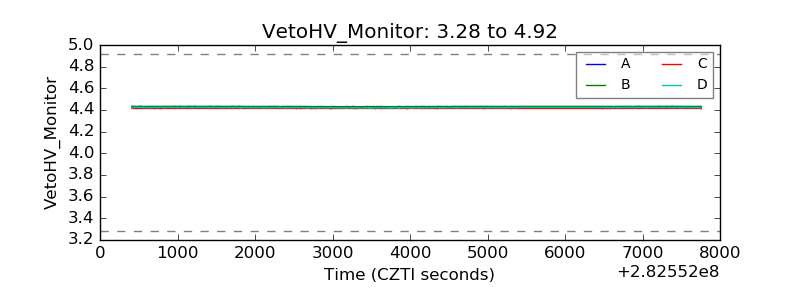 |
| Veto LLD | 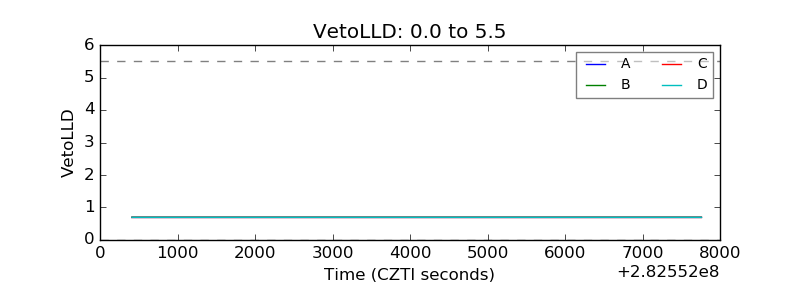 |
| Alpha Counter | 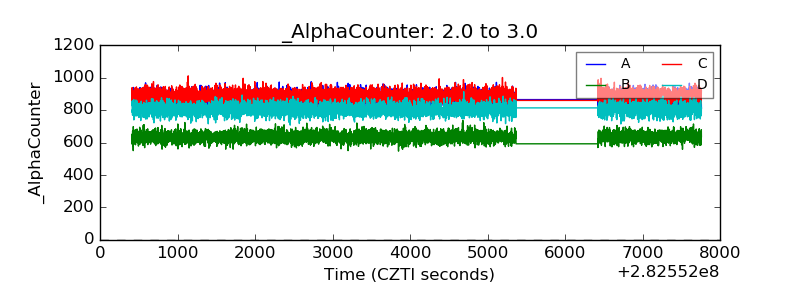 |
| _CPM_Rate | 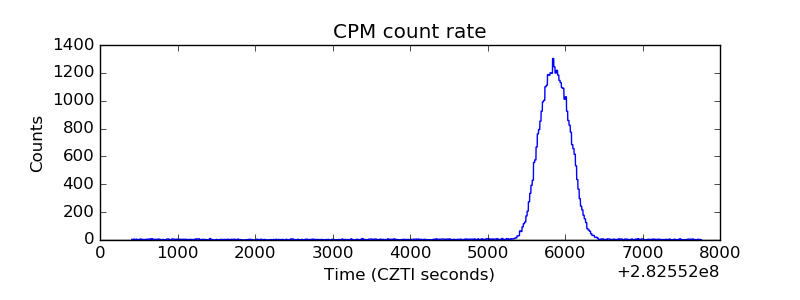 |
| CZT Counter | 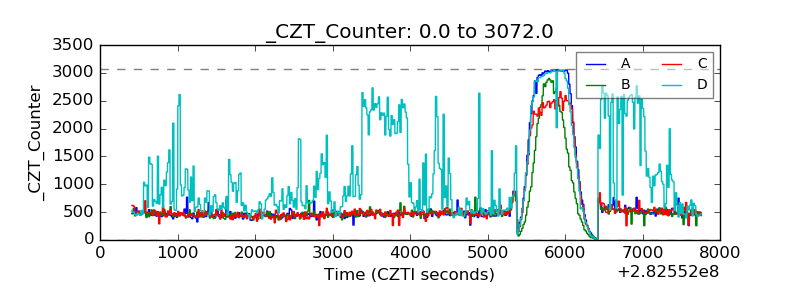 |
| +2.5 Volts monitor | 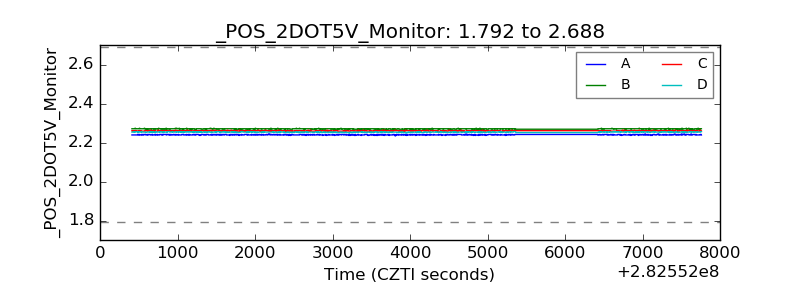 |
| +5 Volts monitor | 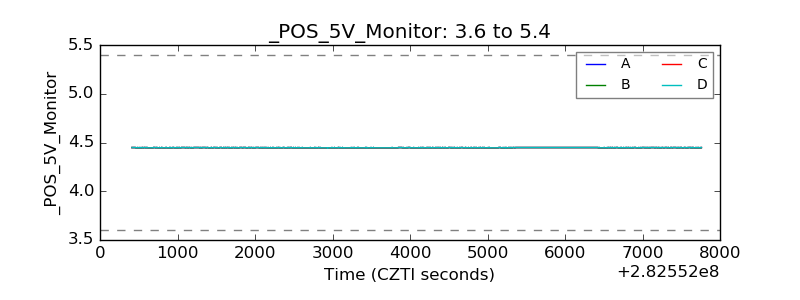 |
| _ROLL_ROT | 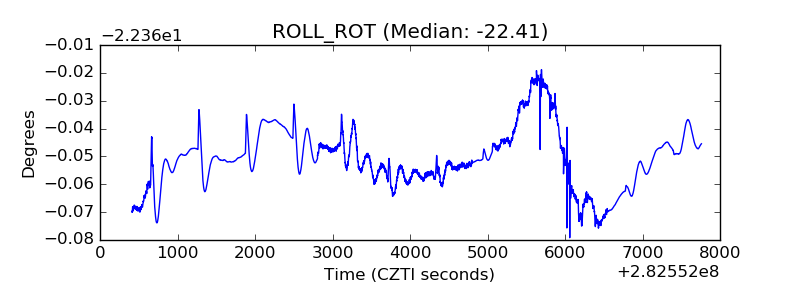 |
| _Roll_DEC | 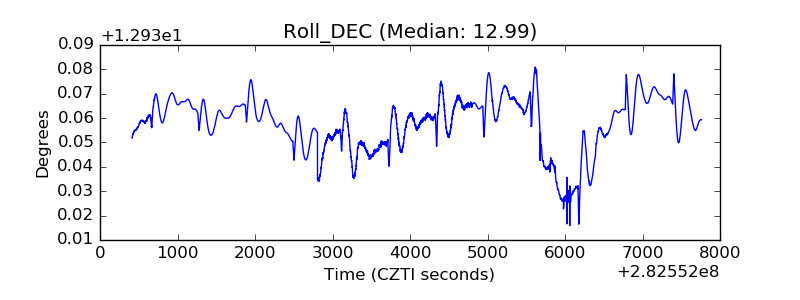 |
| _Roll_RA | 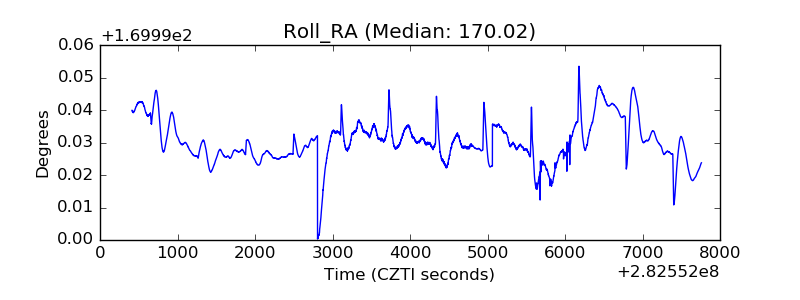 |
| Veto Counter | 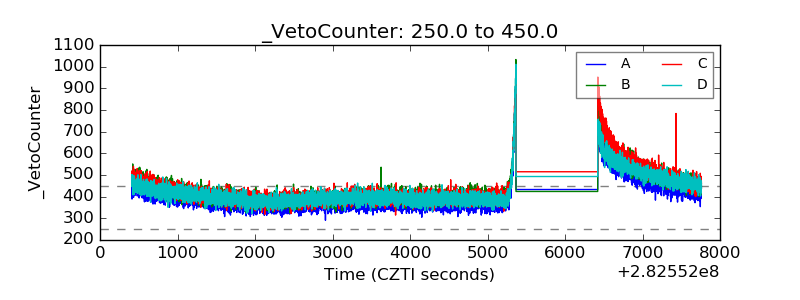 |