| Param | Original file | Final file |
|---|---|---|
| Filename | modeM0/AS1T03_033T01_9000002568_17381cztM0_level2.evt | modeM0/AS1T03_033T01_9000002568_17381cztM0_level2_quad_clean.evt |
| Size (bytes) | 302,307,840 | 41,734,080 |
| Size | 288.3 MB | 39.8 MB |
| Events in quadrant A | 1,928,867 | 249,938 |
| Events in quadrant B | 2,004,797 | 253,575 |
| Events in quadrant C | 1,974,993 | 244,132 |
| Events in quadrant D | 2,967,562 | 227,214 |
| Mode M0 | |||
|---|---|---|---|
| Quadrant | BADHDUFLAG | Total packets | Discarded packets |
| A | 0 | 8211 | 0 |
| B | 0 | 8395 | 0 |
| C | 0 | 8286 | 0 |
| D | 0 | 11473 | 0 |
| Mode SS | |||
|---|---|---|---|
| Quadrant | BADHDUFLAG | Total packets | Discarded packets |
| A | 0 | 82 | 0 |
| B | 0 | 82 | 0 |
| C | 0 | 82 | 0 |
| D | 0 | 82 | 0 |
| Quadrant | Total seconds | Saturated seconds | Saturation percentage |
|---|---|---|---|
| A | 4088 | 3 | 0.073386% |
| B | 4089 | 7 | 0.171191% |
| C | 4089 | 20 | 0.489117% |
| D | 4089 | 148 | 3.619467% |
Noise dominated data is calculated using 1-second bins in cleaned event files. If a bin has >2000 counts, and if more than 50% of those come from <1% of pixels, then it is considered to be noise-dominated and hence unusable.
| Quadrant | # 1 sec bins | Bins with >0 counts | Bins with >2000 counts | High rate bins dominated by noise | Noise dominated (total time) | Noise dominated (detector-on time) | Marked lightcurve |
|---|---|---|---|---|---|---|---|
| A | 4088 | 4088 | 0 | 0 | 0.00% | 0.00% | 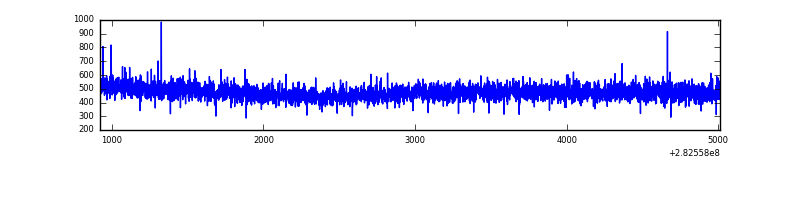 |
| B | 4089 | 4089 | 4 | 4 | 0.10% | 0.10% | 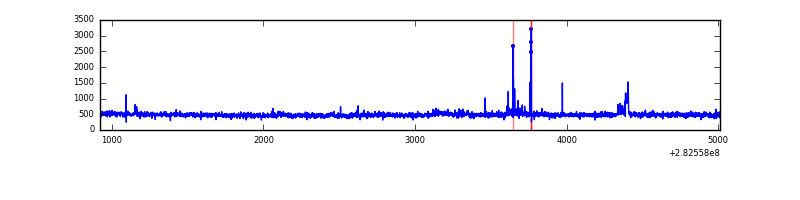 |
| C | 4089 | 4089 | 0 | 0 | 0.00% | 0.00% | 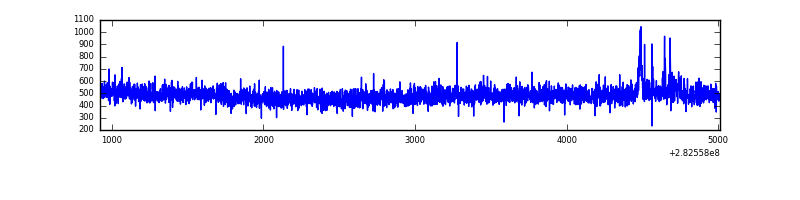 |
| D | 4089 | 4089 | 127 | 127 | 3.11% | 3.11% | 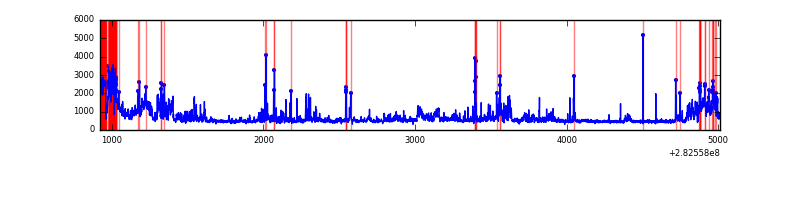 |
Top three noisy pixels from each quadrant. If the there are fewer than three noisy pixels in the level2.evt file, extra rows are filled as -1
| Pixel properties | Quadrant properties | ||||||
|---|---|---|---|---|---|---|---|
| Quadrant | DetID | PixID | Counts | Sigma | Mean | Median | Sigma |
| A | 0 | 226 | 4369 | 38.02 | 501 | 490 | 102.0 |
| A | 12 | 194 | 3797 | 32.42 | 501 | 490 | 102.0 |
| A | 3 | 137 | 3577 | 30.26 | 501 | 490 | 102.0 |
| B | 0 | 182 | 23751 | 244.65 | 495 | 484 | 95.1 |
| B | 0 | 230 | 22289 | 229.28 | 495 | 484 | 95.1 |
| B | 4 | 216 | 14310 | 145.38 | 495 | 484 | 95.1 |
| C | 14 | 238 | 74977 | 660.34 | 479 | 483 | 112.8 |
| C | 9 | 54 | 27253 | 237.3 | 479 | 483 | 112.8 |
| C | 13 | 61 | 3363 | 25.53 | 479 | 483 | 112.8 |
| D | 11 | 176 | 539600 | 4572.93 | 480 | 466 | 117.9 |
| D | 1 | 52 | 287196 | 2432.04 | 480 | 466 | 117.9 |
| D | 13 | 232 | 138658 | 1172.14 | 480 | 466 | 117.9 |
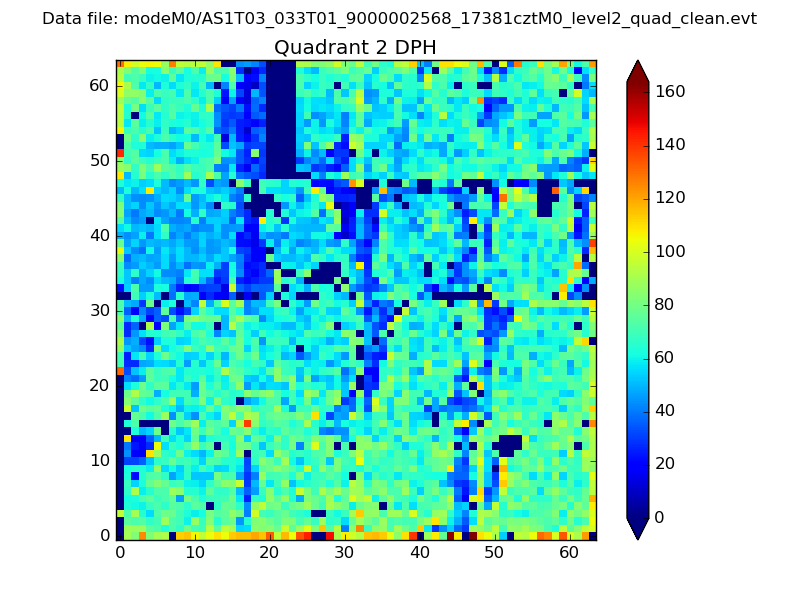
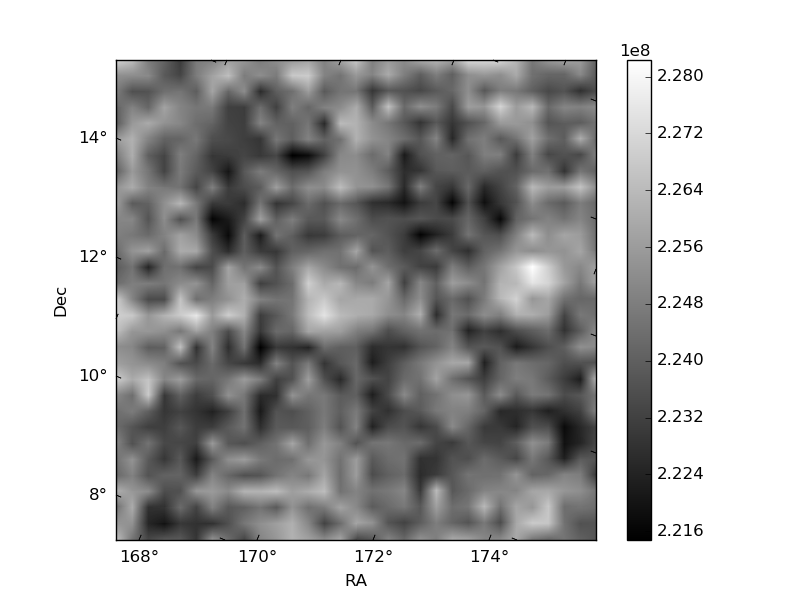
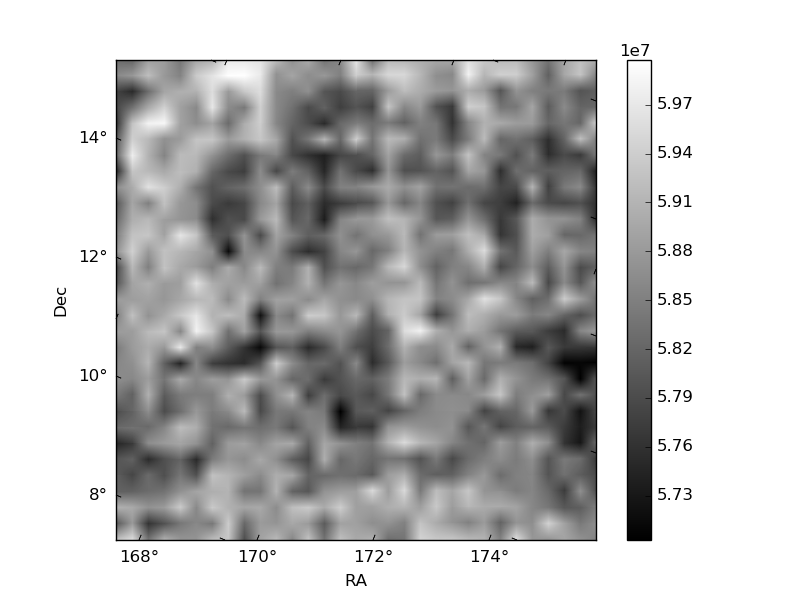
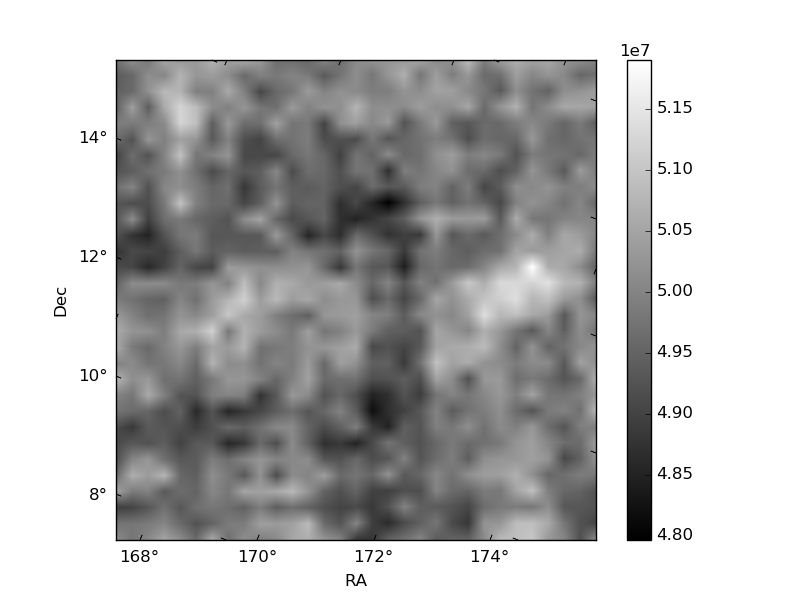
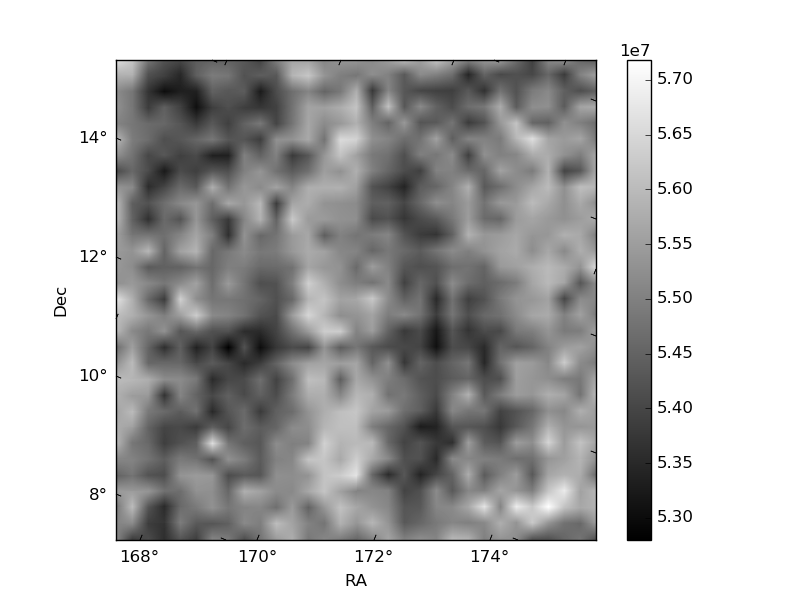
Histogram calculated using DETX and DETY for each event in the final _common_clean file
| Quadrant A | 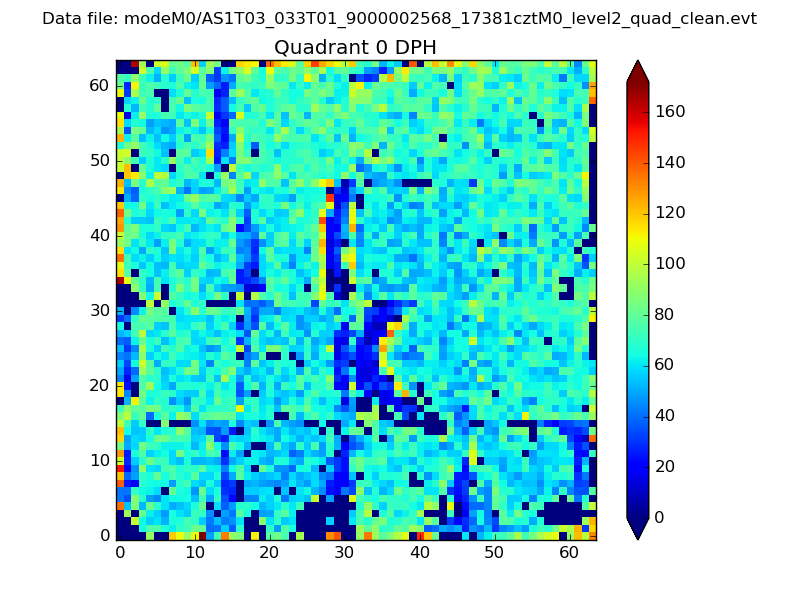 |
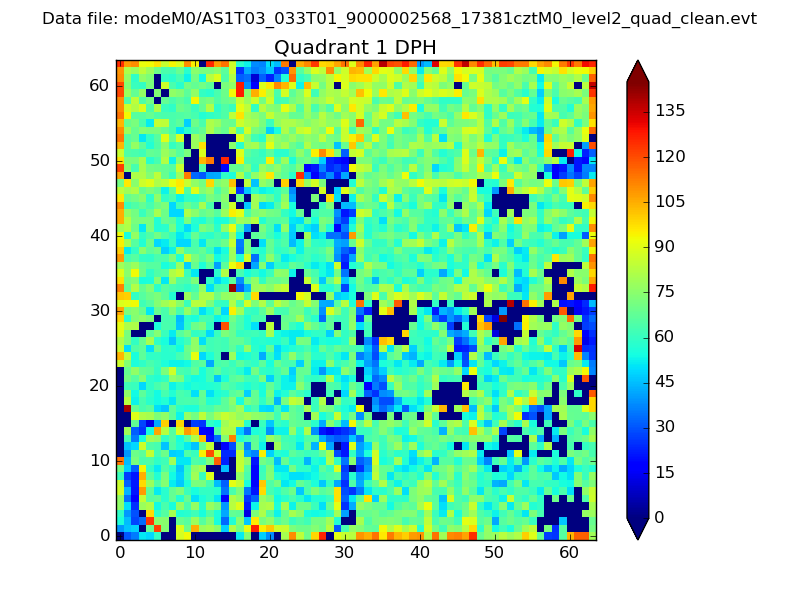 |
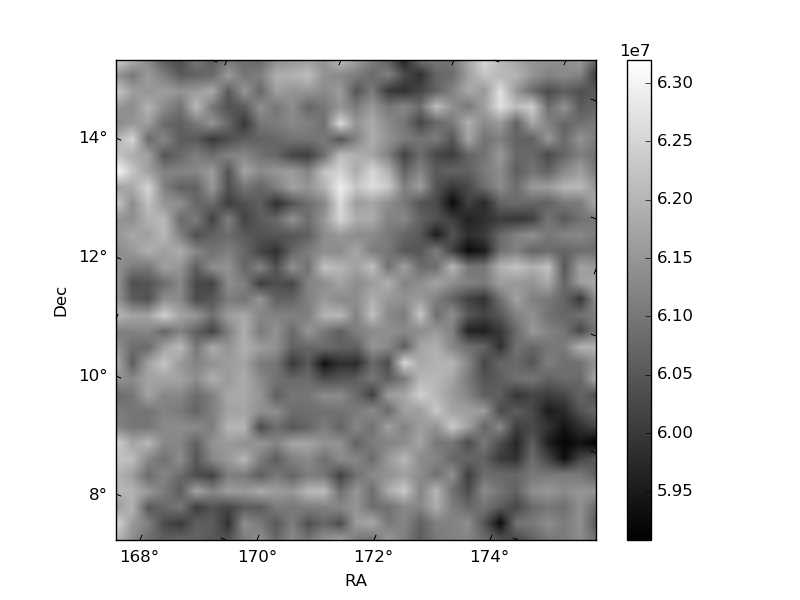
Quadrant B |
|---|---|---|---|
| Quadrant D | 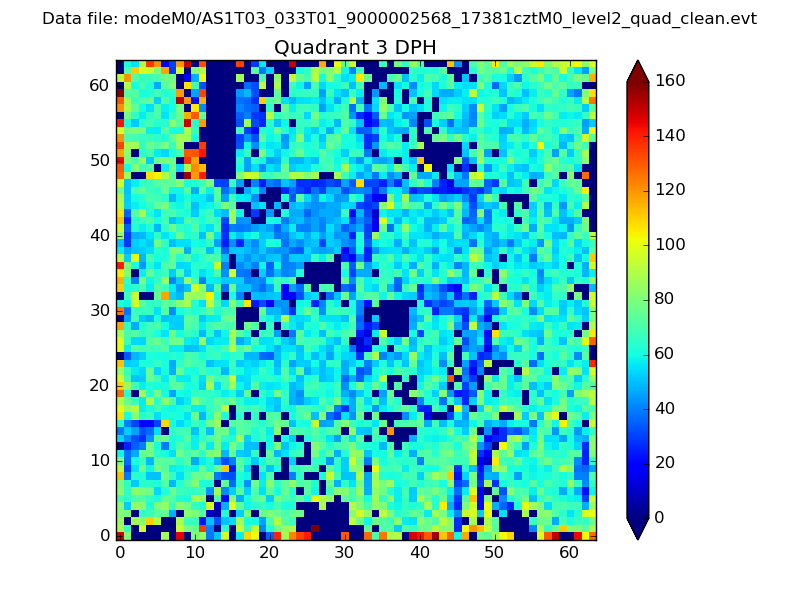 |
 |
Quadrant C |
| Plot type | Count rate plots | Images |
|---|---|---|
| Comparison with Poisson distribution Blue bars denote a histogram of data divided into 1 sec bins. Red curve is a Poisson curve with rate = median count rate of data. |
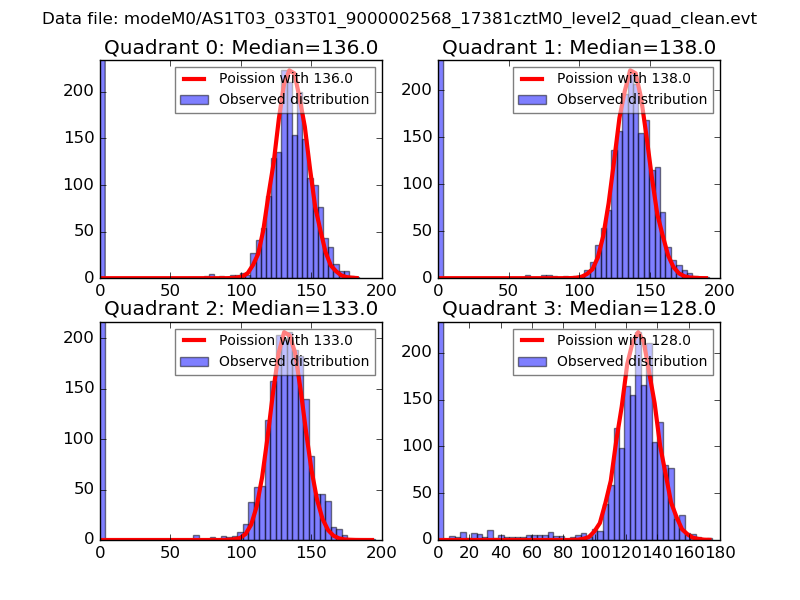 |
 |
| Quadrant-wise count rates Data is divided into 100 sec bins |
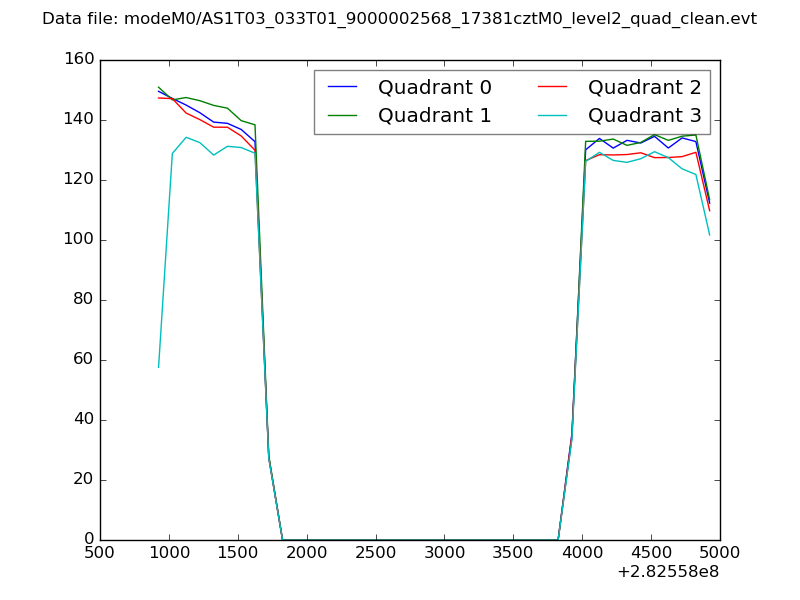 |
|
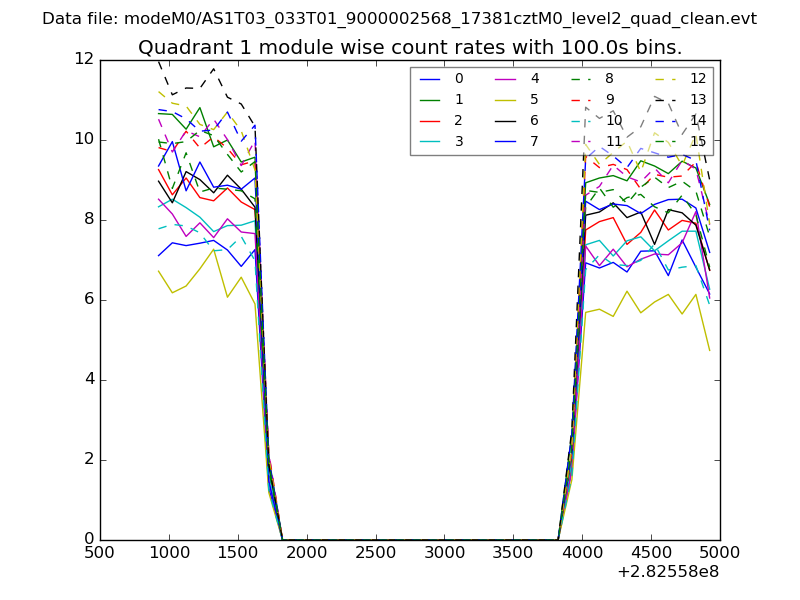
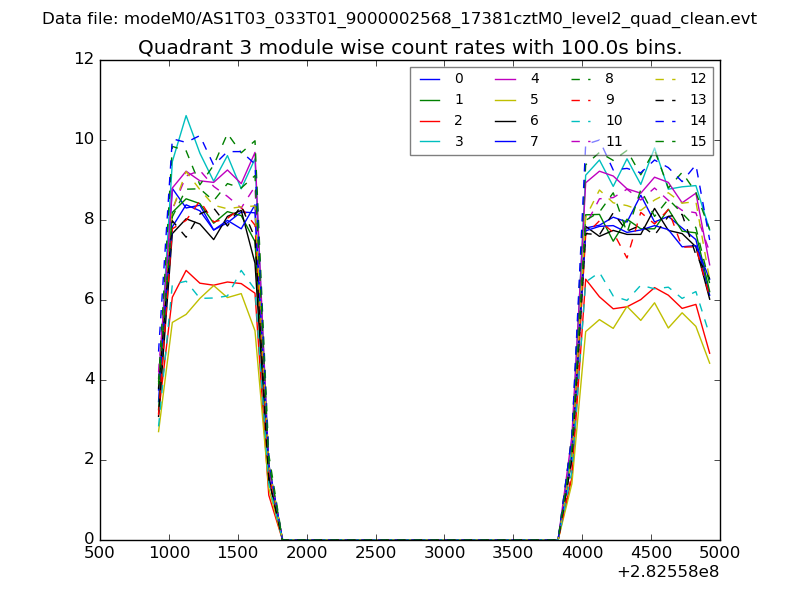
| Module-wise count rates for Quadrant A Data is divided into 100 sec bins |
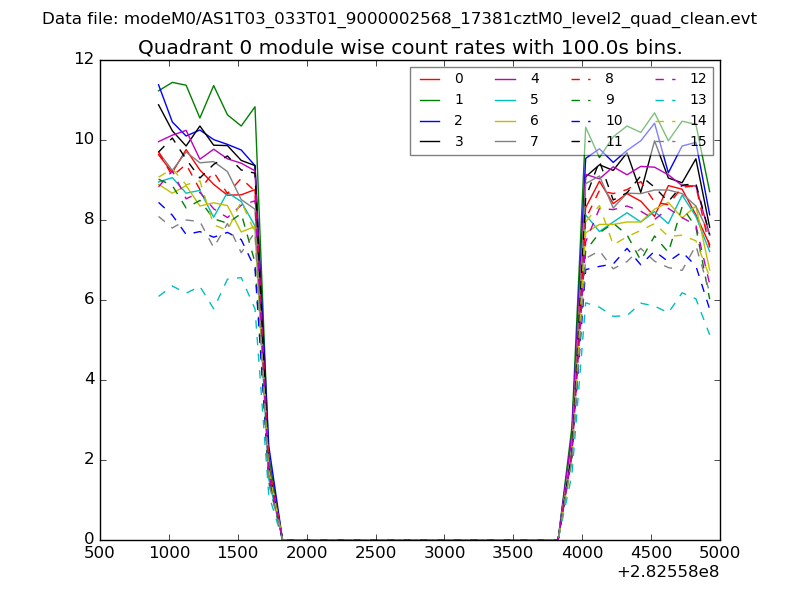 |
 |
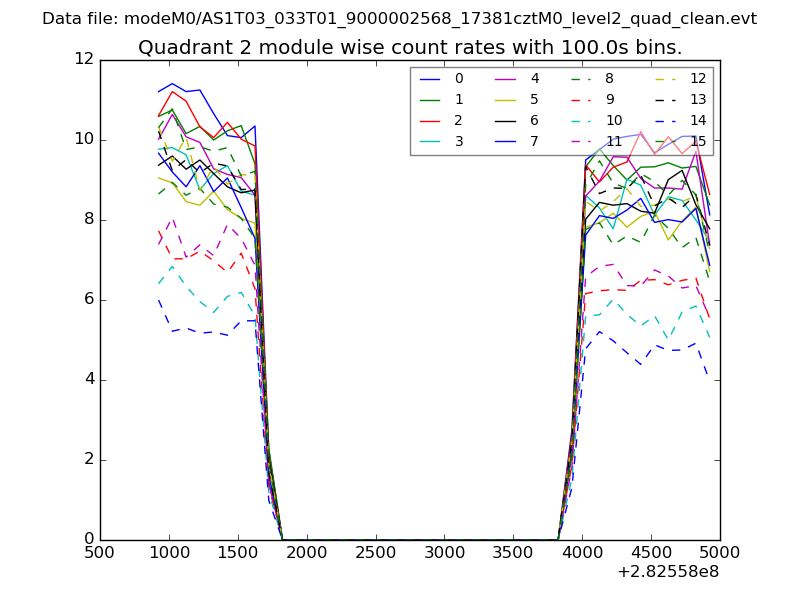
| Module-wise count rates for Quadrant B Data is divided into 100 sec bins |
 |
 |
| Module-wise count rates for Quadrant C Data is divided into 100 sec bins |
 |
 |
| Module-wise count rates for Quadrant D Data is divided into 100 sec bins |
 |
 |
| Parameter | Plot |
|---|---|
| CZT HV Monitor | 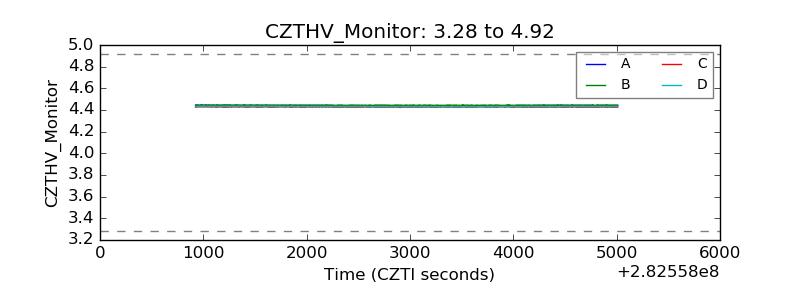 |
| D_VDD | 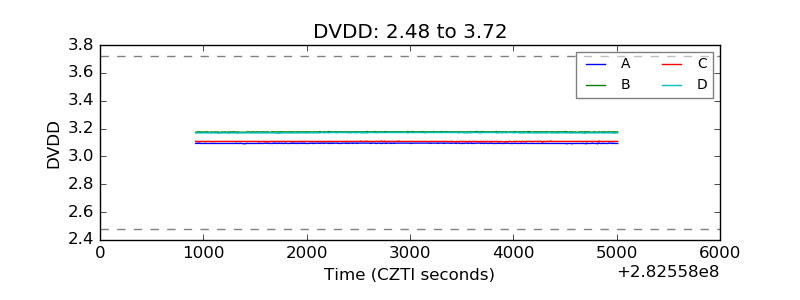 |
| Temperature 1 | 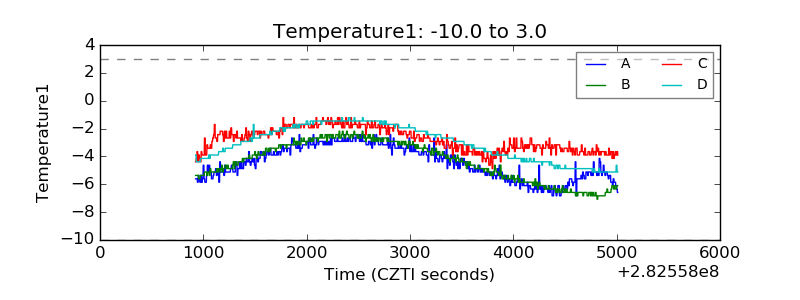 |
| Veto HV Monitor | 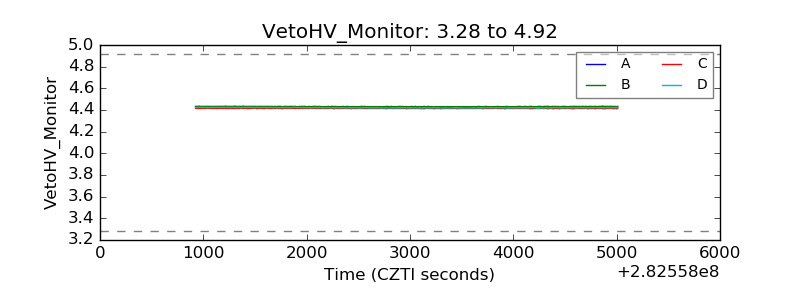 |
| Veto LLD | 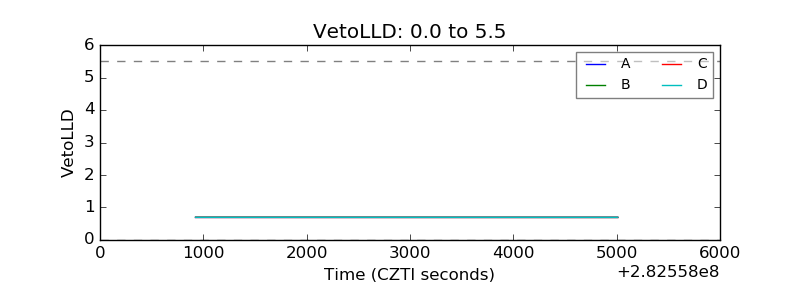 |
| Alpha Counter | 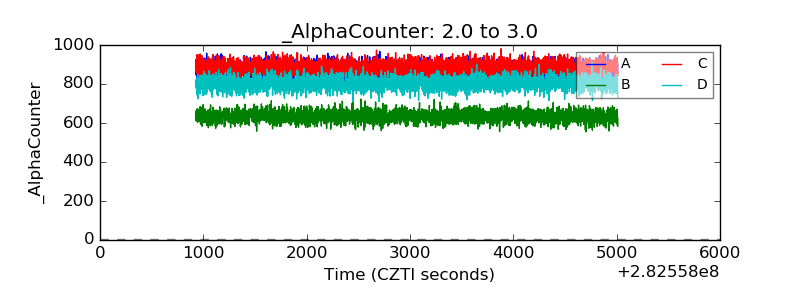 |
| _CPM_Rate | 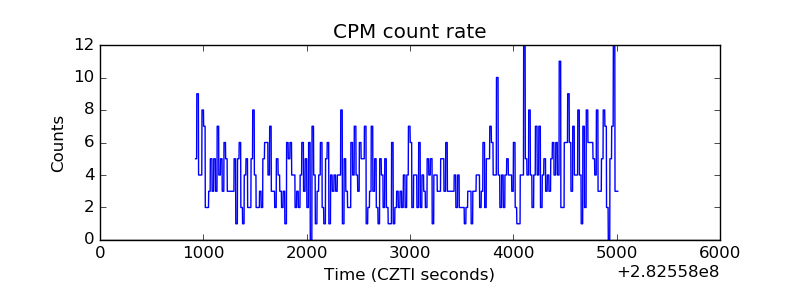 |
| CZT Counter | 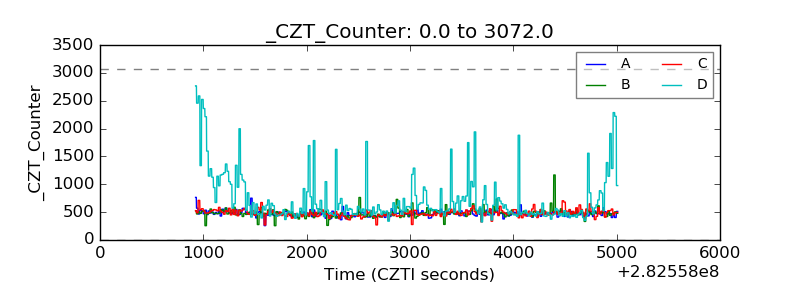 |
| +2.5 Volts monitor | 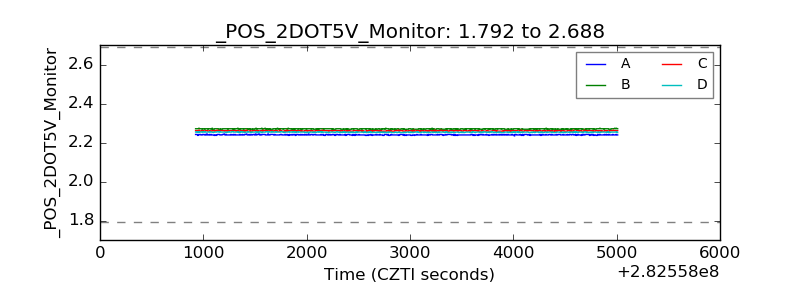 |
| +5 Volts monitor | 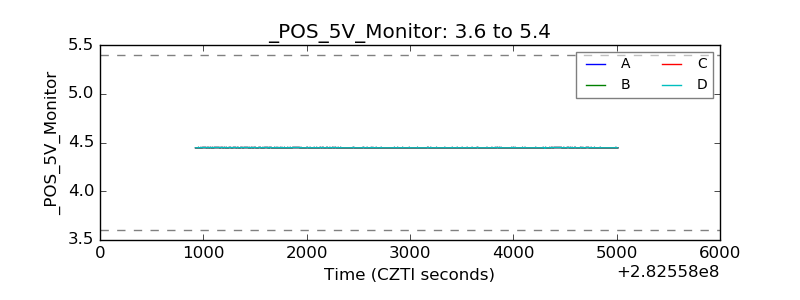 |
| _ROLL_ROT | 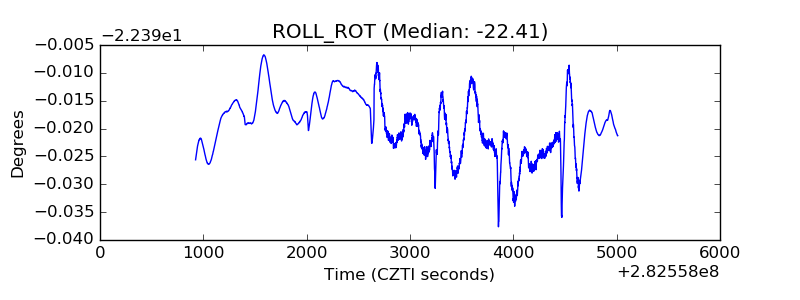 |
| _Roll_DEC | 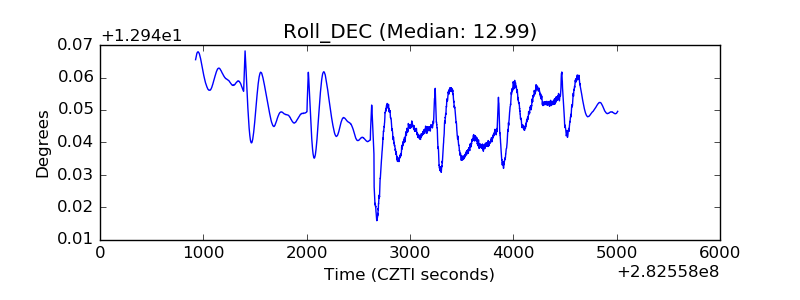 |
| _Roll_RA | 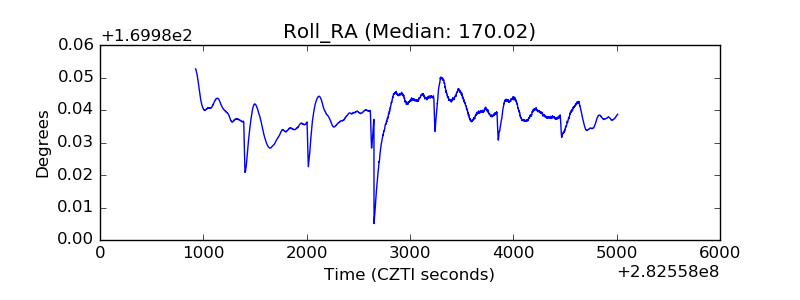 |
| Veto Counter | 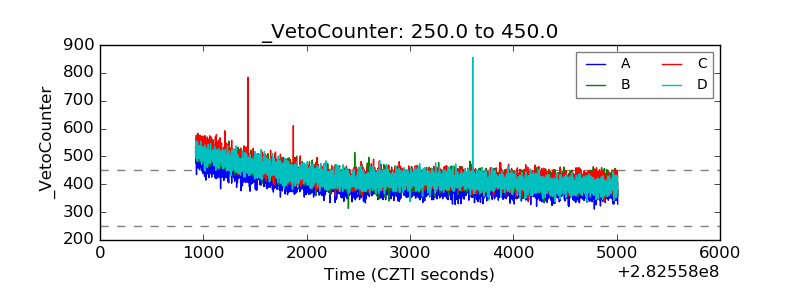 |