| Param | Original file | Final file |
|---|---|---|
| Filename | modeM0/AS1A05_074T02_9000002572cztM0_level2.fits | modeM0/AS1A05_074T02_9000002572cztM0_level2_quad_clean.evt |
| Size (bytes) | 284,319,360 | 200,381,760 |
| Size | 271.1 MB | 191.1 MB |
| Events in quadrant A | 1,774,228 | 1,081,483 |
| Events in quadrant B | 1,687,024 | 1,075,742 |
| Events in quadrant C | 1,699,204 | 1,011,519 |
| Events in quadrant D | 1,459,244 | 907,569 |
| Mode SS | |||
|---|---|---|---|
| Quadrant | BADHDUFLAG | Total packets | Discarded packets |
| A | 0 | 590 | 0 |
| B | 0 | 590 | 0 |
| C | 0 | 590 | 0 |
| D | 0 | 590 | 0 |
| Mode M9 | |||
|---|---|---|---|
| Quadrant | BADHDUFLAG | Total packets | Discarded packets |
| A | 0 | 55 | 0 |
| B | 0 | 55 | 0 |
| C | 0 | 55 | 0 |
| D | 0 | 55 | 0 |
| Mode M0 | |||
|---|---|---|---|
| Quadrant | BADHDUFLAG | Total packets | Discarded packets |
| A | 0 | 60453 | 0 |
| B | 0 | 64421 | 0 |
| C | 0 | 60421 | 0 |
| D | 0 | 78301 | 0 |
| Quadrant | Total seconds | Saturated seconds | Saturation percentage |
|---|---|---|---|
| A | 28959 | 314 | 1.084292% |
| B | 28959 | 643 | 2.220381% |
| C | 28959 | 439 | 1.515936% |
| D | 28959 | 1365 | 4.713561% |
Noise dominated data is calculated using 1-second bins in cleaned event files. If a bin has >2000 counts, and if more than 50% of those come from <1% of pixels, then it is considered to be noise-dominated and hence unusable.
| Quadrant | # 1 sec bins | Bins with >0 counts | Bins with >2000 counts | High rate bins dominated by noise | Noise dominated (total time) | Noise dominated (detector-on time) | Marked lightcurve |
|---|---|---|---|---|---|---|---|
| A | 34434 | 28958 | 0 | 0 | 0.00% | 0.00% |  |
| B | 34434 | 28958 | 0 | 0 | 0.00% | 0.00% |  |
| C | 34434 | 28959 | 0 | 0 | 0.00% | 0.00% |  |
| D | 34434 | 28941 | 0 | 0 | 0.00% | 0.00% |  |
Top three noisy pixels from each quadrant. If the there are fewer than three noisy pixels in the level2.evt file, extra rows are filled as -1
| Pixel properties | Quadrant properties | ||||||
|---|---|---|---|---|---|---|---|
| Quadrant | DetID | PixID | Counts | Sigma | Mean | Median | Sigma |
| A | 0 | 29 | 1664 | 10.61 | 462 | 434 | 115.9 |
| A | 7 | 110 | 1468 | 8.92 | 462 | 434 | 115.9 |
| A | 9 | 19 | 1297 | 7.45 | 462 | 434 | 115.9 |
| B | 2 | 9 | 1354 | 10.43 | 446 | 427 | 88.9 |
| B | 3 | 80 | 1153 | 8.17 | 446 | 427 | 88.9 |
| B | 2 | 8 | 1142 | 8.04 | 446 | 427 | 88.9 |
| C | 12 | 241 | 1195 | 6.73 | 449 | 420 | 115.1 |
| C | 3 | 126 | 1167 | 6.49 | 449 | 420 | 115.1 |
| C | 7 | 111 | 1144 | 6.29 | 449 | 420 | 115.1 |
| D | 3 | 14 | 1168 | 7.05 | 416 | 380 | 111.8 |
| D | 6 | 67 | 1071 | 6.18 | 416 | 380 | 111.8 |
| D | 3 | 31 | 1021 | 5.73 | 416 | 380 | 111.8 |
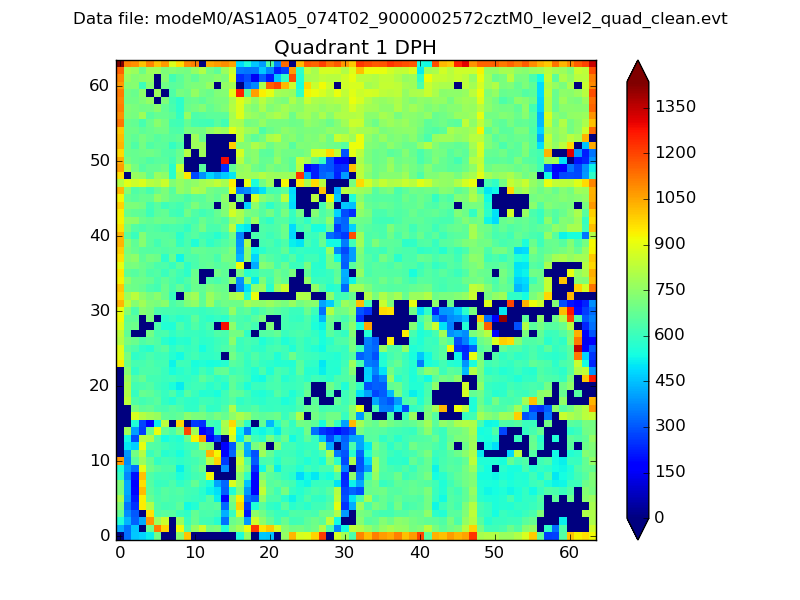
Histogram calculated using DETX and DETY for each event in the final _common_clean file
| Quadrant A |  |
 |
Quadrant B |
|---|---|---|---|
| Quadrant D |  |
 |
Quadrant C |
| Plot type | Count rate plots | Images |
|---|---|---|
| Comparison with Poisson distribution Blue bars denote a histogram of data divided into 1 sec bins. Red curve is a Poisson curve with rate = median count rate of data. |
 |
 |
| Quadrant-wise count rates Data is divided into 100 sec bins |
 |
|
| Module-wise count rates for Quadrant A Data is divided into 100 sec bins |
 |
 |
| Module-wise count rates for Quadrant B Data is divided into 100 sec bins |
 |
 |
| Module-wise count rates for Quadrant C Data is divided into 100 sec bins |
 |
 |
| Module-wise count rates for Quadrant D Data is divided into 100 sec bins |
 |
 |
| Parameter | Plot |
|---|---|
| CZT HV Monitor |  |
| D_VDD | 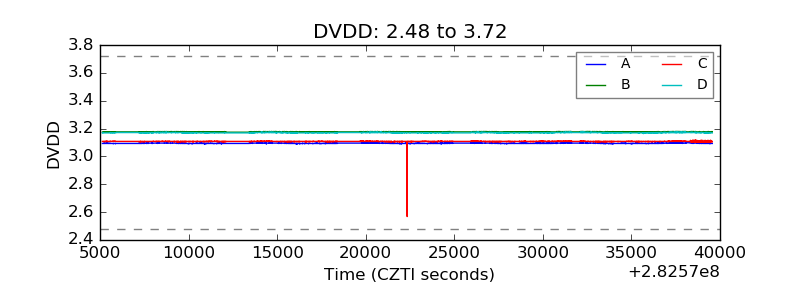 |
| Temperature 1 |  |
| Veto HV Monitor |  |
| Veto LLD |  |
| Alpha Counter |  |
| _CPM_Rate |  |
| CZT Counter |  |
| +2.5 Volts monitor |  |
| +5 Volts monitor |  |
| _ROLL_ROT | 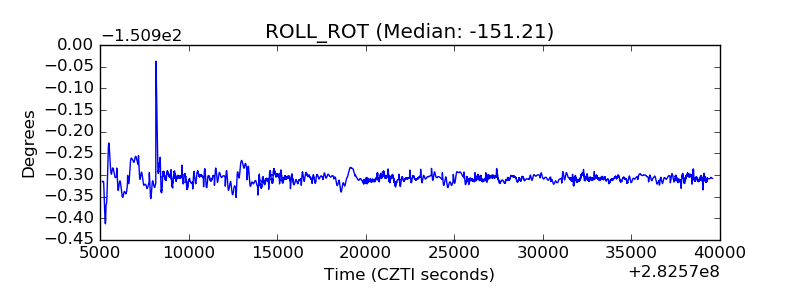 |
| _Roll_DEC |  |
| _Roll_RA | 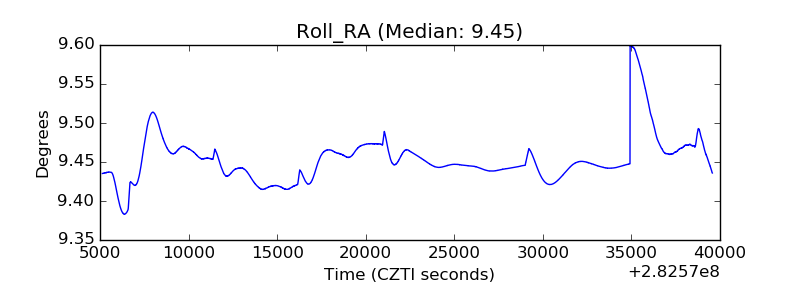 |
| Veto Counter |  |