| Param | Original file | Final file |
|---|---|---|
| Filename | modeM0/AS1A05_074T02_9000002572_17383cztM0_level2.evt | modeM0/AS1A05_074T02_9000002572_17383cztM0_level2_quad_clean.evt |
| Size (bytes) | 185,578,560 | 37,805,760 |
| Size | 177.0 MB | 36.1 MB |
| Events in quadrant A | 1,281,924 | 252,772 |
| Events in quadrant B | 1,298,759 | 257,193 |
| Events in quadrant C | 1,268,972 | 239,117 |
| Events in quadrant D | 1,615,655 | 233,012 |
| Mode SS | |||
|---|---|---|---|
| Quadrant | BADHDUFLAG | Total packets | Discarded packets |
| A | 0 | 46 | 0 |
| B | 0 | 46 | 0 |
| C | 0 | 46 | 0 |
| D | 0 | 46 | 0 |
| Mode M9 | |||
|---|---|---|---|
| Quadrant | BADHDUFLAG | Total packets | Discarded packets |
| A | 0 | 13 | 0 |
| B | 0 | 13 | 0 |
| C | 0 | 13 | 0 |
| D | 0 | 13 | 0 |
| Mode M0 | |||
|---|---|---|---|
| Quadrant | BADHDUFLAG | Total packets | Discarded packets |
| A | 0 | 5230 | 1 |
| B | 0 | 5290 | 1 |
| C | 0 | 5149 | 1 |
| D | 0 | 6277 | 1 |
| Quadrant | Total seconds | Saturated seconds | Saturation percentage |
|---|---|---|---|
| A | 2252 | 108 | 4.795737% |
| B | 2252 | 101 | 4.484902% |
| C | 2251 | 109 | 4.842292% |
| D | 2251 | 165 | 7.330076% |
Noise dominated data is calculated using 1-second bins in cleaned event files. If a bin has >2000 counts, and if more than 50% of those come from <1% of pixels, then it is considered to be noise-dominated and hence unusable.
| Quadrant | # 1 sec bins | Bins with >0 counts | Bins with >2000 counts | High rate bins dominated by noise | Noise dominated (total time) | Noise dominated (detector-on time) | Marked lightcurve |
|---|---|---|---|---|---|---|---|
| A | 3552 | 2252 | 0 | 0 | 0.00% | 0.00% | 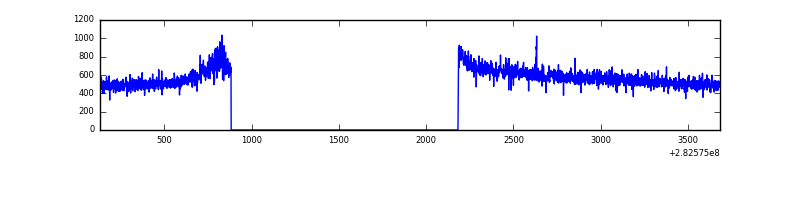 |
| B | 3552 | 2252 | 0 | 0 | 0.00% | 0.00% | 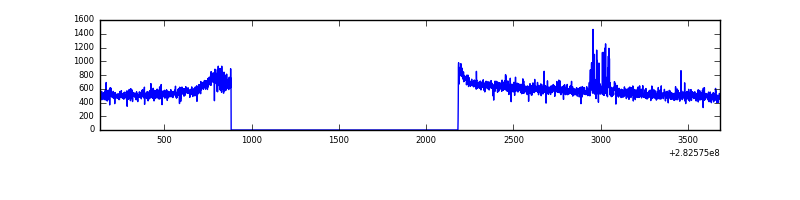 |
| C | 3551 | 2252 | 0 | 0 | 0.00% | 0.00% | 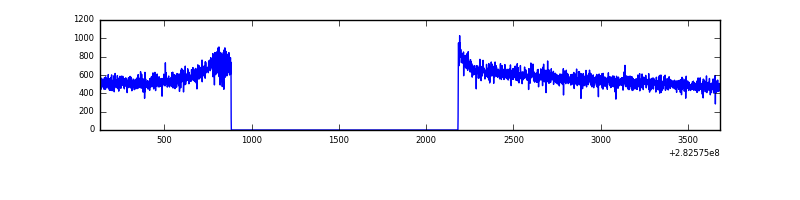 |
| D | 3551 | 2251 | 48 | 48 | 1.35% | 2.13% | 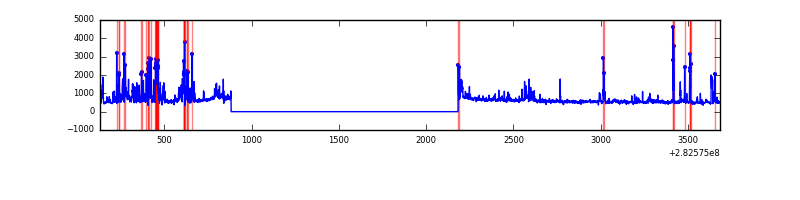 |
Top three noisy pixels from each quadrant. If the there are fewer than three noisy pixels in the level2.evt file, extra rows are filled as -1
| Pixel properties | Quadrant properties | ||||||
|---|---|---|---|---|---|---|---|
| Quadrant | DetID | PixID | Counts | Sigma | Mean | Median | Sigma |
| A | 0 | 226 | 2963 | 38.8 | 332 | 325 | 68.0 |
| A | 12 | 194 | 2526 | 32.37 | 332 | 325 | 68.0 |
| A | 3 | 137 | 2235 | 28.09 | 332 | 325 | 68.0 |
| B | 0 | 189 | 17008 | 263.6 | 326 | 319 | 63.3 |
| B | 12 | 111 | 7019 | 105.82 | 326 | 319 | 63.3 |
| B | 11 | 111 | 6235 | 93.44 | 326 | 319 | 63.3 |
| C | 14 | 238 | 49217 | 675.7 | 309 | 310 | 72.4 |
| C | 5 | 218 | 8948 | 119.34 | 309 | 310 | 72.4 |
| C | 3 | 233 | 3587 | 45.27 | 309 | 310 | 72.4 |
| D | 13 | 232 | 237205 | 2994.17 | 315 | 306 | 79.1 |
| D | 13 | 189 | 65768 | 827.38 | 315 | 306 | 79.1 |
| D | 11 | 176 | 50294 | 631.8 | 315 | 306 | 79.1 |
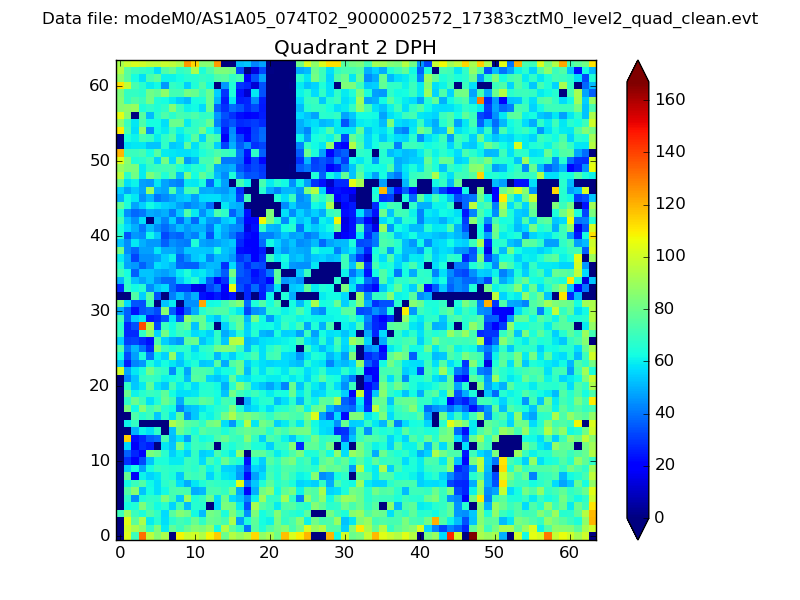
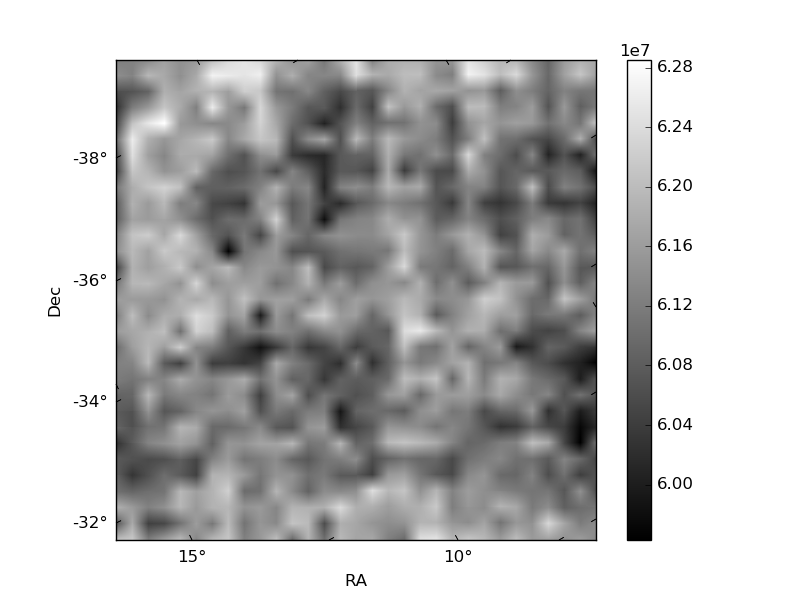
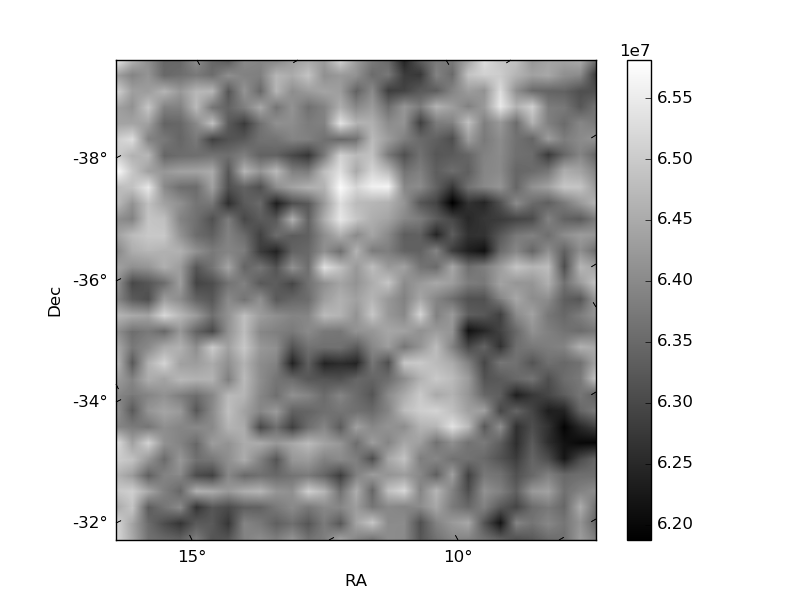
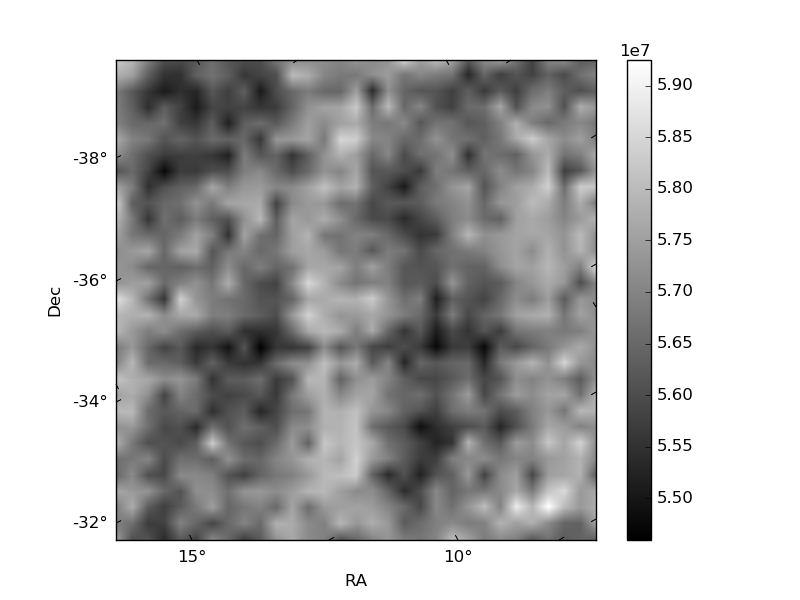
Histogram calculated using DETX and DETY for each event in the final _common_clean file
| Quadrant A | 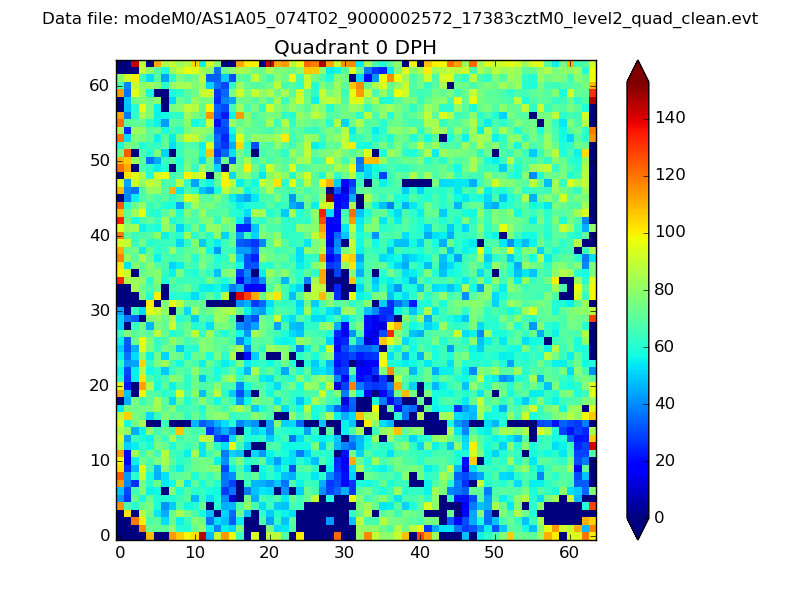 |
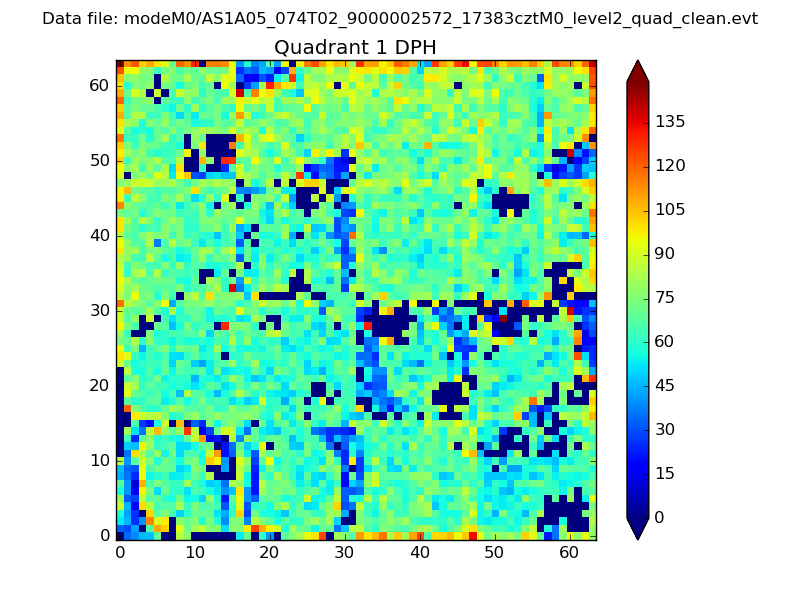 |
Quadrant B |
|---|---|---|---|
| Quadrant D | 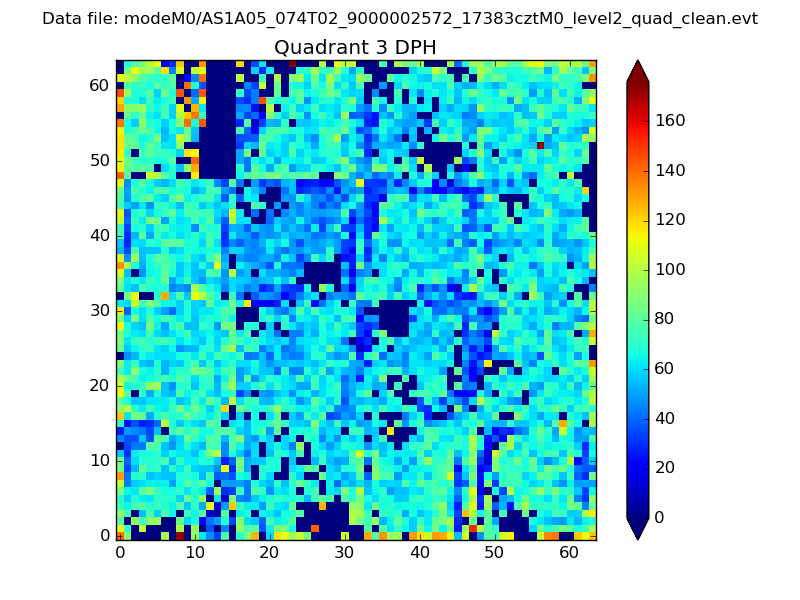 |
 |
Quadrant C |
| Plot type | Count rate plots | Images |
|---|---|---|
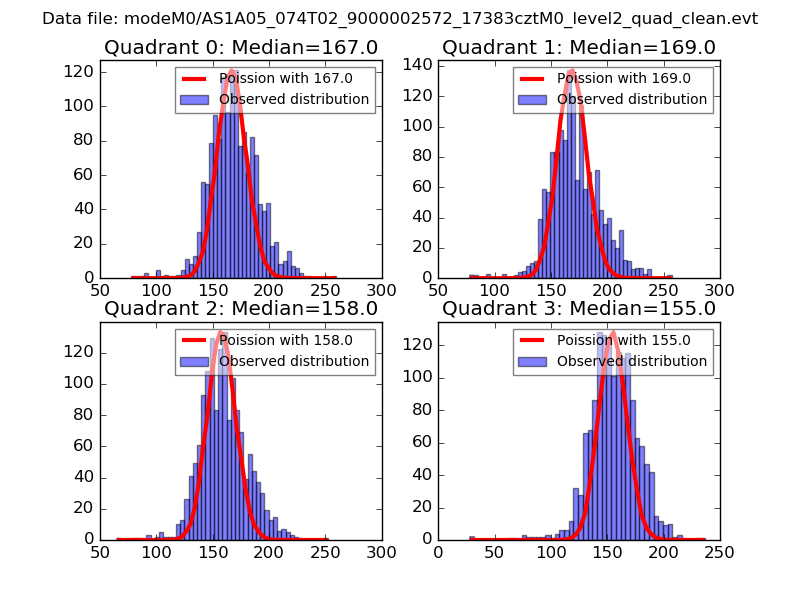
| Comparison with Poisson distribution Blue bars denote a histogram of data divided into 1 sec bins. Red curve is a Poisson curve with rate = median count rate of data. |
 |
 |
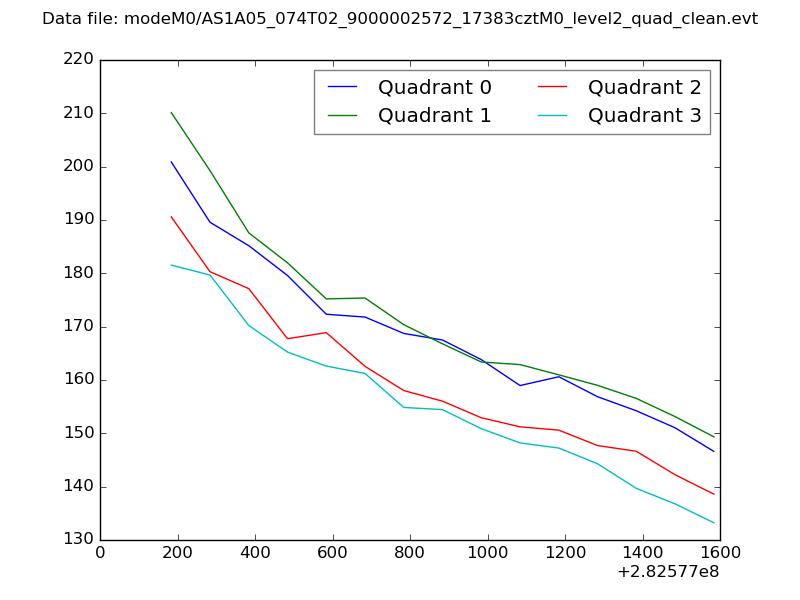
| Quadrant-wise count rates Data is divided into 100 sec bins |
 |
|
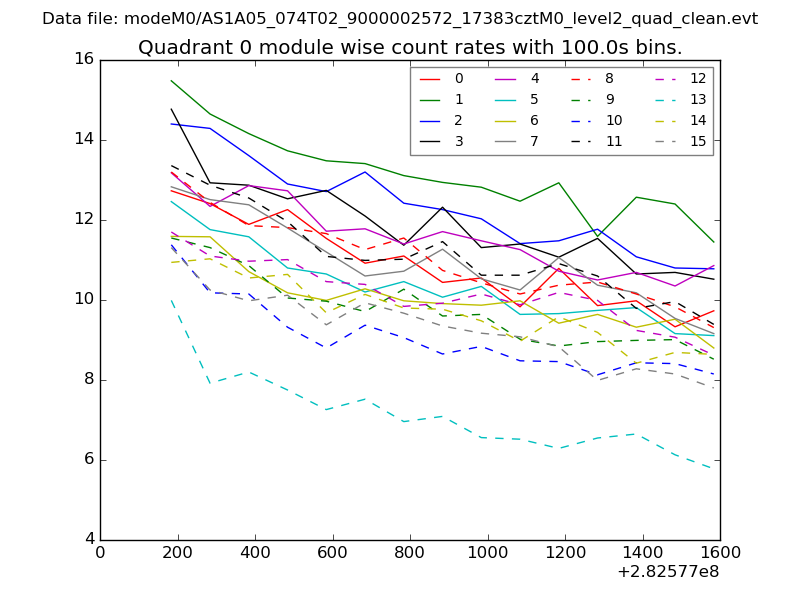
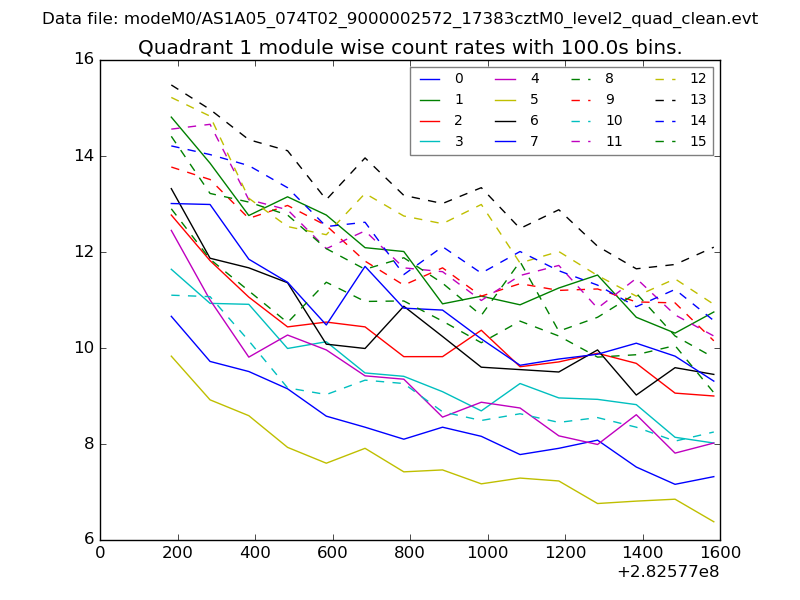
| Module-wise count rates for Quadrant A Data is divided into 100 sec bins |
 |
 |
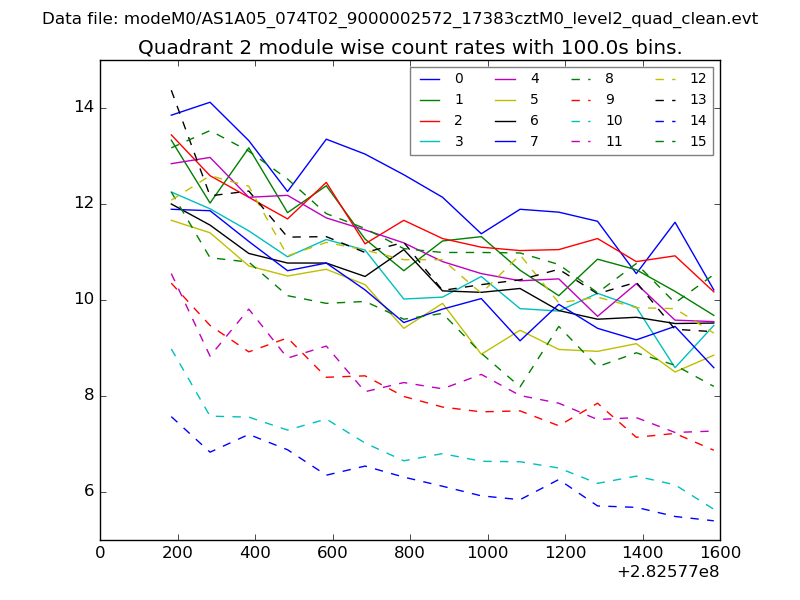
| Module-wise count rates for Quadrant B Data is divided into 100 sec bins |
 |
 |
| Module-wise count rates for Quadrant C Data is divided into 100 sec bins |
 |
 |
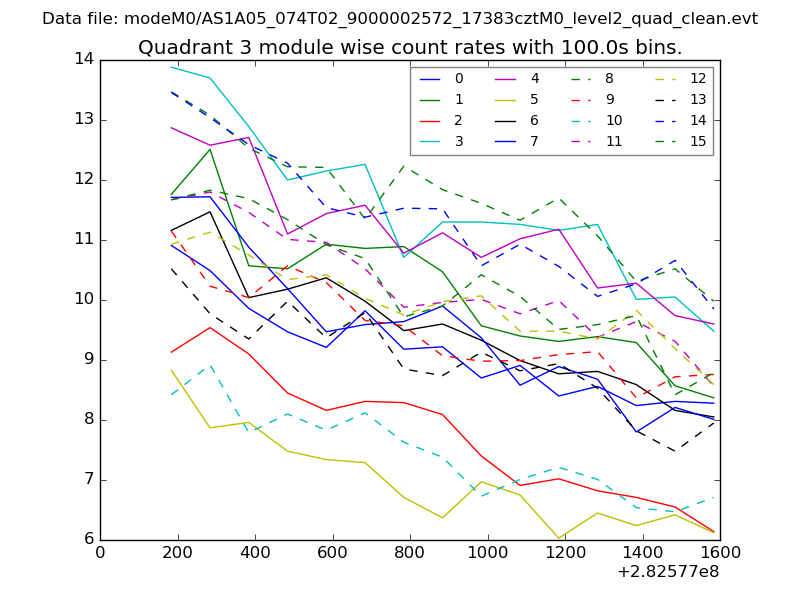
| Module-wise count rates for Quadrant D Data is divided into 100 sec bins |
 |
 |
| Parameter | Plot |
|---|---|
| CZT HV Monitor | 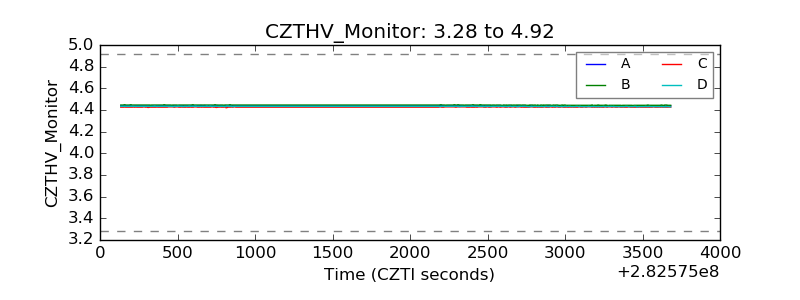 |
| D_VDD | 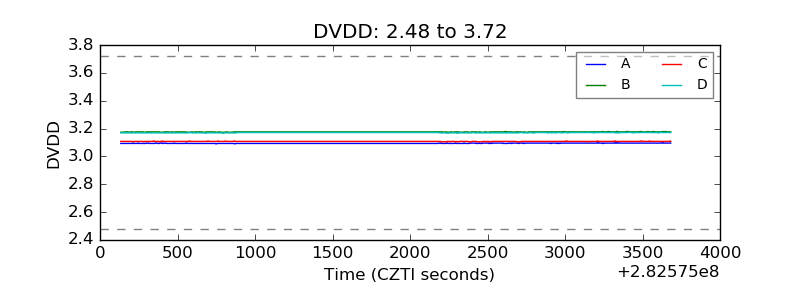 |
| Temperature 1 |  |
| Veto HV Monitor | 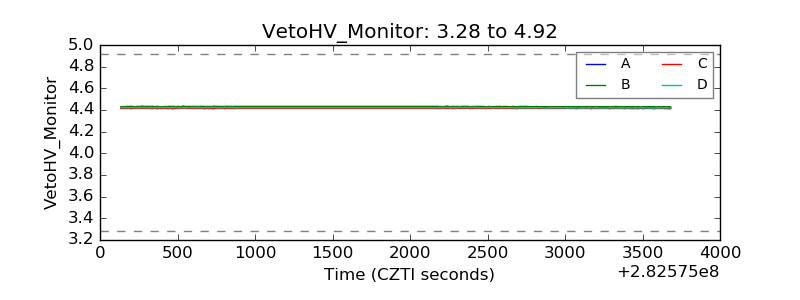 |
| Veto LLD | 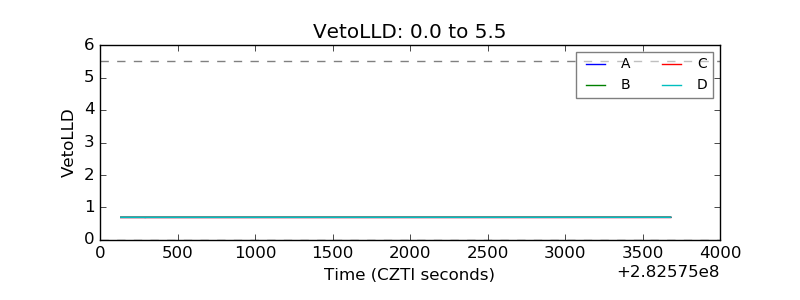 |
| Alpha Counter | 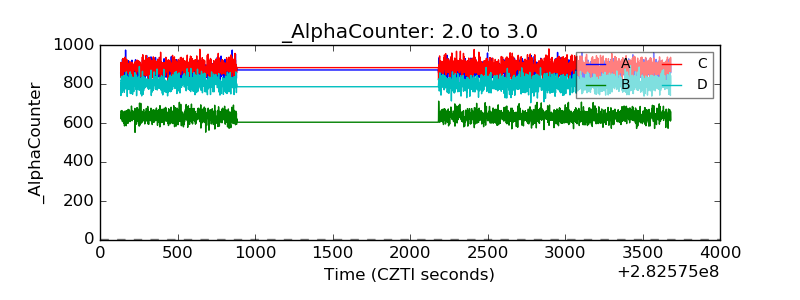 |
| _CPM_Rate | 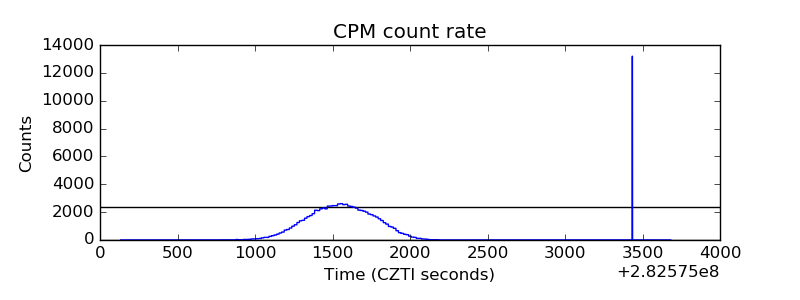 |
| CZT Counter | 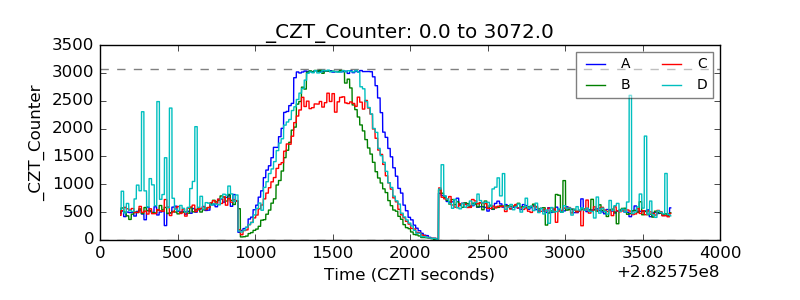 |
| +2.5 Volts monitor |  |
| +5 Volts monitor | 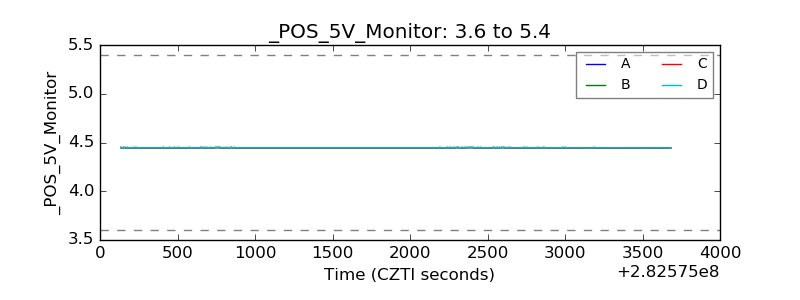 |
| _ROLL_ROT | 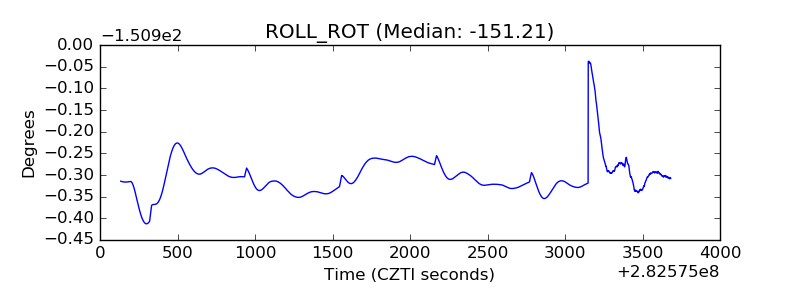 |
| _Roll_DEC | 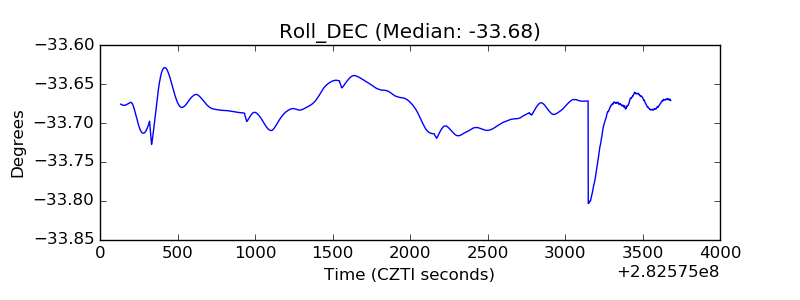 |
| _Roll_RA | 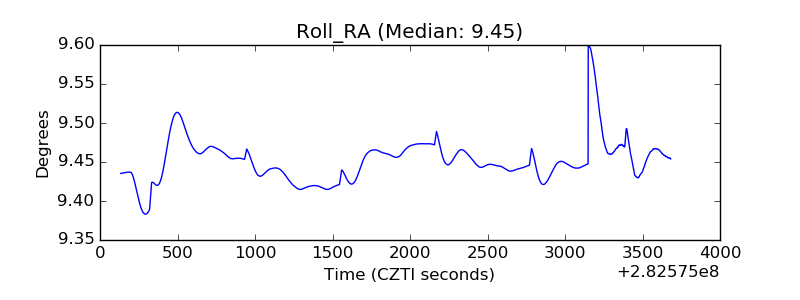 |
| Veto Counter | 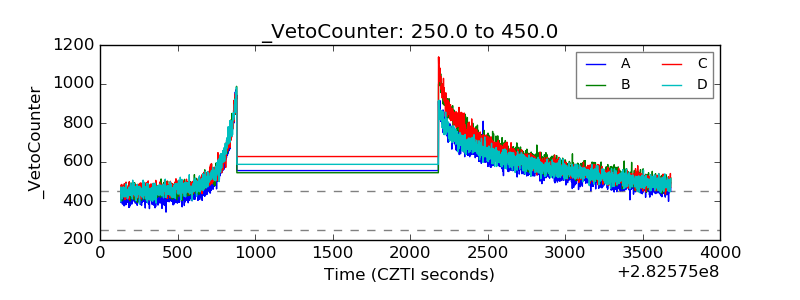 |