| Param | Original file | Final file |
|---|---|---|
| Filename | modeM0/AS1A05_074T02_9000002572_17384cztM0_level2.evt | modeM0/AS1A05_074T02_9000002572_17384cztM0_level2_quad_clean.evt |
| Size (bytes) | 508,259,520 | 105,765,120 |
| Size | 484.7 MB | 100.9 MB |
| Events in quadrant A | 3,198,298 | 720,562 |
| Events in quadrant B | 3,390,139 | 726,853 |
| Events in quadrant C | 3,179,357 | 680,576 |
| Events in quadrant D | 5,197,845 | 635,869 |
| Mode SS | |||
|---|---|---|---|
| Quadrant | BADHDUFLAG | Total packets | Discarded packets |
| A | 0 | 128 | 0 |
| B | 0 | 128 | 0 |
| C | 0 | 128 | 0 |
| D | 0 | 128 | 0 |
| Mode M9 | |||
|---|---|---|---|
| Quadrant | BADHDUFLAG | Total packets | Discarded packets |
| A | 0 | 13 | 0 |
| B | 0 | 13 | 0 |
| C | 0 | 13 | 0 |
| D | 0 | 13 | 0 |
| Mode M0 | |||
|---|---|---|---|
| Quadrant | BADHDUFLAG | Total packets | Discarded packets |
| A | 0 | 13517 | 1 |
| B | 0 | 14136 | 1 |
| C | 0 | 13339 | 1 |
| D | 0 | 19579 | 1 |
| Quadrant | Total seconds | Saturated seconds | Saturation percentage |
|---|---|---|---|
| A | 6292 | 109 | 1.732359% |
| B | 6292 | 118 | 1.875397% |
| C | 6292 | 102 | 1.621106% |
| D | 6293 | 547 | 8.692198% |
Noise dominated data is calculated using 1-second bins in cleaned event files. If a bin has >2000 counts, and if more than 50% of those come from <1% of pixels, then it is considered to be noise-dominated and hence unusable.
| Quadrant | # 1 sec bins | Bins with >0 counts | Bins with >2000 counts | High rate bins dominated by noise | Noise dominated (total time) | Noise dominated (detector-on time) | Marked lightcurve |
|---|---|---|---|---|---|---|---|
| A | 7592 | 6293 | 0 | 0 | 0.00% | 0.00% | 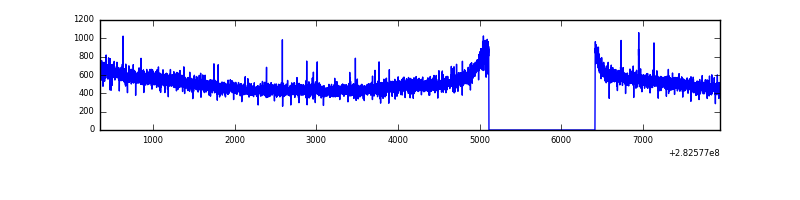 |
| B | 7592 | 6293 | 5 | 5 | 0.07% | 0.08% | 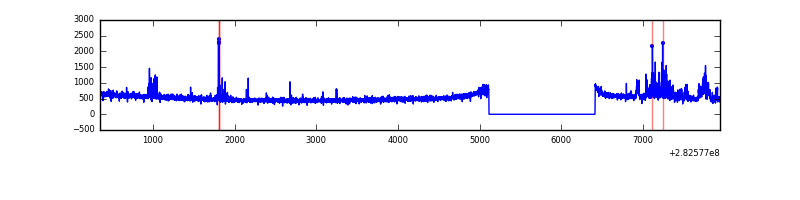 |
| C | 7592 | 6293 | 0 | 0 | 0.00% | 0.00% | 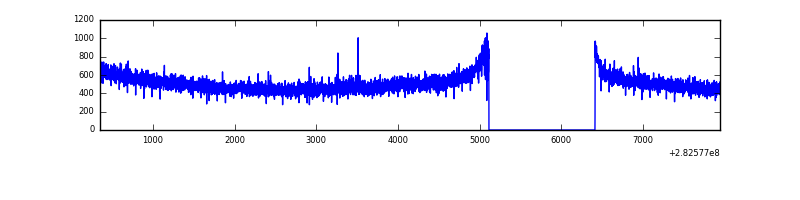 |
| D | 7593 | 6294 | 386 | 386 | 5.08% | 6.13% | 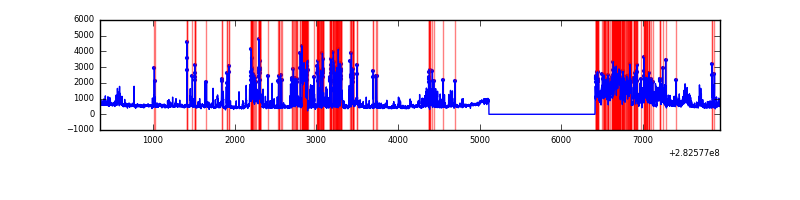 |
Top three noisy pixels from each quadrant. If the there are fewer than three noisy pixels in the level2.evt file, extra rows are filled as -1
| Pixel properties | Quadrant properties | ||||||
|---|---|---|---|---|---|---|---|
| Quadrant | DetID | PixID | Counts | Sigma | Mean | Median | Sigma |
| A | 0 | 226 | 7546 | 40.93 | 829 | 815 | 164.4 |
| A | 12 | 194 | 6109 | 32.19 | 829 | 815 | 164.4 |
| A | 13 | 210 | 5810 | 30.38 | 829 | 815 | 164.4 |
| B | 7 | 220 | 78247 | 506.45 | 820 | 803 | 152.9 |
| B | 15 | 35 | 59557 | 384.23 | 820 | 803 | 152.9 |
| B | 0 | 189 | 32117 | 204.78 | 820 | 803 | 152.9 |
| C | 14 | 238 | 122020 | 680.27 | 773 | 779 | 178.2 |
| C | 5 | 218 | 27966 | 152.54 | 773 | 779 | 178.2 |
| C | 3 | 233 | 17025 | 91.15 | 773 | 779 | 178.2 |
| D | 13 | 232 | 927895 | 4989.66 | 768 | 748 | 185.8 |
| D | 11 | 176 | 803028 | 4317.66 | 768 | 748 | 185.8 |
| D | 10 | 70 | 347092 | 1863.93 | 768 | 748 | 185.8 |
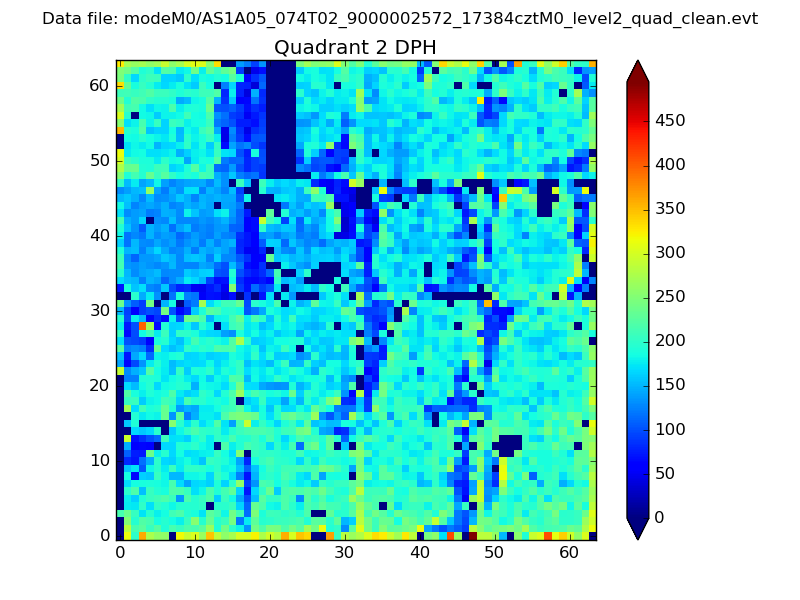
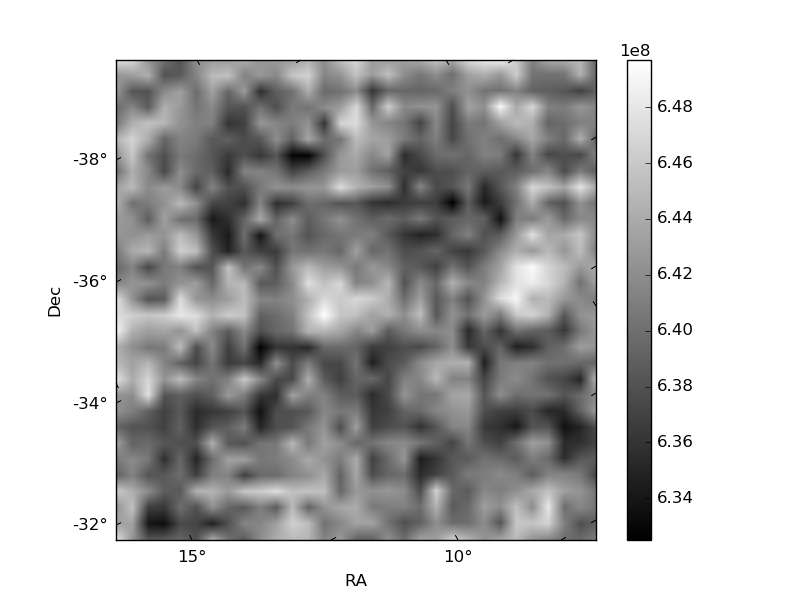
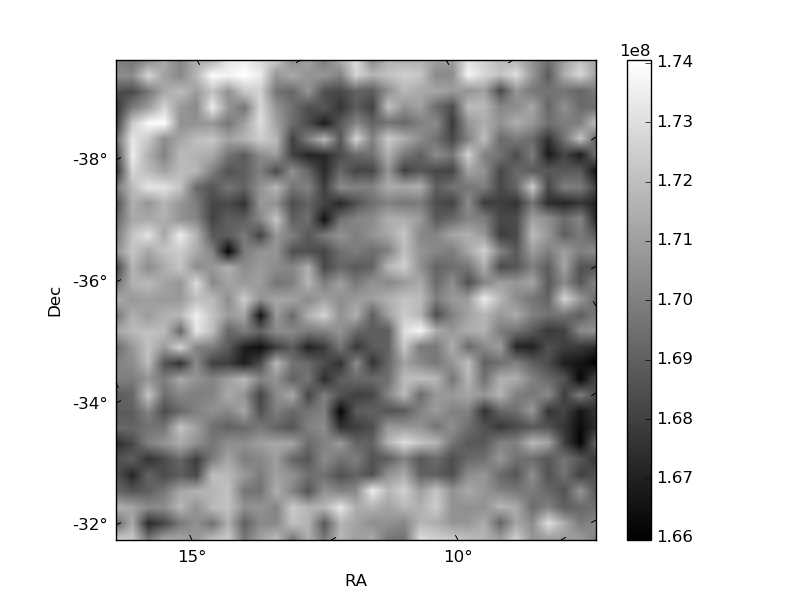
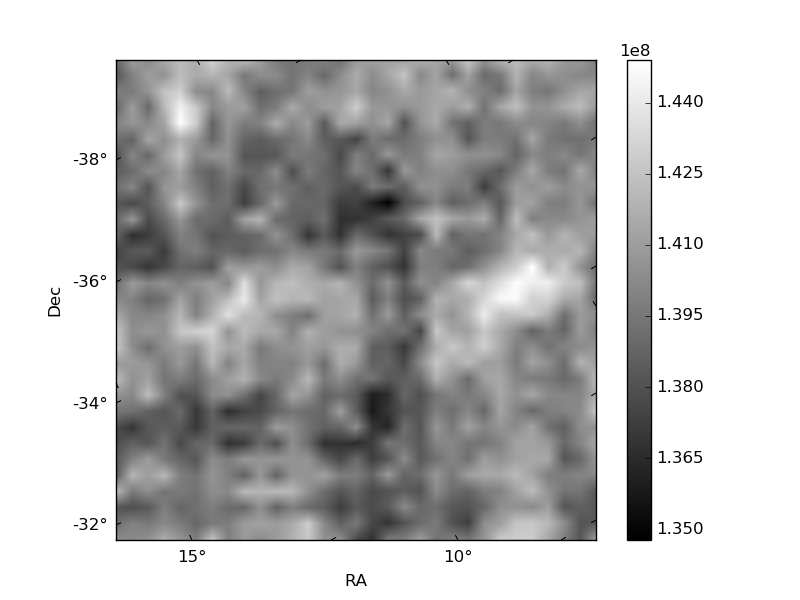
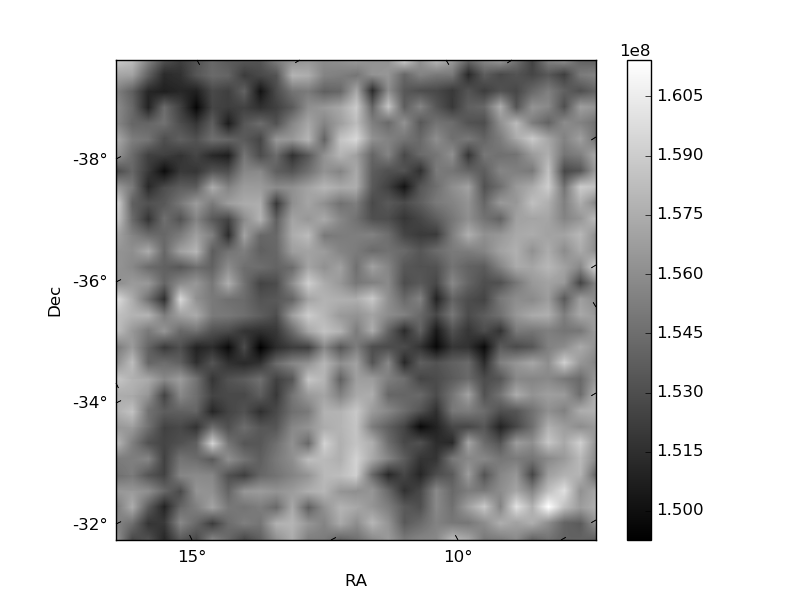
Histogram calculated using DETX and DETY for each event in the final _common_clean file
| Quadrant A | 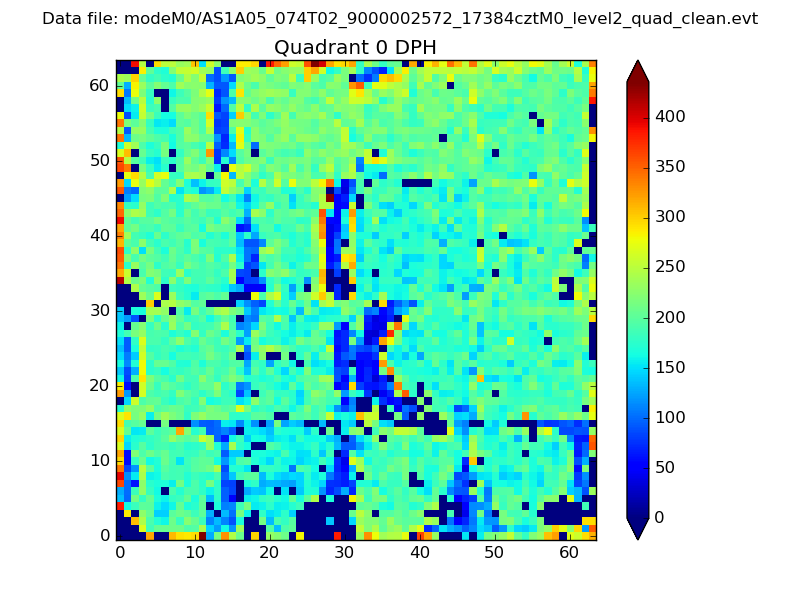 |
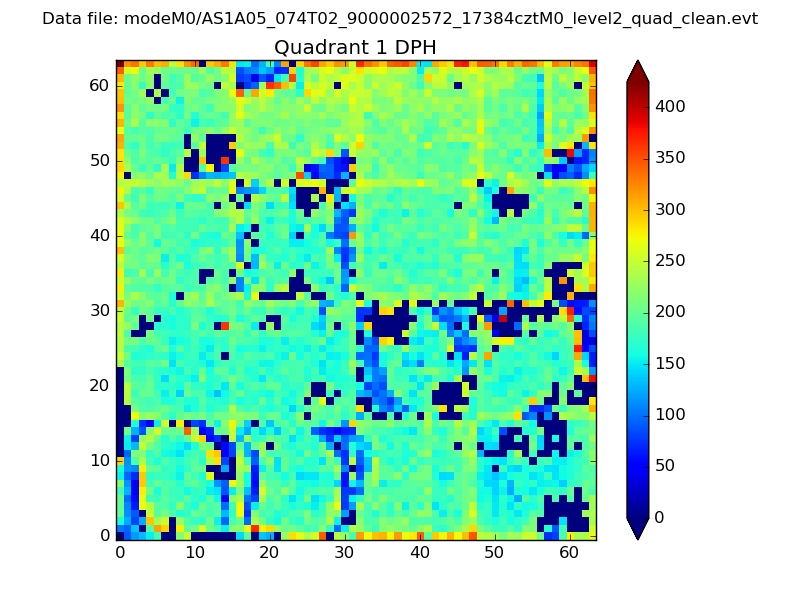 |
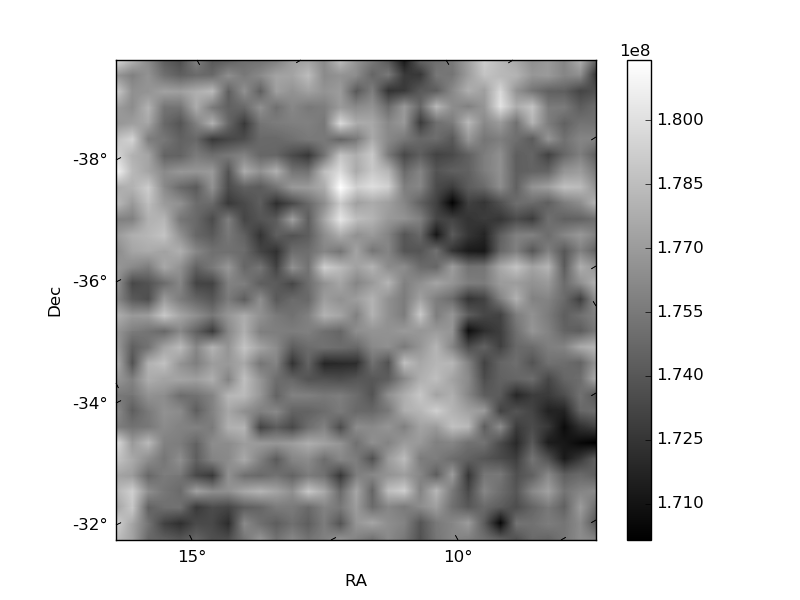
Quadrant B |
|---|---|---|---|
| Quadrant D | 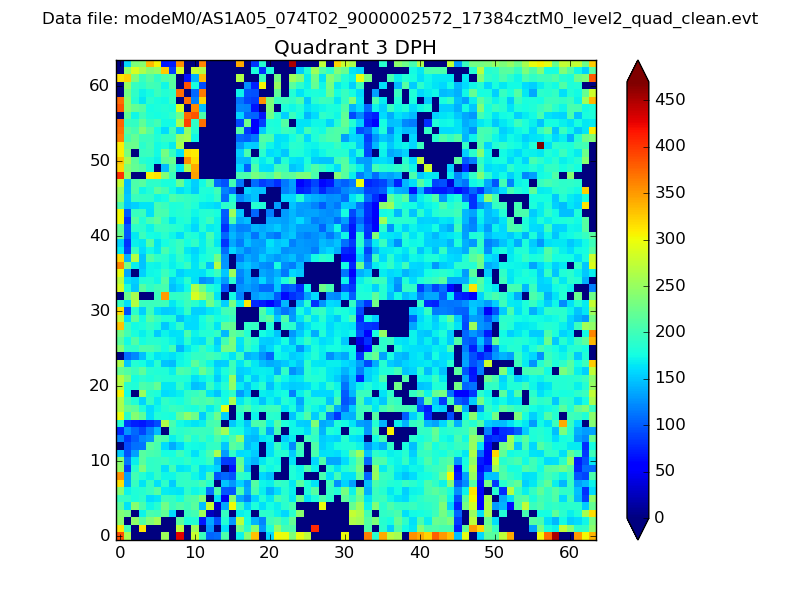 |
 |
Quadrant C |
| Plot type | Count rate plots | Images |
|---|---|---|
| Comparison with Poisson distribution Blue bars denote a histogram of data divided into 1 sec bins. Red curve is a Poisson curve with rate = median count rate of data. |
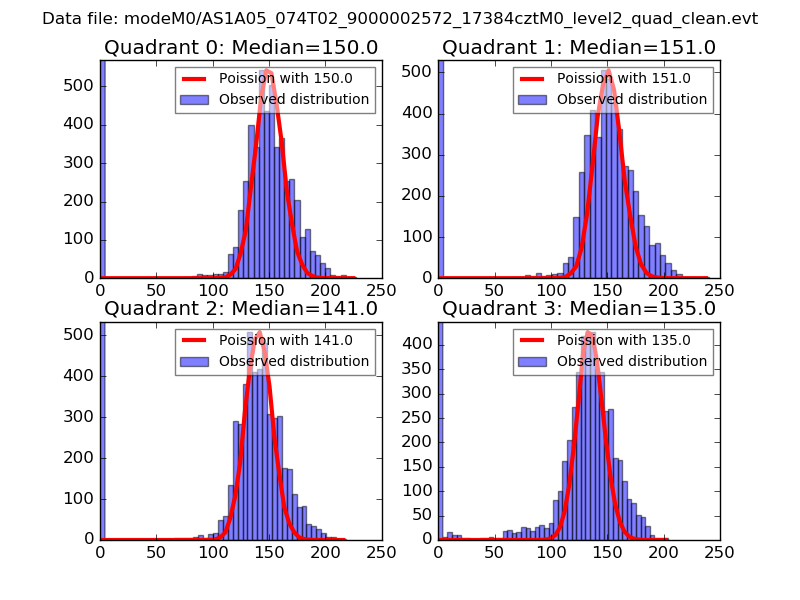 |
 |
| Quadrant-wise count rates Data is divided into 100 sec bins |
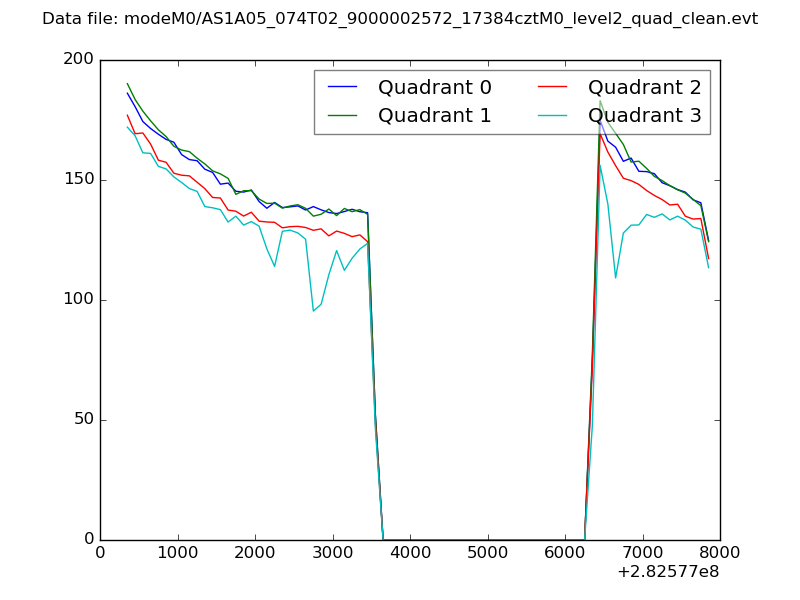 |
|
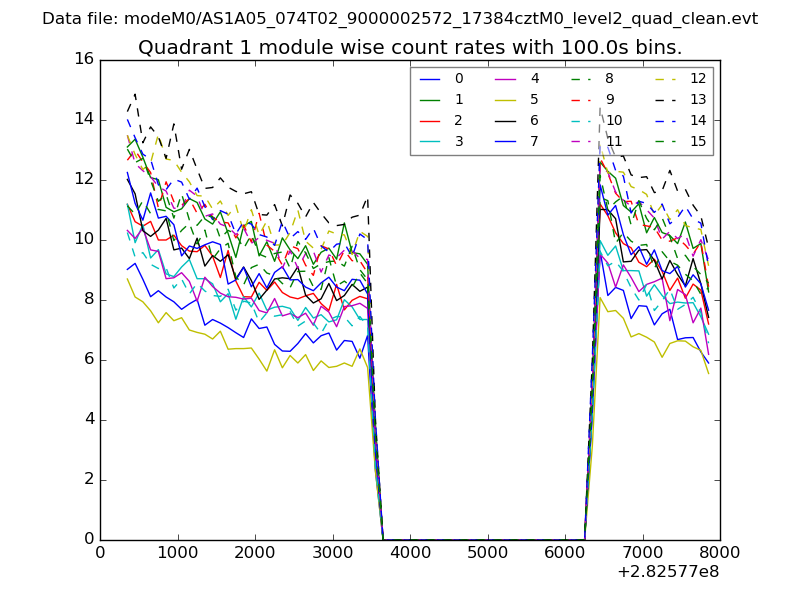
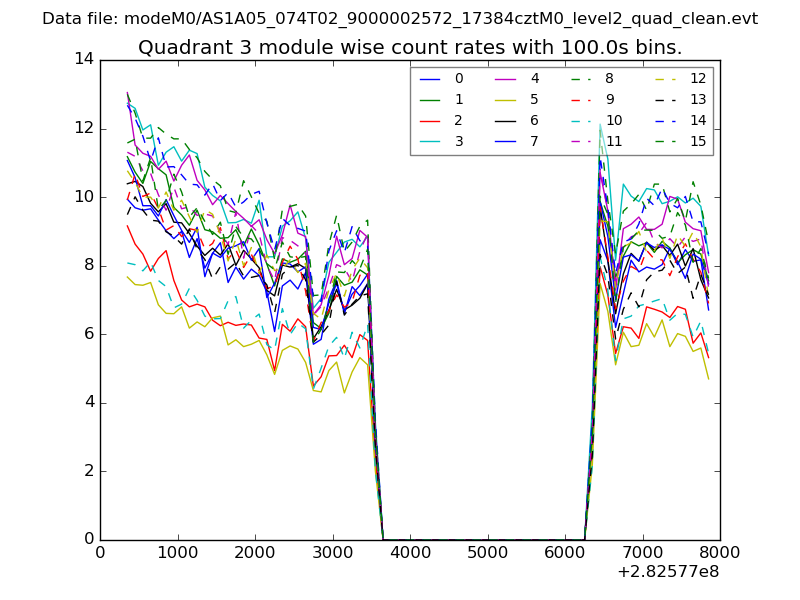
| Module-wise count rates for Quadrant A Data is divided into 100 sec bins |
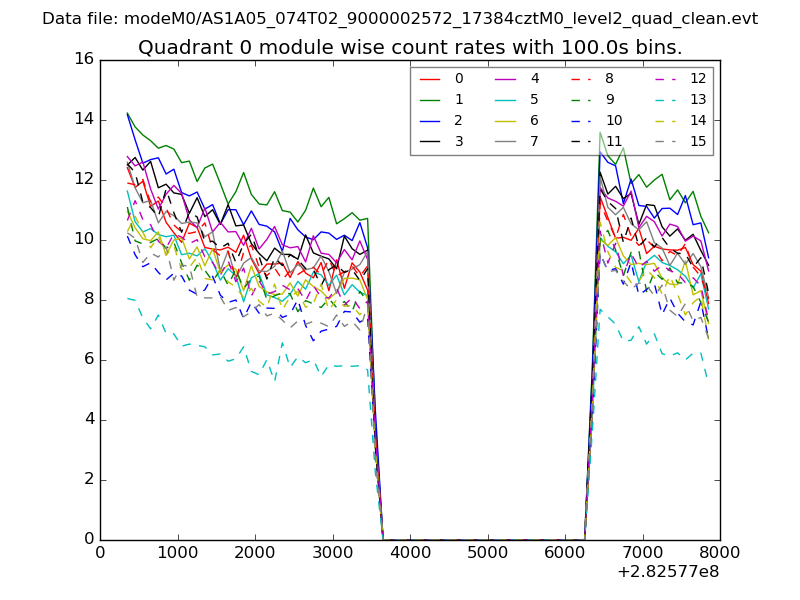 |
 |
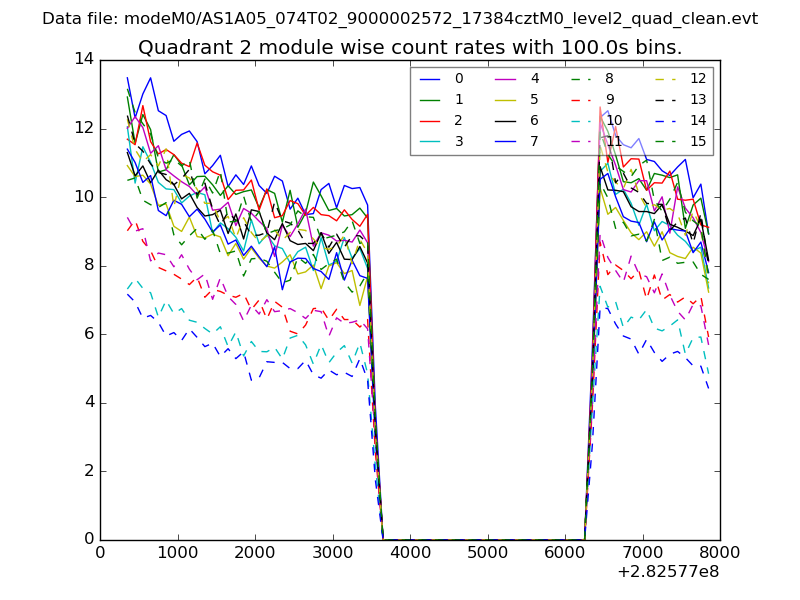
| Module-wise count rates for Quadrant B Data is divided into 100 sec bins |
 |
 |
| Module-wise count rates for Quadrant C Data is divided into 100 sec bins |
 |
 |
| Module-wise count rates for Quadrant D Data is divided into 100 sec bins |
 |
 |
| Parameter | Plot |
|---|---|
| CZT HV Monitor | 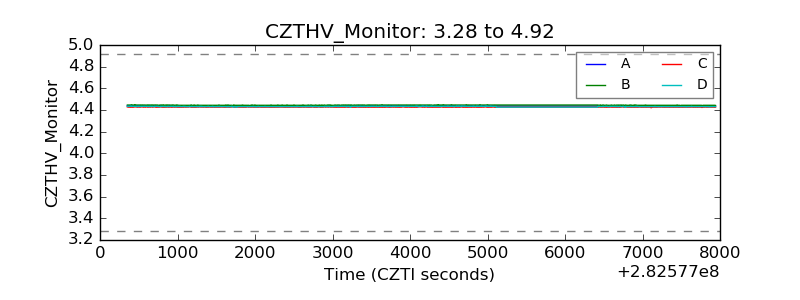 |
| D_VDD | 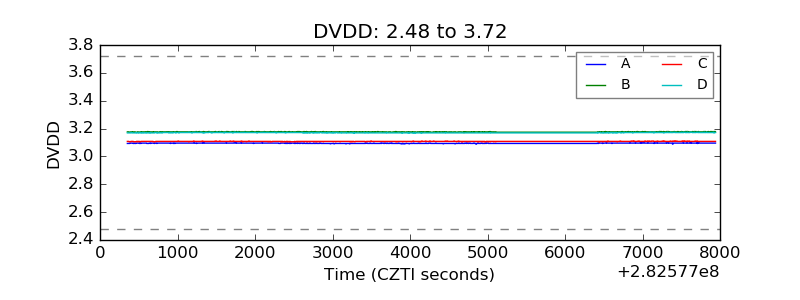 |
| Temperature 1 | 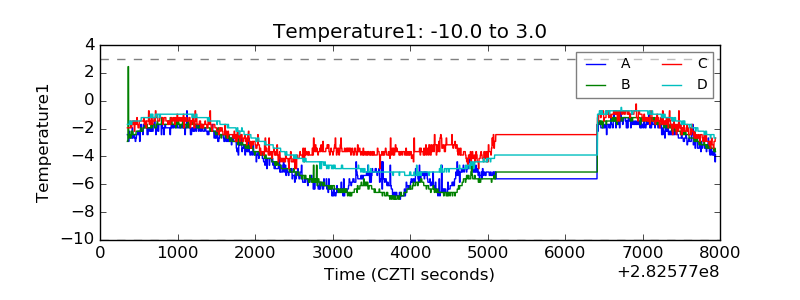 |
| Veto HV Monitor | 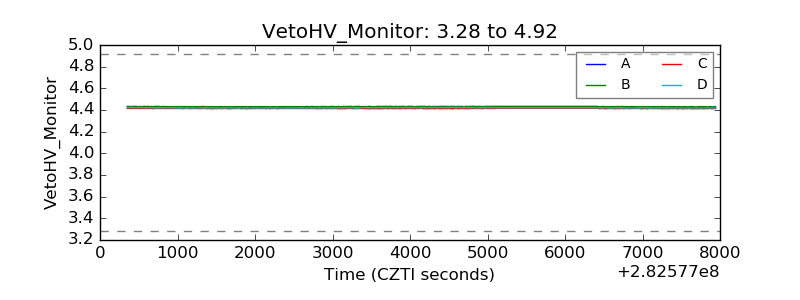 |
| Veto LLD | 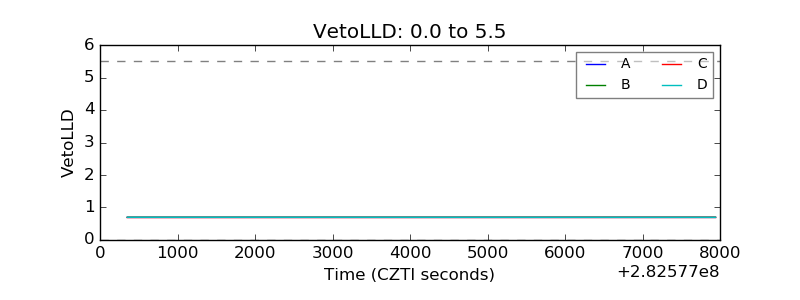 |
| Alpha Counter | 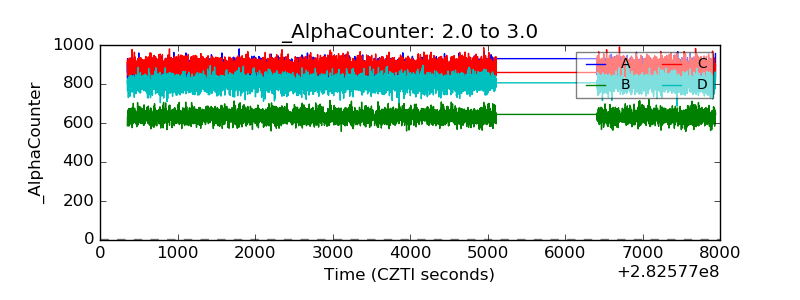 |
| _CPM_Rate | 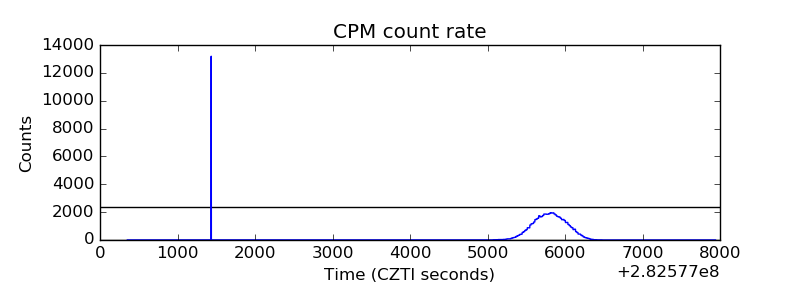 |
| CZT Counter | 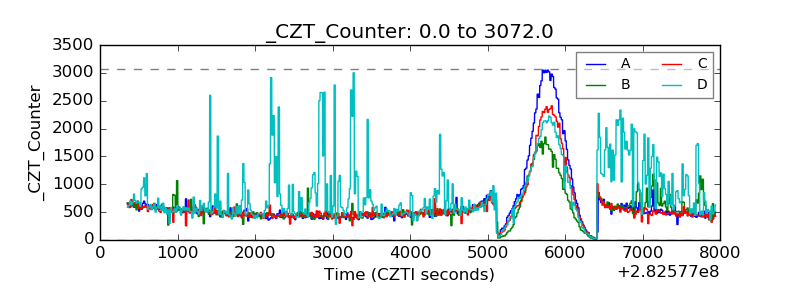 |
| +2.5 Volts monitor | 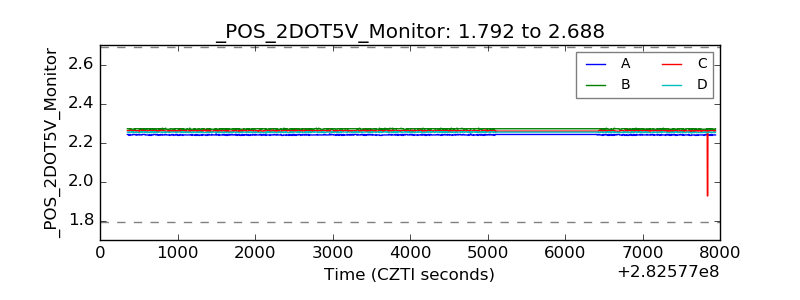 |
| +5 Volts monitor |  |
| _ROLL_ROT | 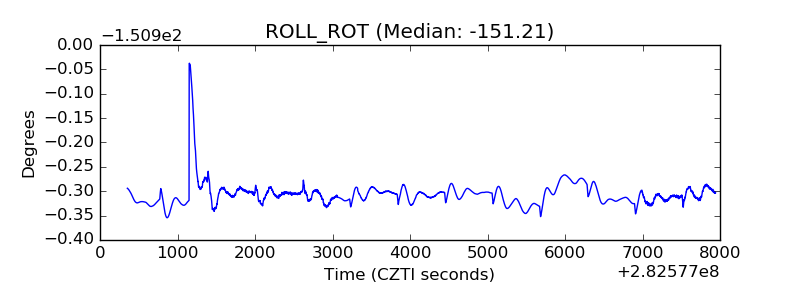 |
| _Roll_DEC | 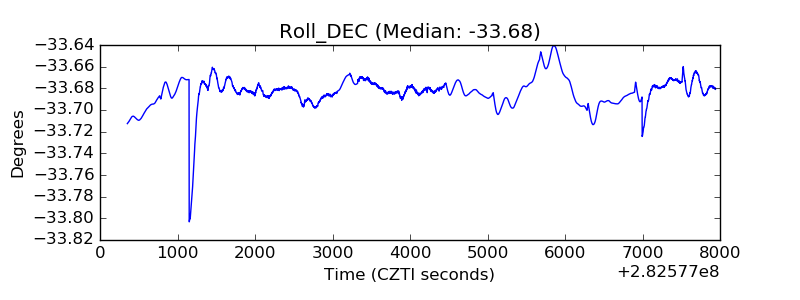 |
| _Roll_RA | 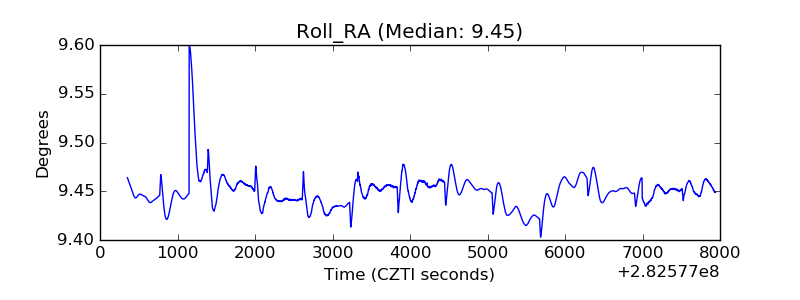 |
| Veto Counter | 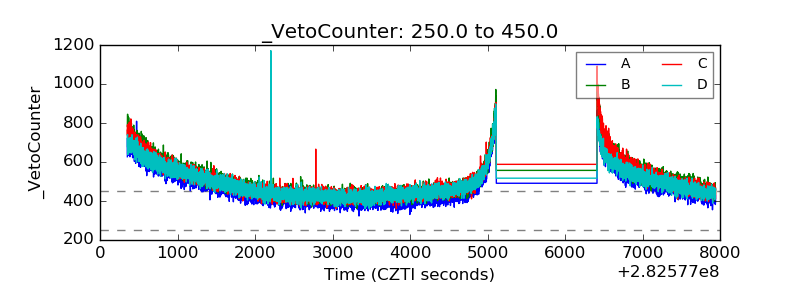 |