| Param | Original file | Final file |
|---|---|---|
| Filename | modeM0/AS1A05_074T02_9000002572_17386cztM0_level2.evt | modeM0/AS1A05_074T02_9000002572_17386cztM0_level2_quad_clean.evt |
| Size (bytes) | 483,079,680 | 92,880,000 |
| Size | 460.7 MB | 88.6 MB |
| Events in quadrant A | 3,108,289 | 605,214 |
| Events in quadrant B | 3,708,411 | 606,277 |
| Events in quadrant C | 3,127,016 | 578,835 |
| Events in quadrant D | 4,234,430 | 558,418 |
| Mode SS | |||
|---|---|---|---|
| Quadrant | BADHDUFLAG | Total packets | Discarded packets |
| A | 0 | 134 | 0 |
| B | 0 | 134 | 0 |
| C | 0 | 134 | 0 |
| D | 0 | 134 | 0 |
| Mode M9 | |||
|---|---|---|---|
| Quadrant | BADHDUFLAG | Total packets | Discarded packets |
| A | 0 | 14 | 0 |
| B | 0 | 15 | 0 |
| C | 0 | 15 | 0 |
| D | 0 | 15 | 0 |
| Mode M0 | |||
|---|---|---|---|
| Quadrant | BADHDUFLAG | Total packets | Discarded packets |
| A | 0 | 13735 | 2 |
| B | 0 | 15393 | 2 |
| C | 0 | 13745 | 2 |
| D | 0 | 17072 | 2 |
| Quadrant | Total seconds | Saturated seconds | Saturation percentage |
|---|---|---|---|
| A | 6657 | 21 | 0.315457% |
| B | 6657 | 175 | 2.628812% |
| C | 6657 | 53 | 0.796154% |
| D | 6657 | 219 | 3.289770% |
Noise dominated data is calculated using 1-second bins in cleaned event files. If a bin has >2000 counts, and if more than 50% of those come from <1% of pixels, then it is considered to be noise-dominated and hence unusable.
| Quadrant | # 1 sec bins | Bins with >0 counts | Bins with >2000 counts | High rate bins dominated by noise | Noise dominated (total time) | Noise dominated (detector-on time) | Marked lightcurve |
|---|---|---|---|---|---|---|---|
| A | 7607 | 6658 | 0 | 0 | 0.00% | 0.00% | 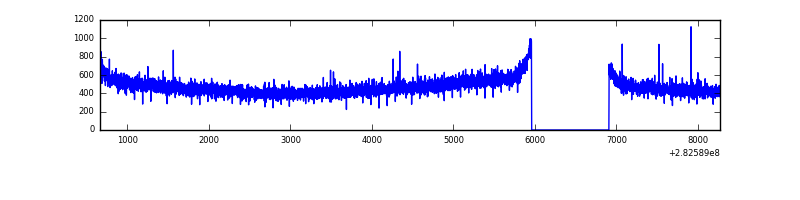 |
| B | 7607 | 6658 | 84 | 84 | 1.10% | 1.26% | 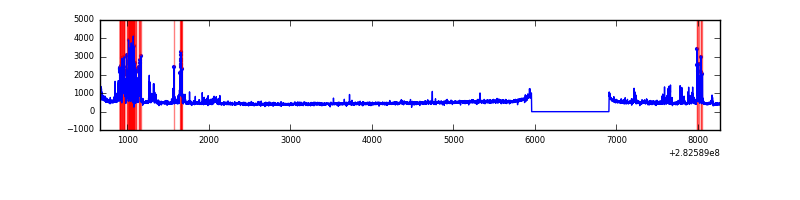 |
| C | 7607 | 6658 | 1 | 1 | 0.01% | 0.02% |  |
| D | 7607 | 6658 | 189 | 189 | 2.48% | 2.84% | 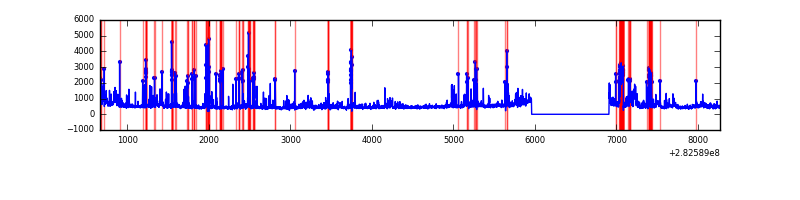 |
Top three noisy pixels from each quadrant. If the there are fewer than three noisy pixels in the level2.evt file, extra rows are filled as -1
| Pixel properties | Quadrant properties | ||||||
|---|---|---|---|---|---|---|---|
| Quadrant | DetID | PixID | Counts | Sigma | Mean | Median | Sigma |
| A | 0 | 226 | 7165 | 38.66 | 808 | 792 | 164.8 |
| A | 12 | 194 | 6049 | 31.89 | 808 | 792 | 164.8 |
| A | 3 | 137 | 5761 | 30.14 | 808 | 792 | 164.8 |
| B | 4 | 216 | 324989 | 2095.34 | 806 | 787 | 154.7 |
| B | 0 | 197 | 72889 | 466.0 | 806 | 787 | 154.7 |
| B | 15 | 35 | 52525 | 334.39 | 806 | 787 | 154.7 |
| C | 14 | 238 | 119487 | 662.01 | 764 | 767 | 179.3 |
| C | 3 | 233 | 17714 | 94.5 | 764 | 767 | 179.3 |
| C | 13 | 61 | 5606 | 26.98 | 764 | 767 | 179.3 |
| D | 11 | 176 | 442723 | 2383.75 | 763 | 741 | 185.4 |
| D | 13 | 189 | 311305 | 1674.97 | 763 | 741 | 185.4 |
| D | 1 | 52 | 200938 | 1079.73 | 763 | 741 | 185.4 |
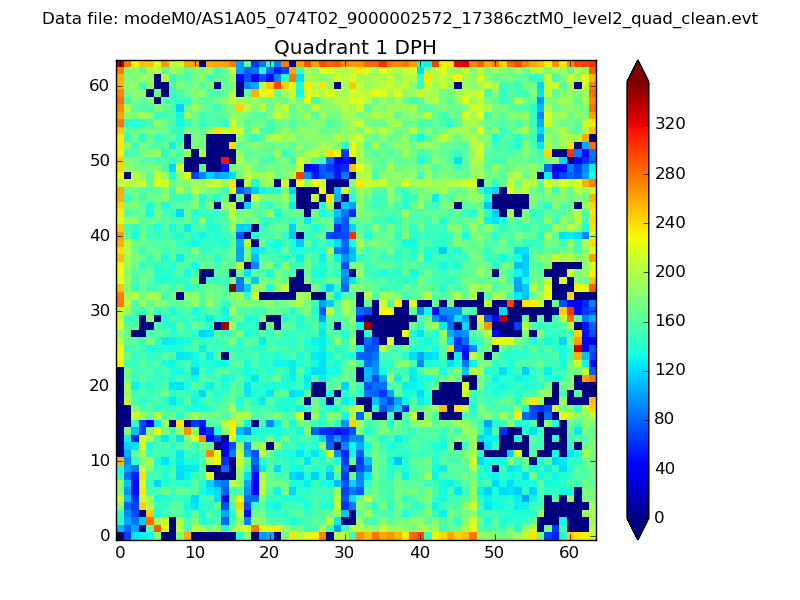
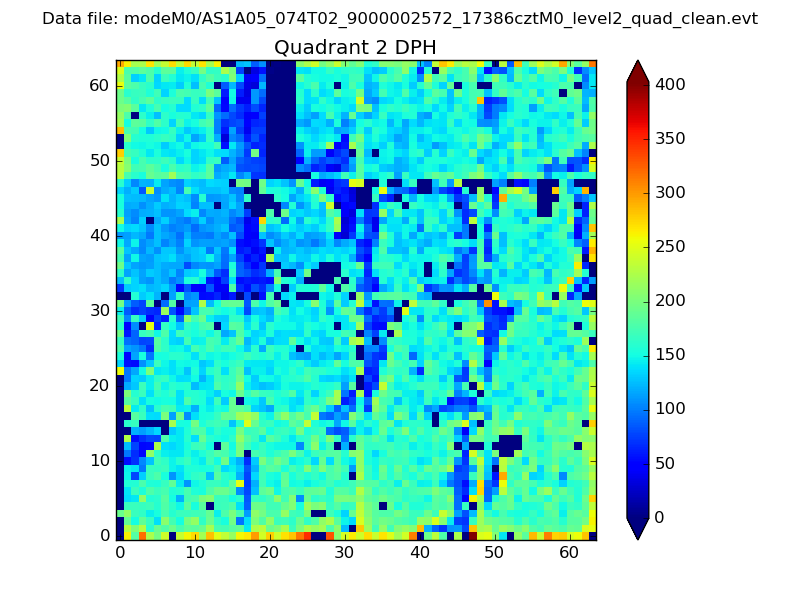
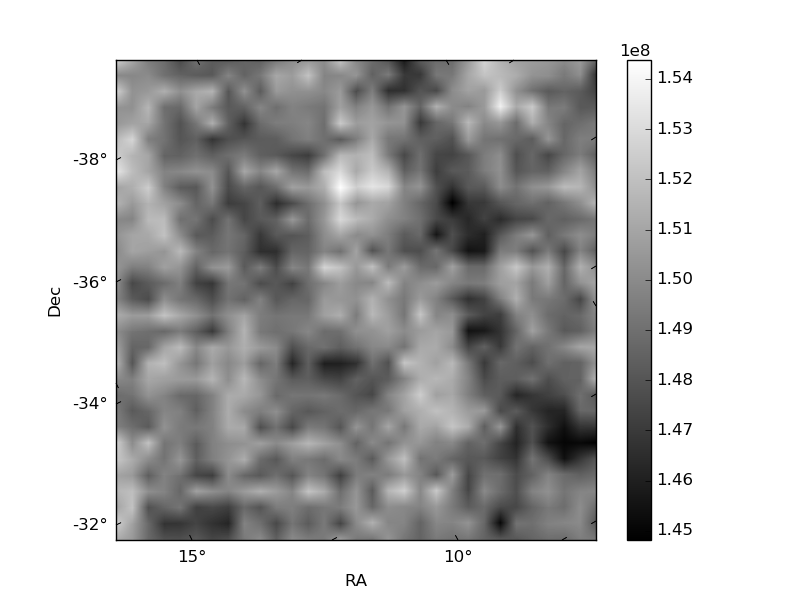
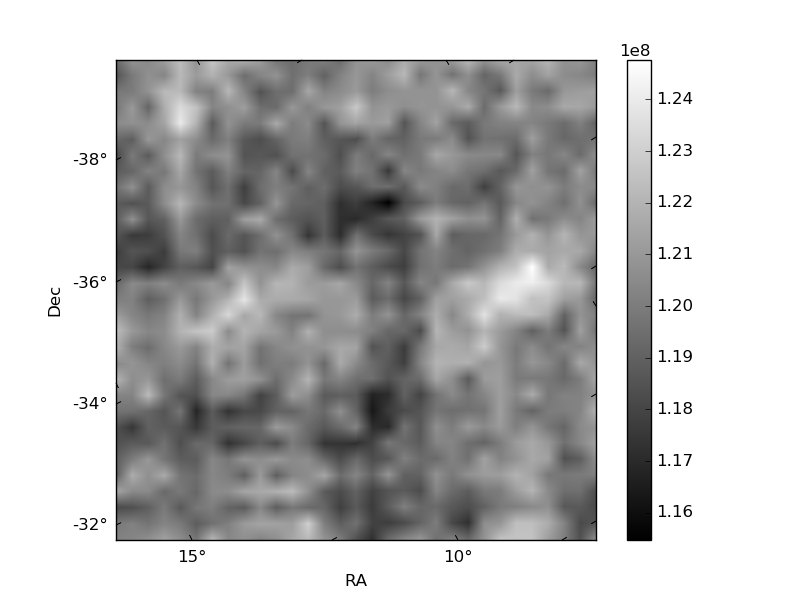
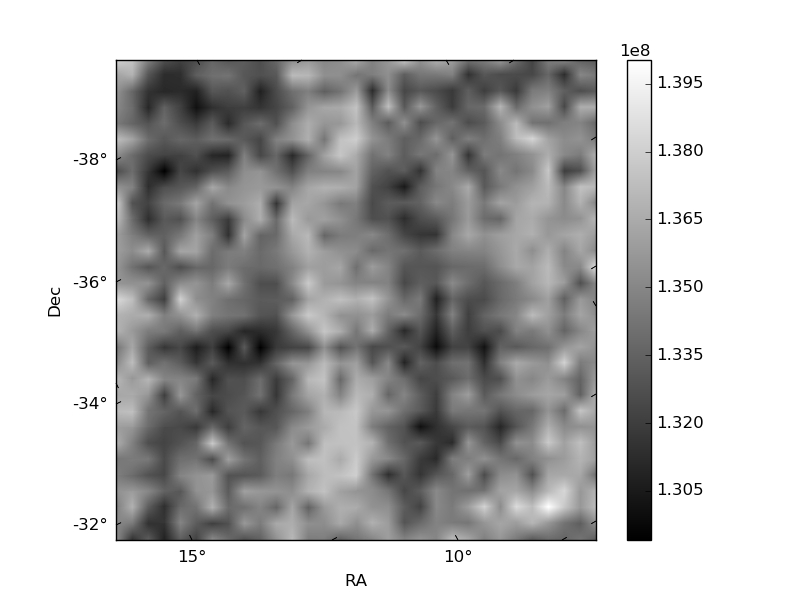
Histogram calculated using DETX and DETY for each event in the final _common_clean file
| Quadrant A | 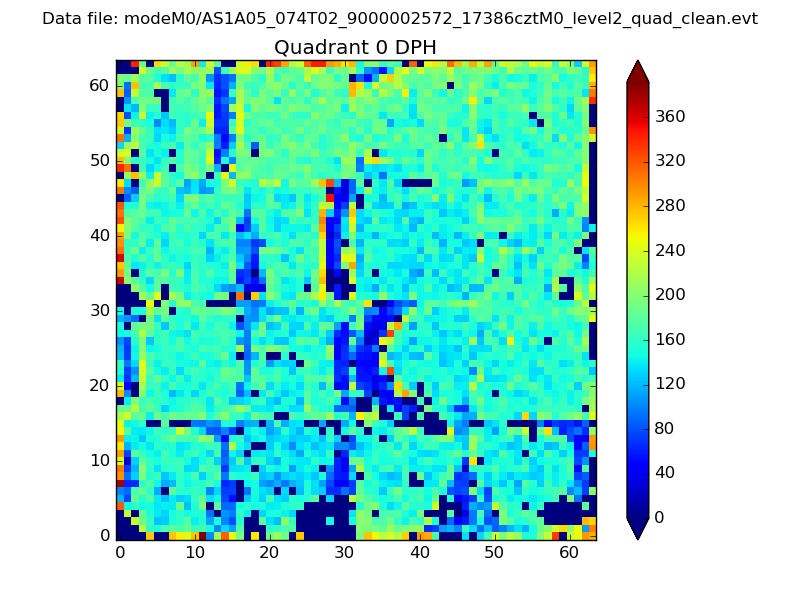 |
 |
Quadrant B |
|---|---|---|---|
| Quadrant D | 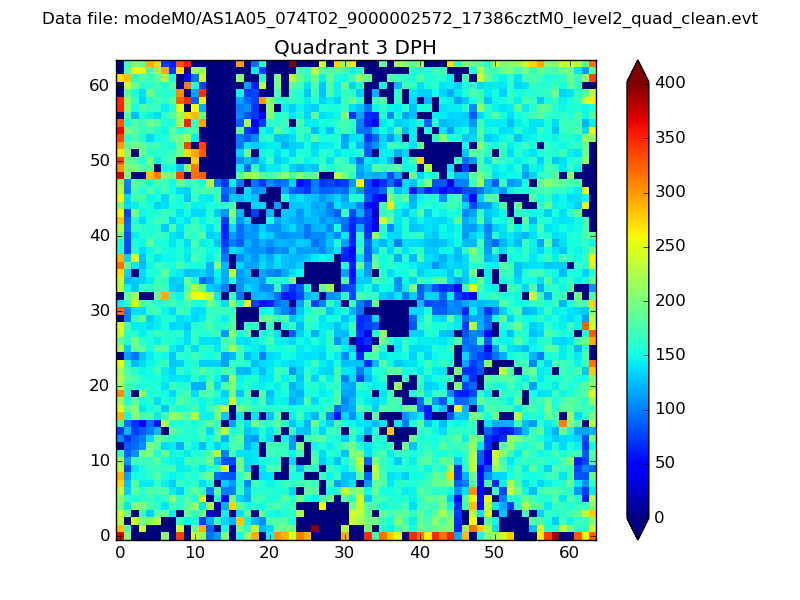 |
 |
Quadrant C |
| Plot type | Count rate plots | Images |
|---|---|---|
| Comparison with Poisson distribution Blue bars denote a histogram of data divided into 1 sec bins. Red curve is a Poisson curve with rate = median count rate of data. |
 |
 |
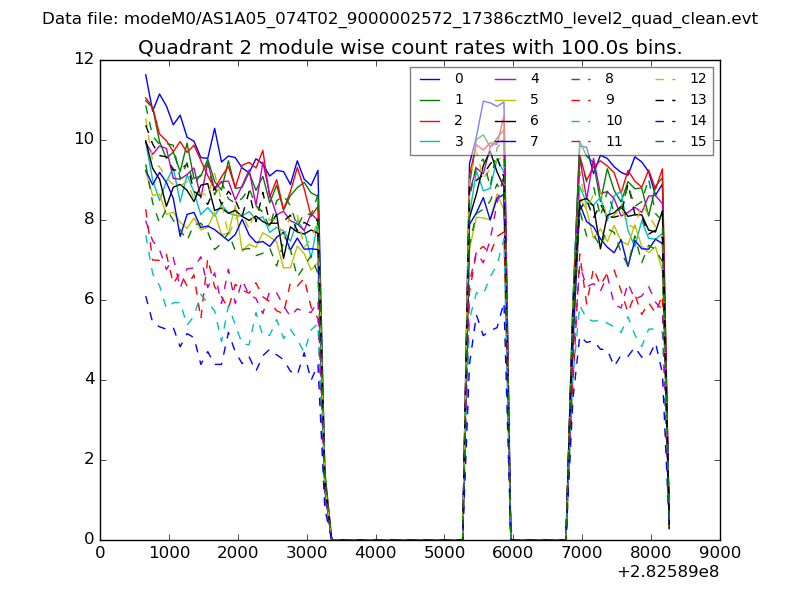
| Quadrant-wise count rates Data is divided into 100 sec bins |
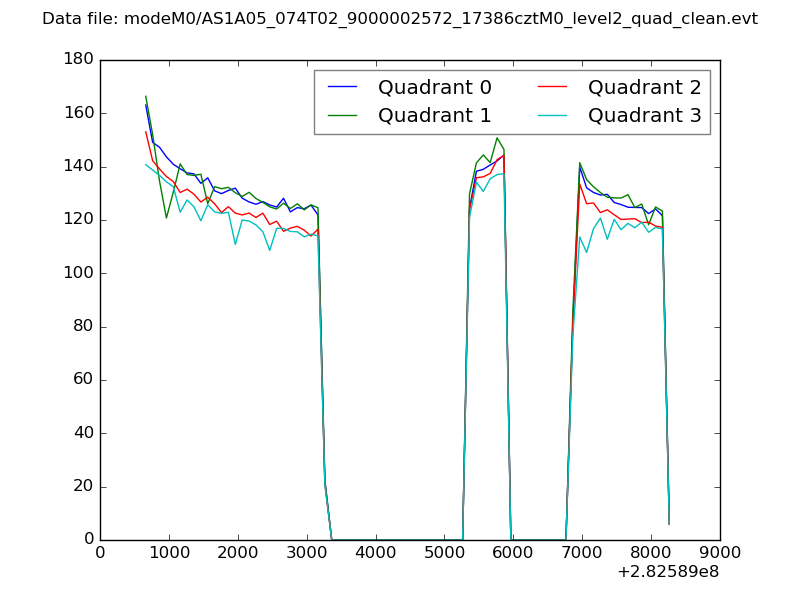 |
|
| Module-wise count rates for Quadrant A Data is divided into 100 sec bins |
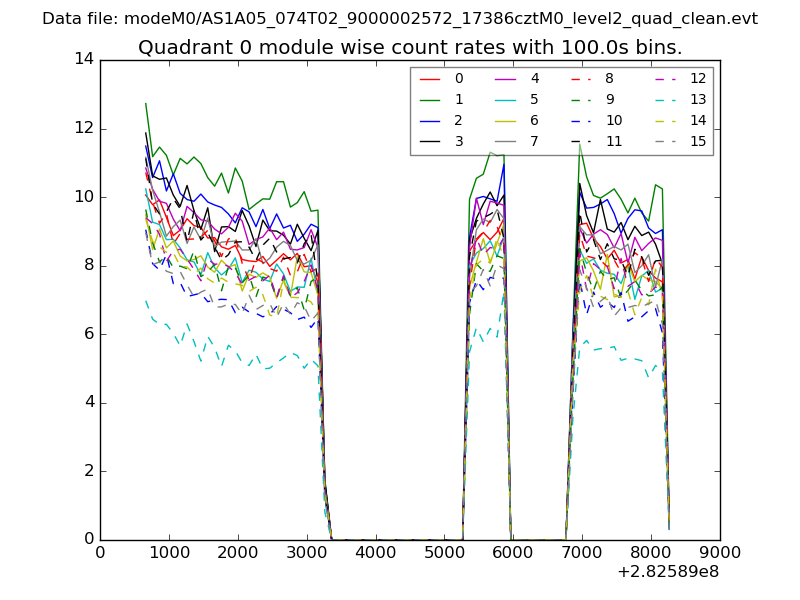 |
 |
| Module-wise count rates for Quadrant B Data is divided into 100 sec bins |
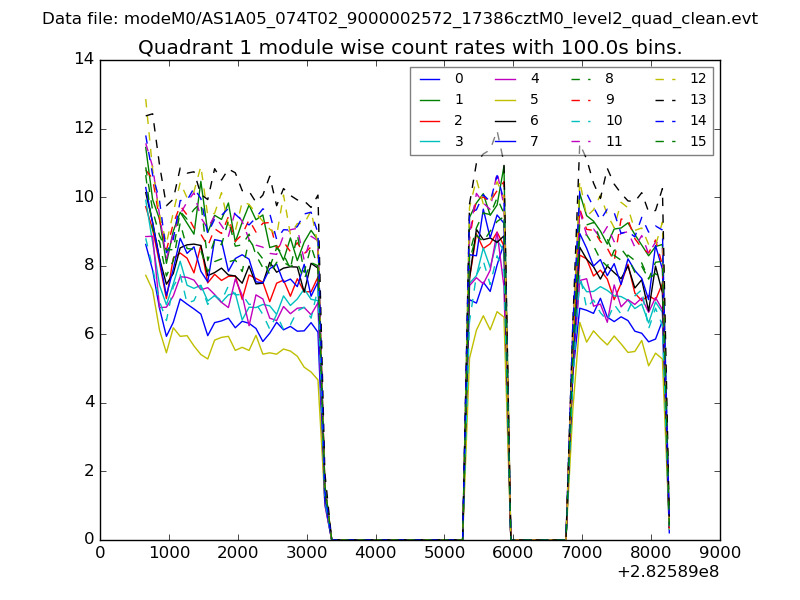 |
 |
| Module-wise count rates for Quadrant C Data is divided into 100 sec bins |
 |
 |
| Module-wise count rates for Quadrant D Data is divided into 100 sec bins |
 |
 |
| Parameter | Plot |
|---|---|
| CZT HV Monitor | 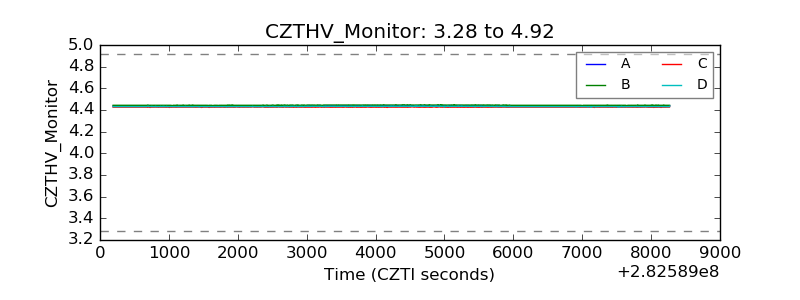 |
| D_VDD | 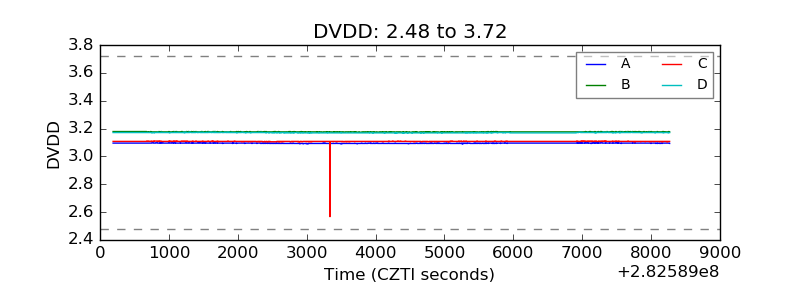 |
| Temperature 1 | 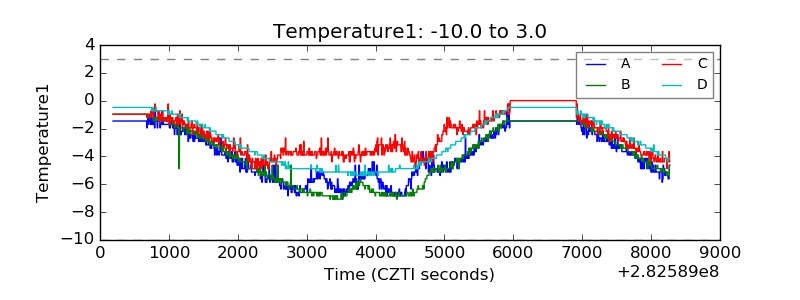 |
| Veto HV Monitor | 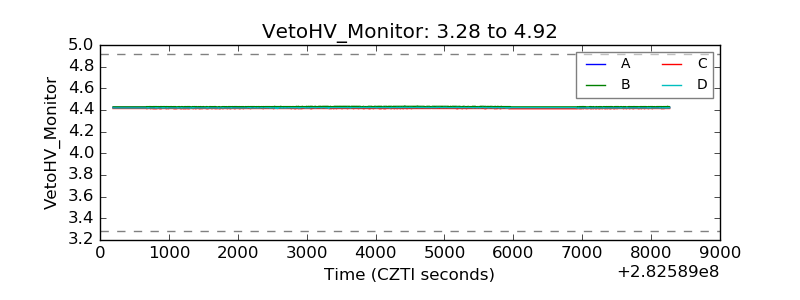 |
| Veto LLD | 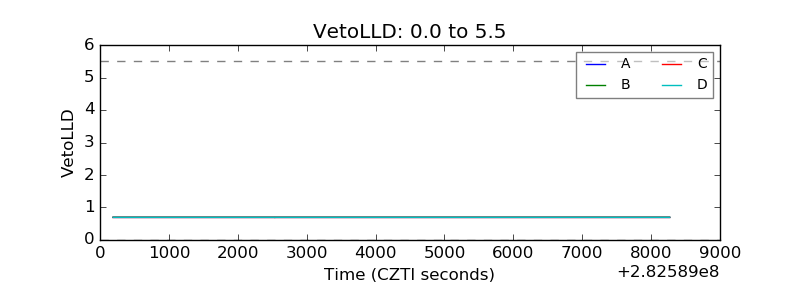 |
| Alpha Counter | 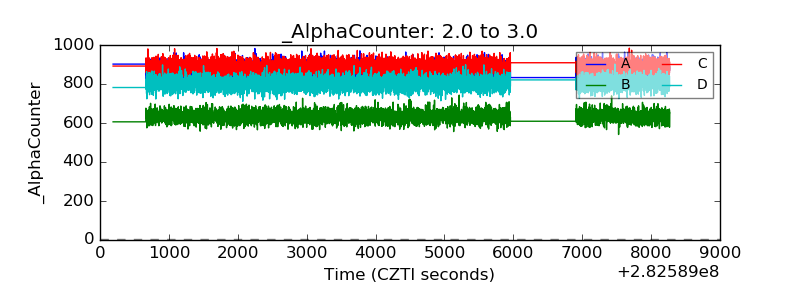 |
| _CPM_Rate | 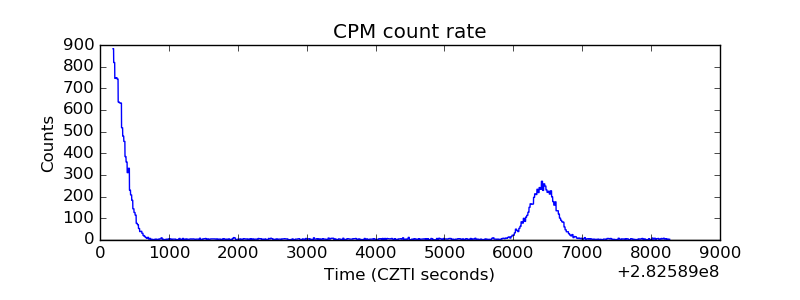 |
| CZT Counter | 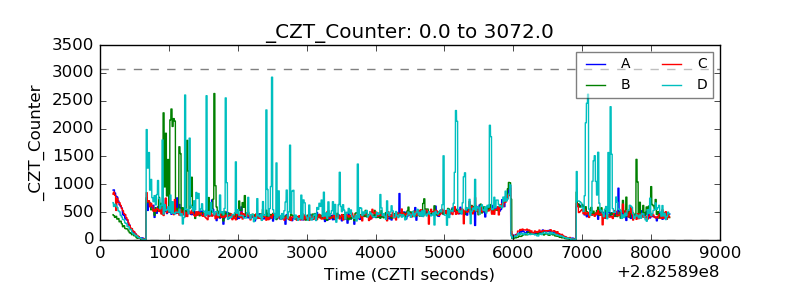 |
| +2.5 Volts monitor |  |
| +5 Volts monitor |  |
| _ROLL_ROT |  |
| _Roll_DEC |  |
| _Roll_RA | 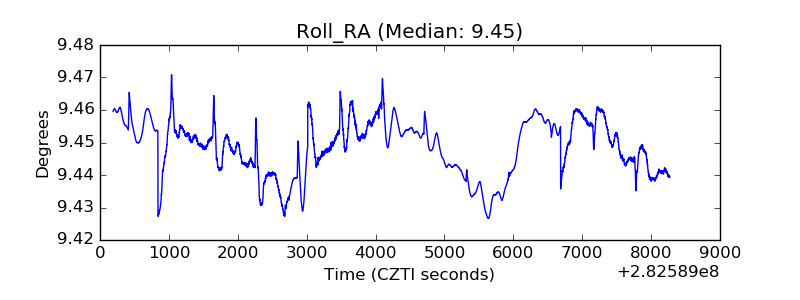 |
| Veto Counter | 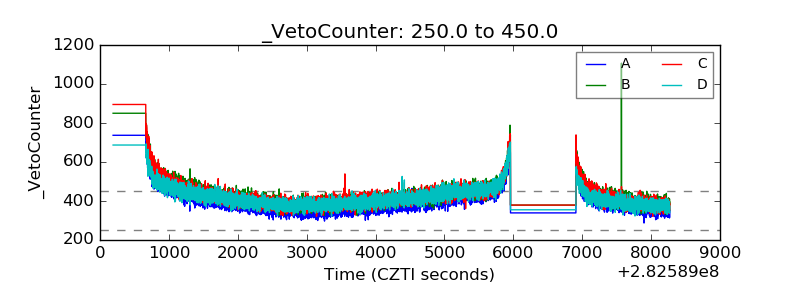 |