| Param | Original file | Final file |
|---|---|---|
| Filename | modeM0/AS1A05_074T02_9000002572_17387cztM0_level2.evt | modeM0/AS1A05_074T02_9000002572_17387cztM0_level2_quad_clean.evt |
| Size (bytes) | 488,393,280 | 99,673,920 |
| Size | 465.8 MB | 95.1 MB |
| Events in quadrant A | 3,273,582 | 645,101 |
| Events in quadrant B | 3,749,614 | 649,409 |
| Events in quadrant C | 3,307,550 | 621,745 |
| Events in quadrant D | 3,974,379 | 604,286 |
| Mode SS | |||
|---|---|---|---|
| Quadrant | BADHDUFLAG | Total packets | Discarded packets |
| A | 0 | 144 | 0 |
| B | 0 | 144 | 0 |
| C | 0 | 144 | 0 |
| D | 0 | 144 | 0 |
| Mode M9 | |||
|---|---|---|---|
| Quadrant | BADHDUFLAG | Total packets | Discarded packets |
| A | 0 | 13 | 0 |
| B | 0 | 14 | 0 |
| C | 0 | 14 | 0 |
| D | 0 | 14 | 0 |
| Mode M0 | |||
|---|---|---|---|
| Quadrant | BADHDUFLAG | Total packets | Discarded packets |
| A | 0 | 14642 | 1 |
| B | 0 | 15903 | 1 |
| C | 0 | 14645 | 1 |
| D | 0 | 16812 | 1 |
| Quadrant | Total seconds | Saturated seconds | Saturation percentage |
|---|---|---|---|
| A | 7154 | 37 | 0.517193% |
| B | 7154 | 142 | 1.984904% |
| C | 7154 | 68 | 0.950517% |
| D | 7154 | 130 | 1.817165% |
Noise dominated data is calculated using 1-second bins in cleaned event files. If a bin has >2000 counts, and if more than 50% of those come from <1% of pixels, then it is considered to be noise-dominated and hence unusable.
| Quadrant | # 1 sec bins | Bins with >0 counts | Bins with >2000 counts | High rate bins dominated by noise | Noise dominated (total time) | Noise dominated (detector-on time) | Marked lightcurve |
|---|---|---|---|---|---|---|---|
| A | 7614 | 7155 | 0 | 0 | 0.00% | 0.00% | 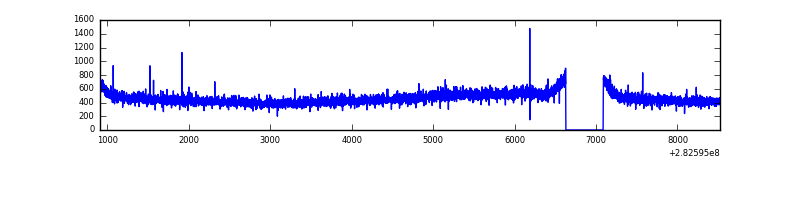 |
| B | 7614 | 7155 | 29 | 29 | 0.38% | 0.41% | 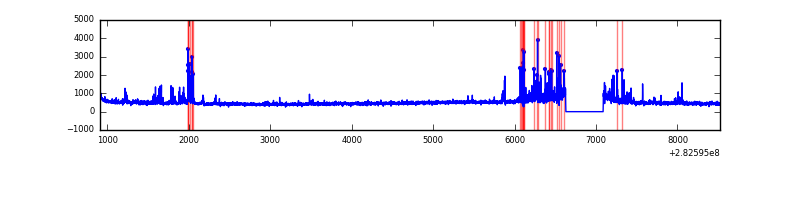 |
| C | 7614 | 7155 | 0 | 0 | 0.00% | 0.00% | 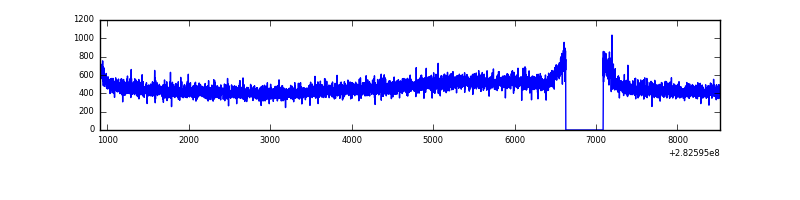 |
| D | 7614 | 7155 | 98 | 98 | 1.29% | 1.37% | 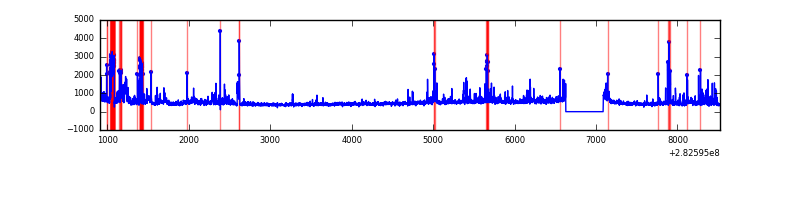 |
Top three noisy pixels from each quadrant. If the there are fewer than three noisy pixels in the level2.evt file, extra rows are filled as -1
| Pixel properties | Quadrant properties | ||||||
|---|---|---|---|---|---|---|---|
| Quadrant | DetID | PixID | Counts | Sigma | Mean | Median | Sigma |
| A | 0 | 226 | 7427 | 38.17 | 850 | 830 | 172.8 |
| A | 12 | 194 | 6256 | 31.4 | 850 | 830 | 172.8 |
| A | 3 | 137 | 6161 | 30.85 | 850 | 830 | 172.8 |
| B | 7 | 220 | 122123 | 742.55 | 850 | 827 | 163.4 |
| B | 4 | 216 | 90014 | 545.99 | 850 | 827 | 163.4 |
| B | 0 | 197 | 87335 | 529.59 | 850 | 827 | 163.4 |
| C | 14 | 238 | 124914 | 655.89 | 807 | 812 | 189.2 |
| C | 3 | 233 | 26513 | 135.83 | 807 | 812 | 189.2 |
| C | 13 | 61 | 5914 | 26.96 | 807 | 812 | 189.2 |
| D | 13 | 189 | 296607 | 1490.57 | 812 | 790 | 198.5 |
| D | 11 | 176 | 202968 | 1018.74 | 812 | 790 | 198.5 |
| D | 1 | 52 | 135886 | 680.72 | 812 | 790 | 198.5 |
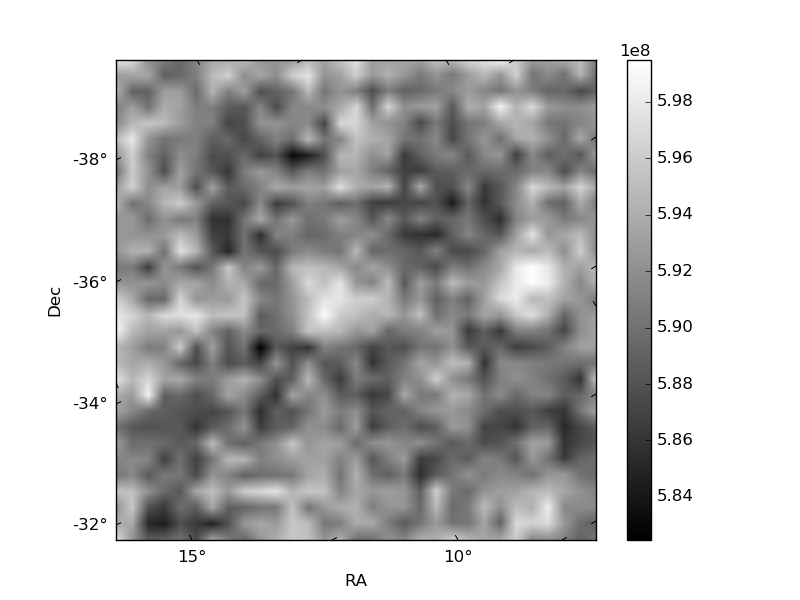
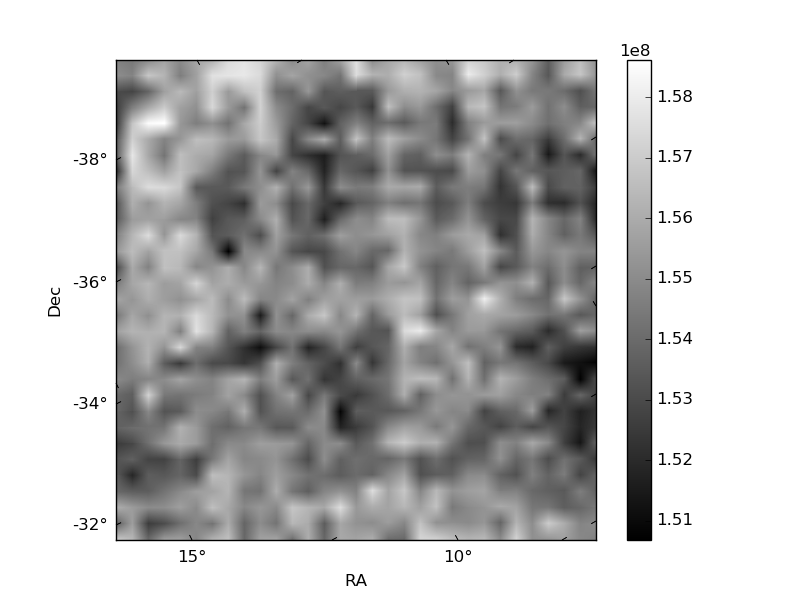
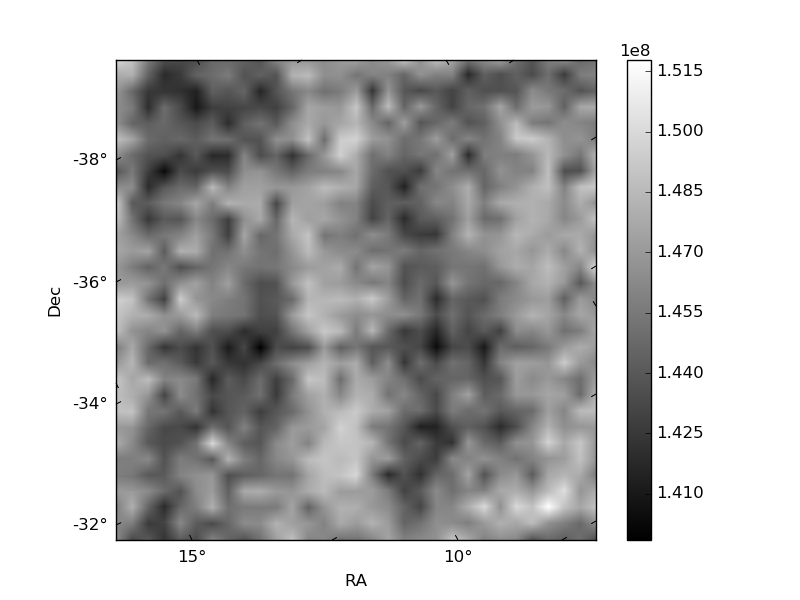
Histogram calculated using DETX and DETY for each event in the final _common_clean file
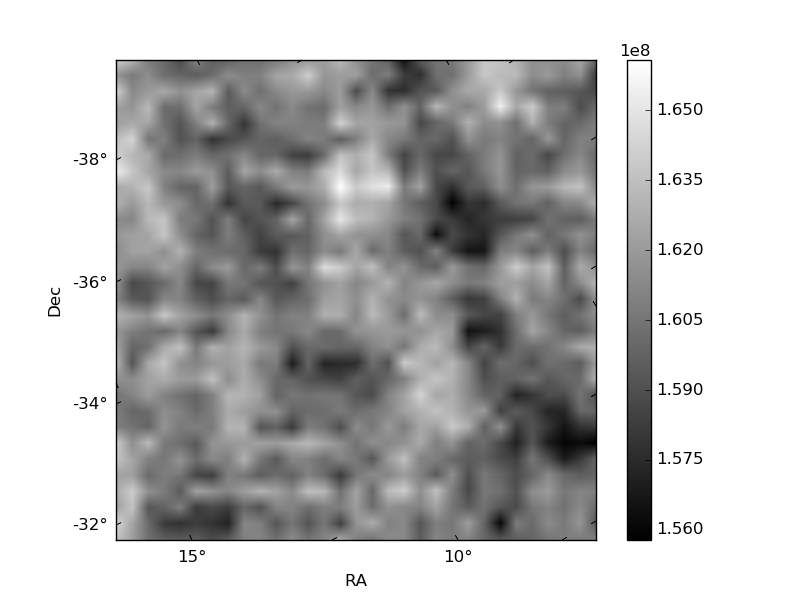
| Quadrant A | 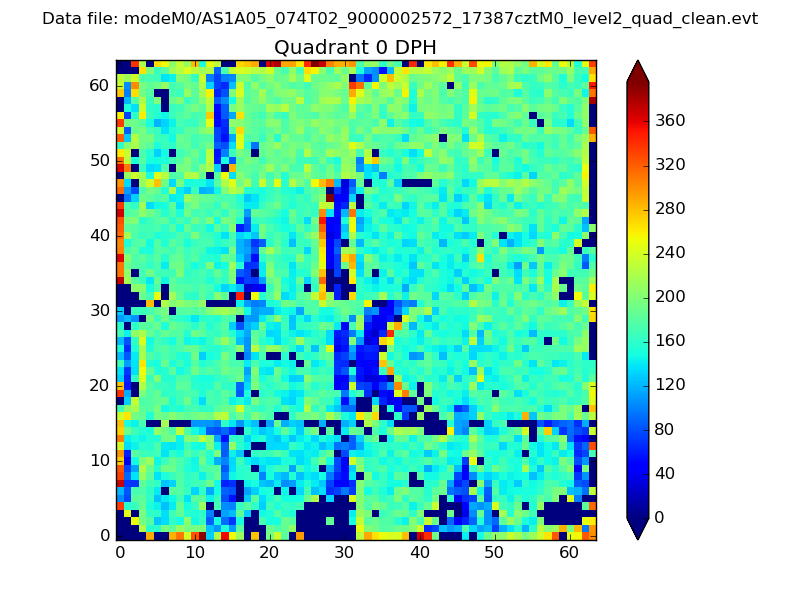 |
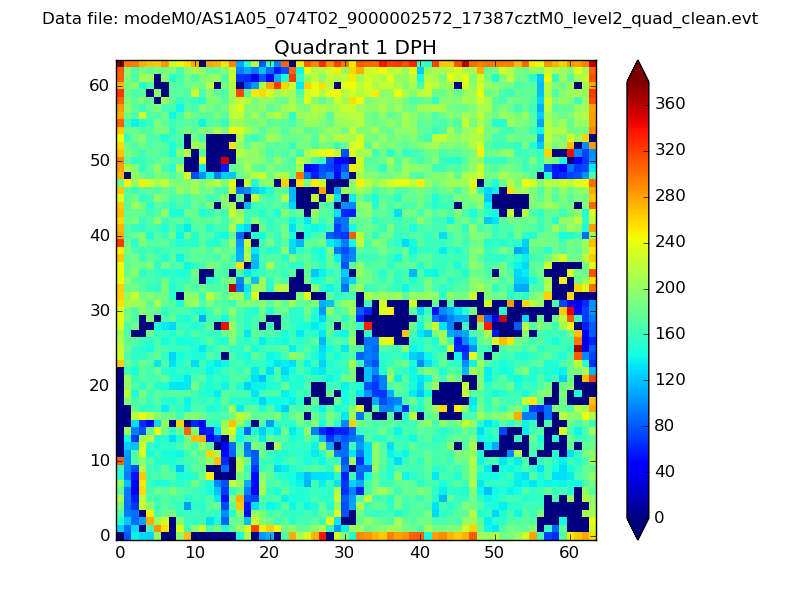 |
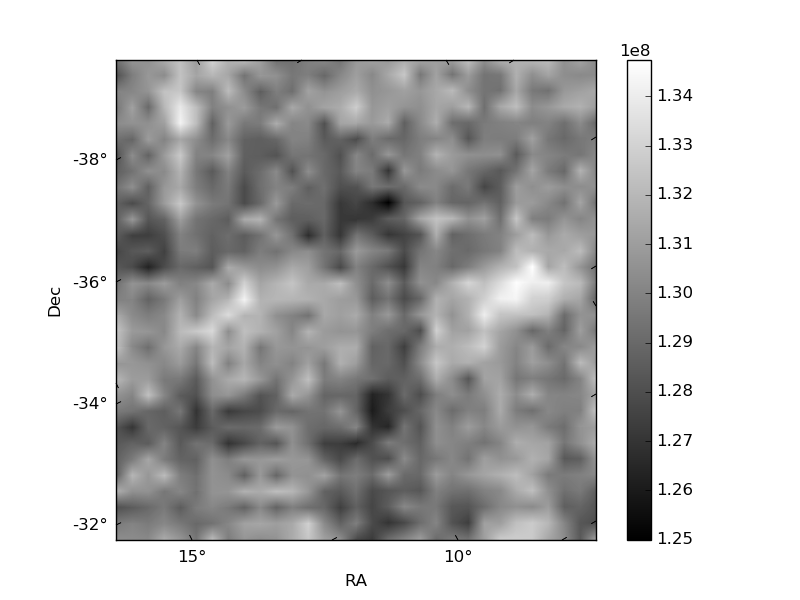
Quadrant B |
|---|---|---|---|
| Quadrant D |  |
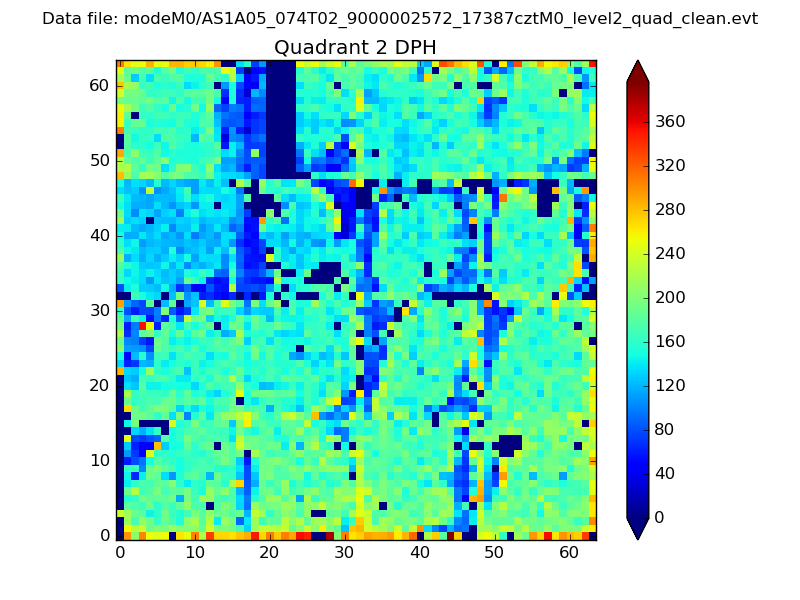 |
Quadrant C |
| Plot type | Count rate plots | Images |
|---|---|---|
| Comparison with Poisson distribution Blue bars denote a histogram of data divided into 1 sec bins. Red curve is a Poisson curve with rate = median count rate of data. |
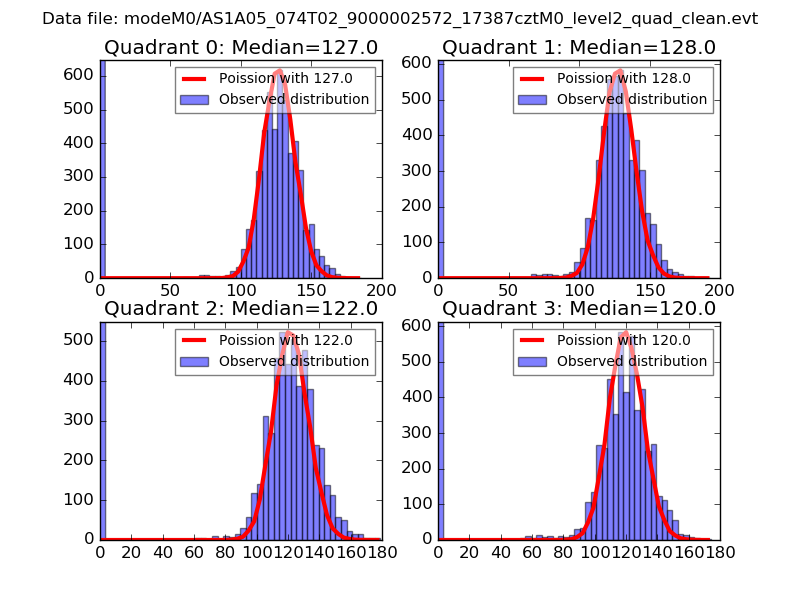 |
 |
| Quadrant-wise count rates Data is divided into 100 sec bins |
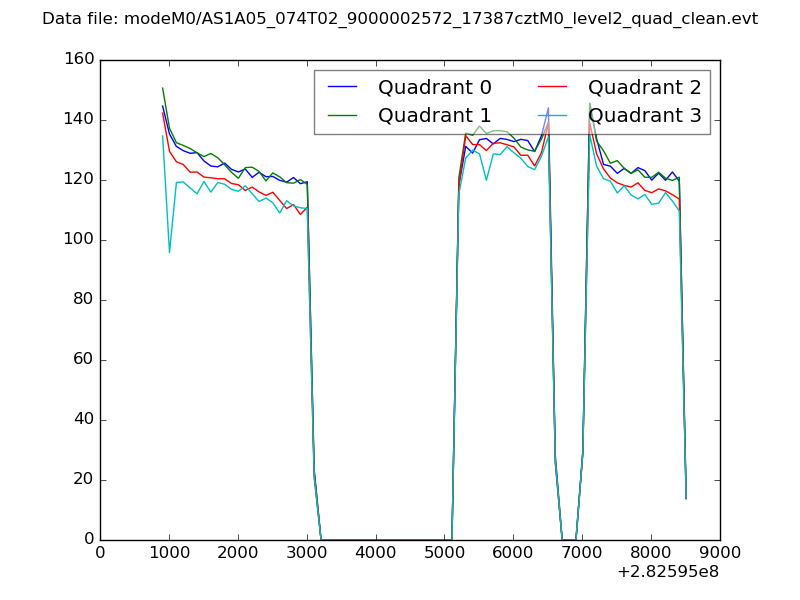 |
|
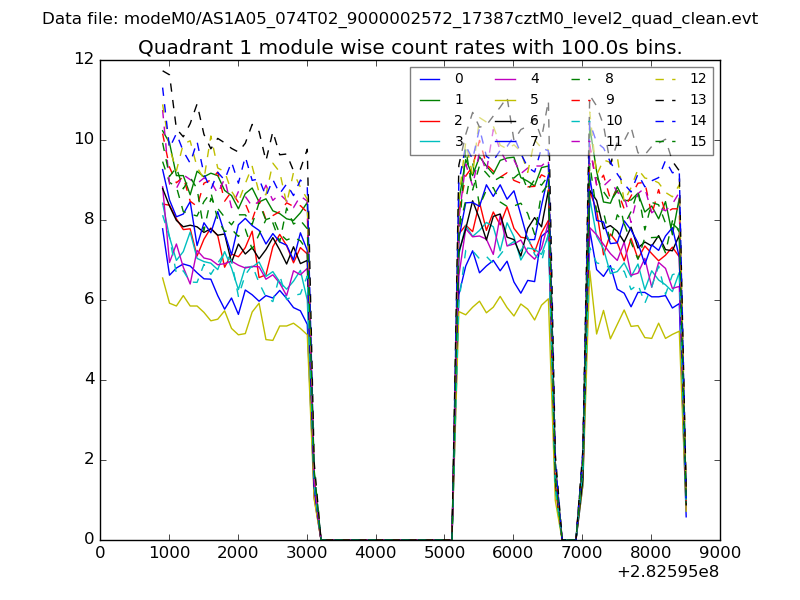
| Module-wise count rates for Quadrant A Data is divided into 100 sec bins |
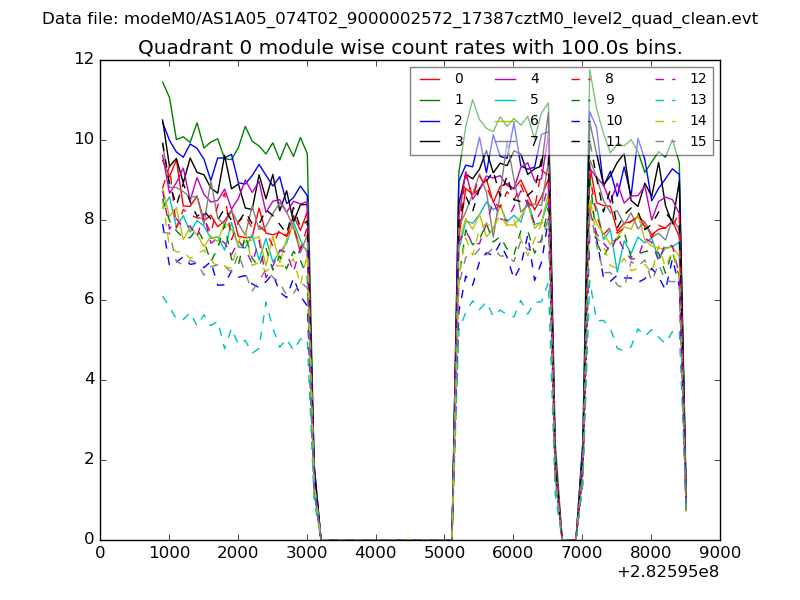 |
 |
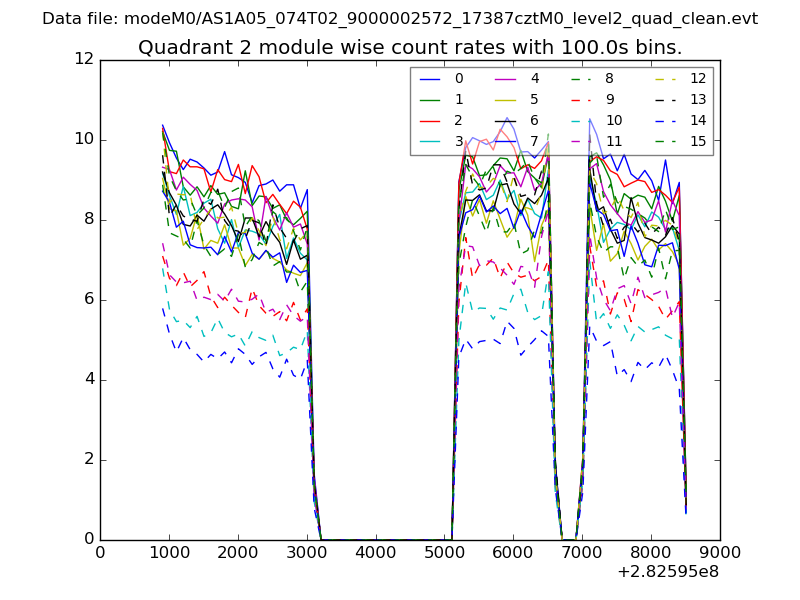
| Module-wise count rates for Quadrant B Data is divided into 100 sec bins |
 |
 |
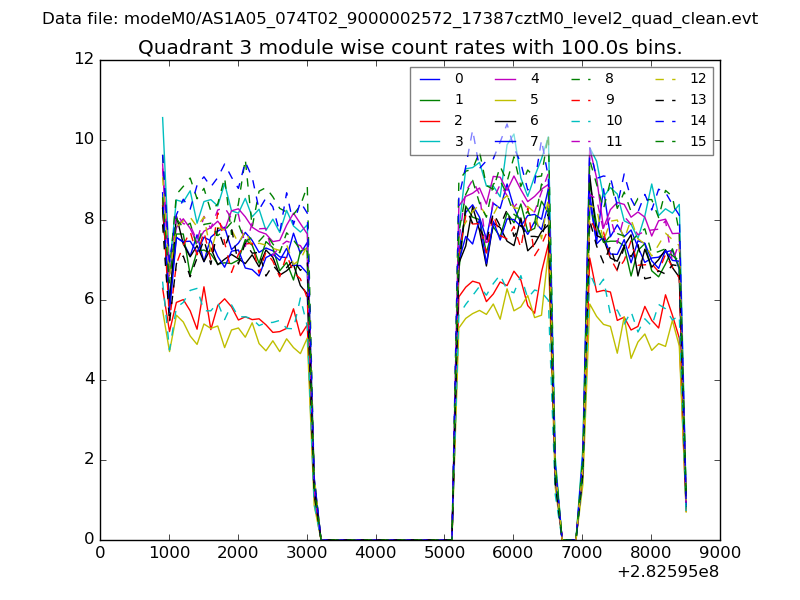
| Module-wise count rates for Quadrant C Data is divided into 100 sec bins |
 |
 |
| Module-wise count rates for Quadrant D Data is divided into 100 sec bins |
 |
 |
| Parameter | Plot |
|---|---|
| CZT HV Monitor | 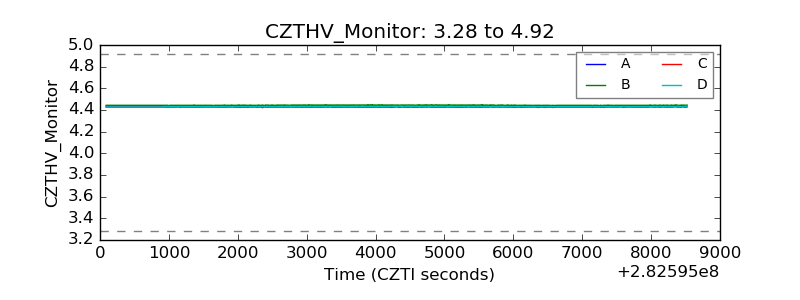 |
| D_VDD | 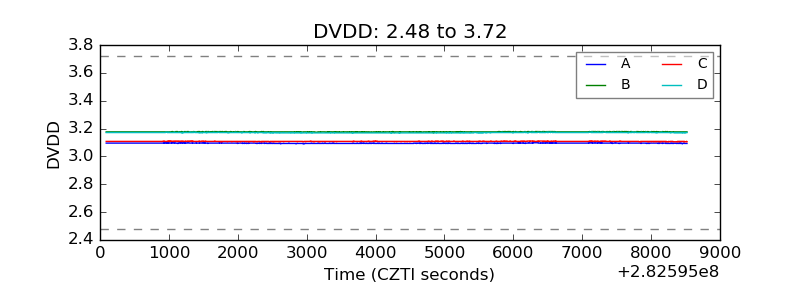 |
| Temperature 1 | 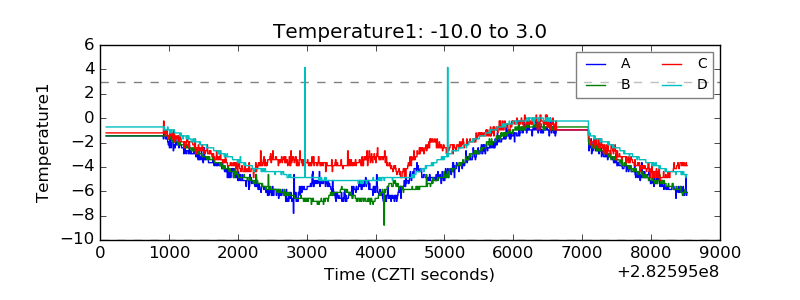 |
| Veto HV Monitor | 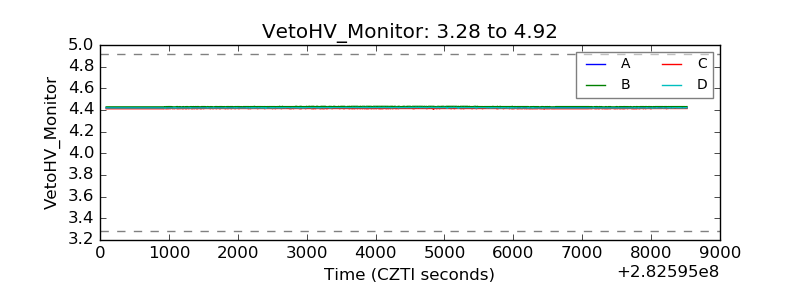 |
| Veto LLD | 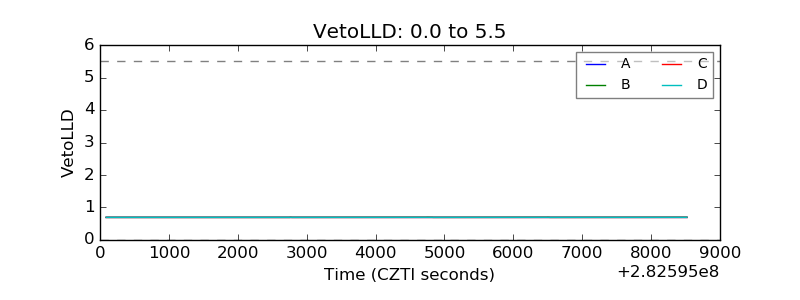 |
| Alpha Counter | 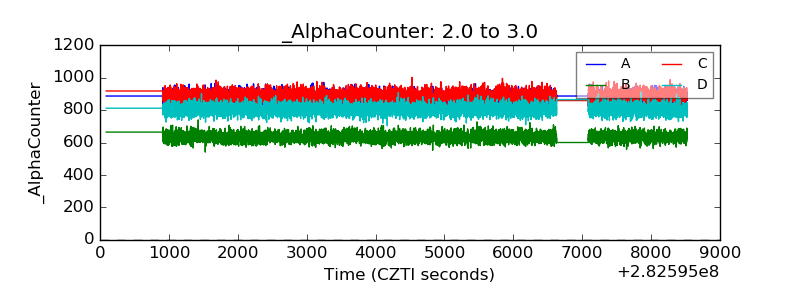 |
| _CPM_Rate | 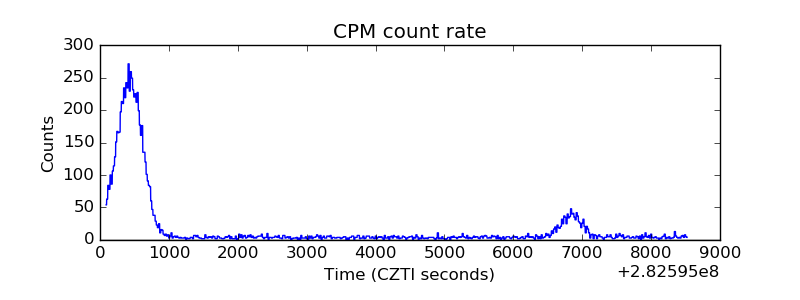 |
| CZT Counter | 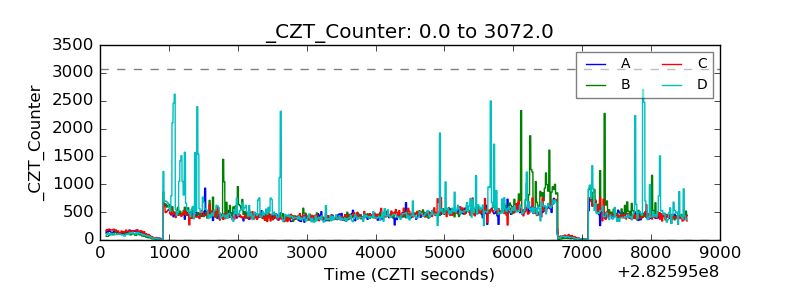 |
| +2.5 Volts monitor | 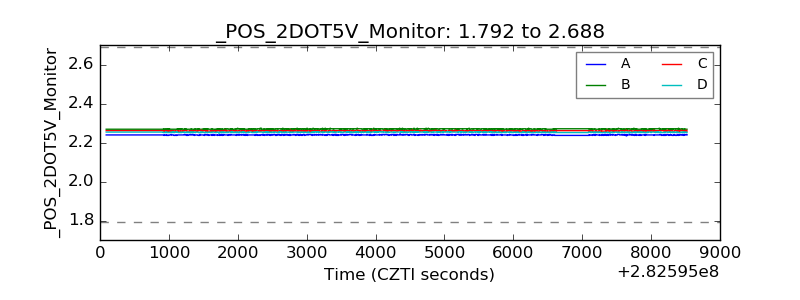 |
| +5 Volts monitor |  |
| _ROLL_ROT | 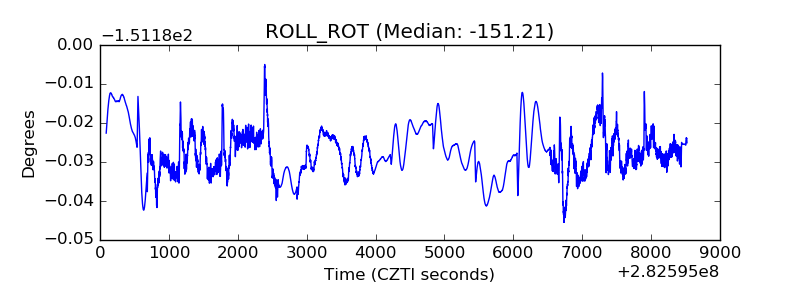 |
| _Roll_DEC | 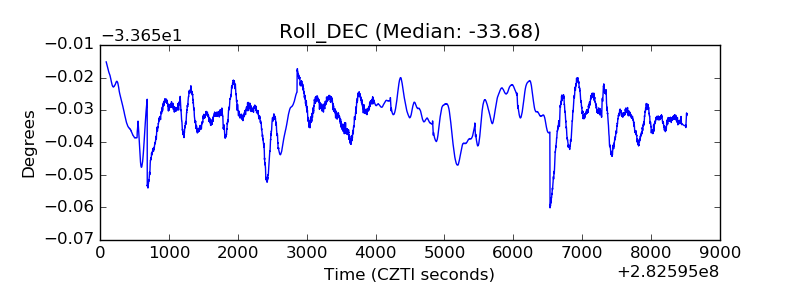 |
| _Roll_RA | 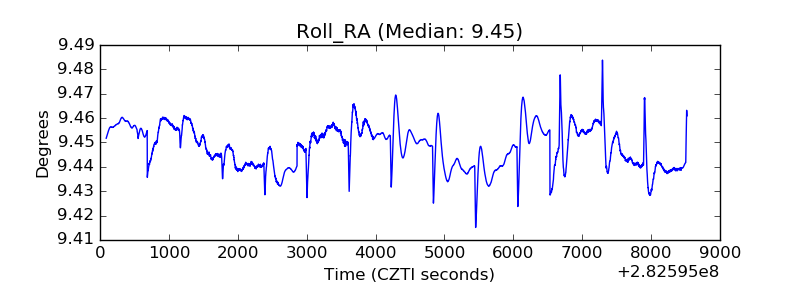 |
| Veto Counter | 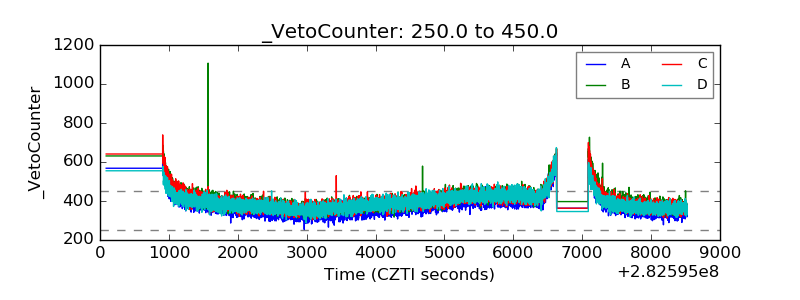 |