| Param | Original file | Final file |
|---|---|---|
| Filename | modeM0/AS1A05_074T02_9000002572_17389cztM0_level2.evt | modeM0/AS1A05_074T02_9000002572_17389cztM0_level2_quad_clean.evt |
| Size (bytes) | 511,698,240 | 100,500,480 |
| Size | 488.0 MB | 95.8 MB |
| Events in quadrant A | 3,319,437 | 651,622 |
| Events in quadrant B | 3,687,422 | 655,710 |
| Events in quadrant C | 3,390,021 | 625,733 |
| Events in quadrant D | 4,607,108 | 605,195 |
| Mode SS | |||
|---|---|---|---|
| Quadrant | BADHDUFLAG | Total packets | Discarded packets |
| A | 0 | 146 | 0 |
| B | 0 | 146 | 0 |
| C | 0 | 146 | 0 |
| D | 0 | 146 | 0 |
| Mode M9 | |||
|---|---|---|---|
| Quadrant | BADHDUFLAG | Total packets | Discarded packets |
| A | 0 | 3 | 0 |
| B | 0 | 4 | 0 |
| C | 0 | 4 | 0 |
| D | 0 | 4 | 0 |
| Mode M0 | |||
|---|---|---|---|
| Quadrant | BADHDUFLAG | Total packets | Discarded packets |
| A | 0 | 14866 | 1 |
| B | 0 | 15830 | 1 |
| C | 0 | 14917 | 1 |
| D | 0 | 18630 | 1 |
| Quadrant | Total seconds | Saturated seconds | Saturation percentage |
|---|---|---|---|
| A | 7262 | 27 | 0.371798% |
| B | 7262 | 117 | 1.611126% |
| C | 7262 | 83 | 1.142936% |
| D | 7262 | 270 | 3.717984% |
Noise dominated data is calculated using 1-second bins in cleaned event files. If a bin has >2000 counts, and if more than 50% of those come from <1% of pixels, then it is considered to be noise-dominated and hence unusable.
| Quadrant | # 1 sec bins | Bins with >0 counts | Bins with >2000 counts | High rate bins dominated by noise | Noise dominated (total time) | Noise dominated (detector-on time) | Marked lightcurve |
|---|---|---|---|---|---|---|---|
| A | 7477 | 7263 | 0 | 0 | 0.00% | 0.00% | 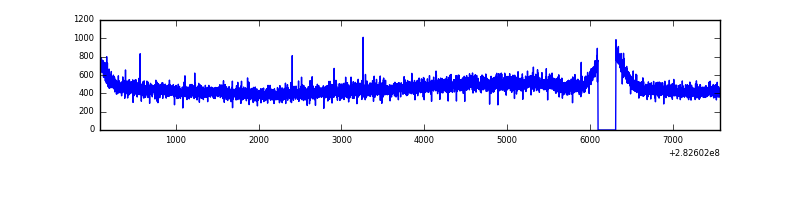 |
| B | 7477 | 7263 | 11 | 11 | 0.15% | 0.15% | 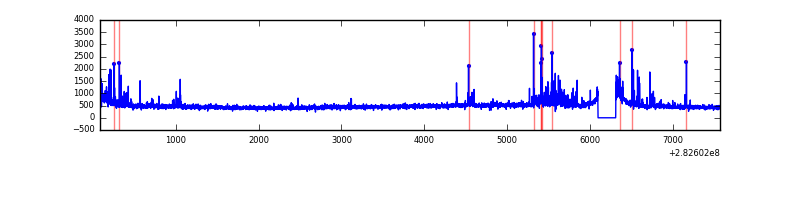 |
| C | 7477 | 7263 | 1 | 1 | 0.01% | 0.01% | 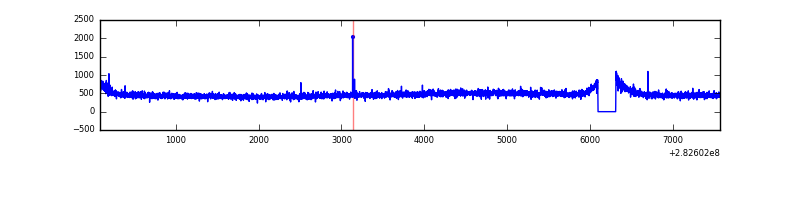 |
| D | 7477 | 7263 | 208 | 208 | 2.78% | 2.86% | 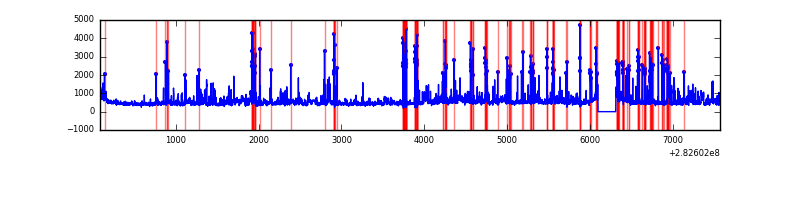 |
Top three noisy pixels from each quadrant. If the there are fewer than three noisy pixels in the level2.evt file, extra rows are filled as -1
| Pixel properties | Quadrant properties | ||||||
|---|---|---|---|---|---|---|---|
| Quadrant | DetID | PixID | Counts | Sigma | Mean | Median | Sigma |
| A | 0 | 226 | 7611 | 38.52 | 862 | 842 | 175.7 |
| A | 3 | 137 | 6333 | 31.25 | 862 | 842 | 175.7 |
| A | 12 | 194 | 6278 | 30.94 | 862 | 842 | 175.7 |
| B | 7 | 220 | 108753 | 649.46 | 861 | 839 | 166.2 |
| B | 0 | 197 | 69507 | 413.27 | 861 | 839 | 166.2 |
| B | 4 | 216 | 37104 | 218.25 | 861 | 839 | 166.2 |
| C | 14 | 238 | 124918 | 648.2 | 819 | 822 | 191.4 |
| C | 3 | 233 | 33271 | 169.49 | 819 | 822 | 191.4 |
| C | 5 | 218 | 24208 | 122.15 | 819 | 822 | 191.4 |
| D | 11 | 176 | 454949 | 2270.26 | 815 | 789 | 200.0 |
| D | 1 | 52 | 340534 | 1698.32 | 815 | 789 | 200.0 |
| D | 11 | 66 | 231157 | 1151.57 | 815 | 789 | 200.0 |
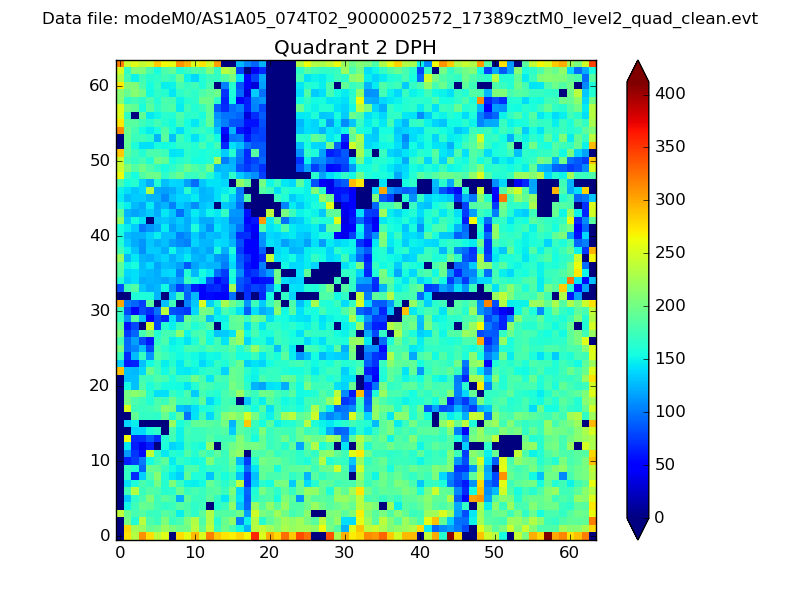
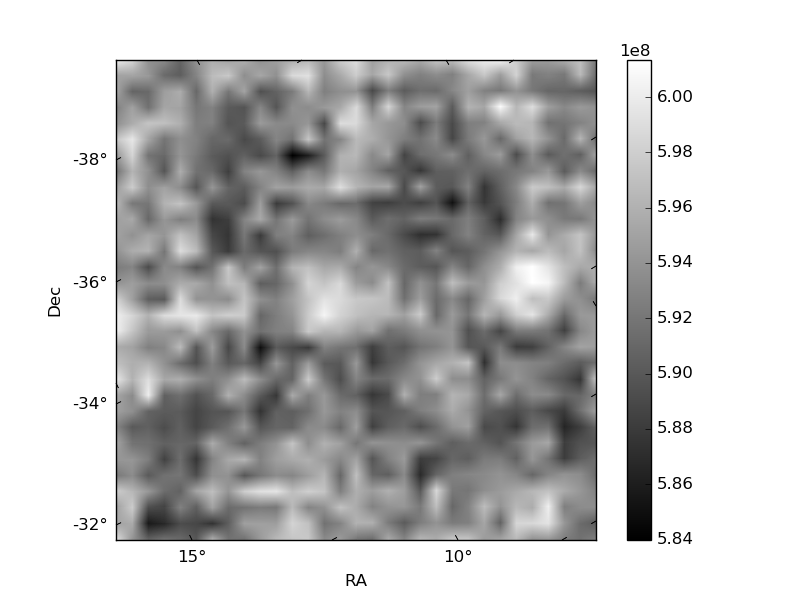
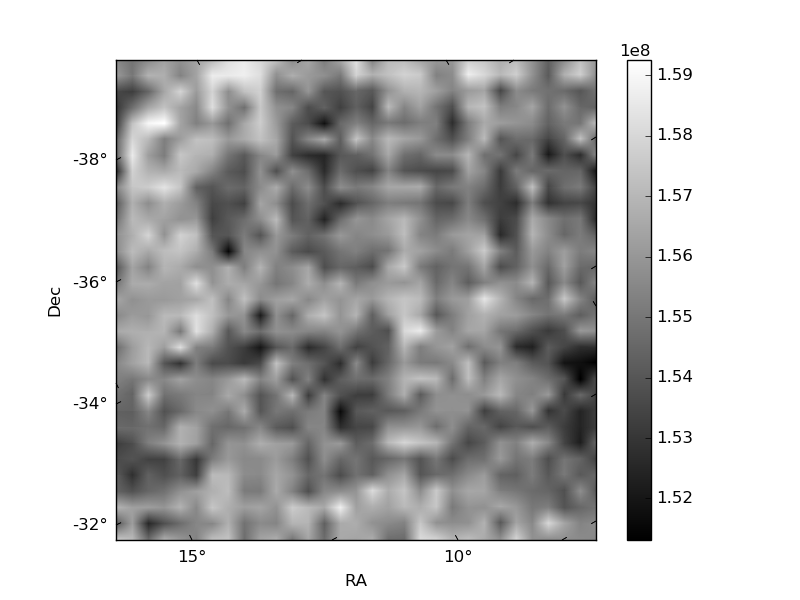
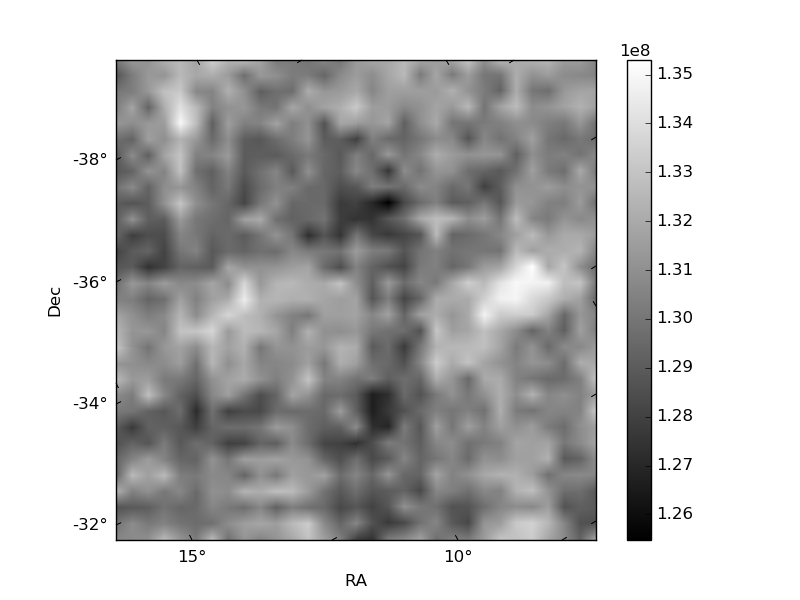
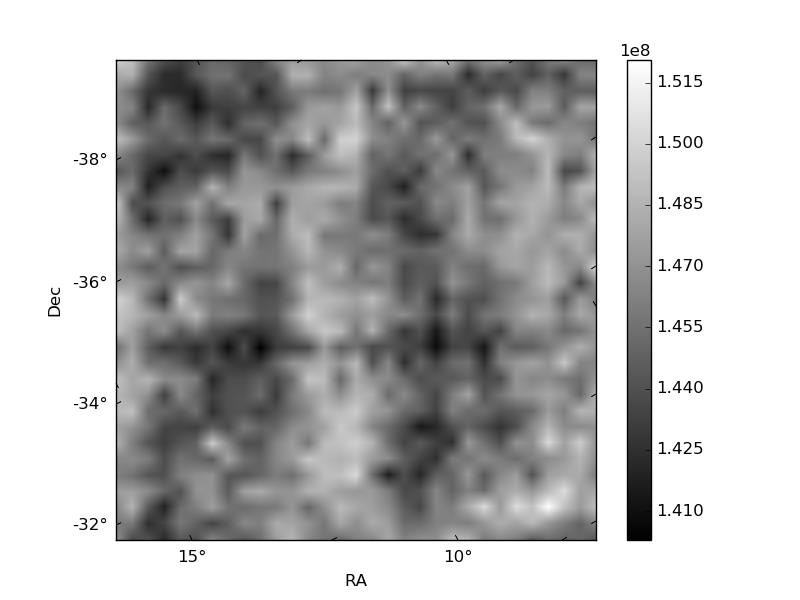
Histogram calculated using DETX and DETY for each event in the final _common_clean file
| Quadrant A | 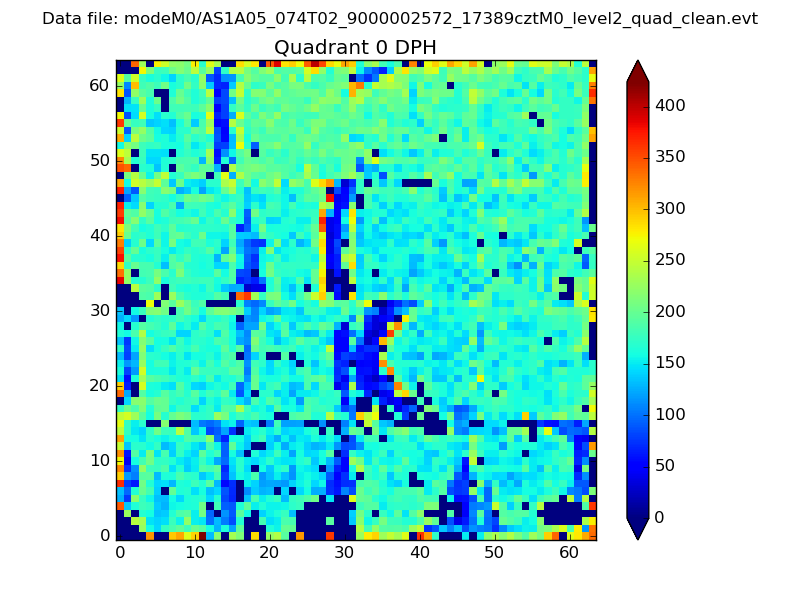 |
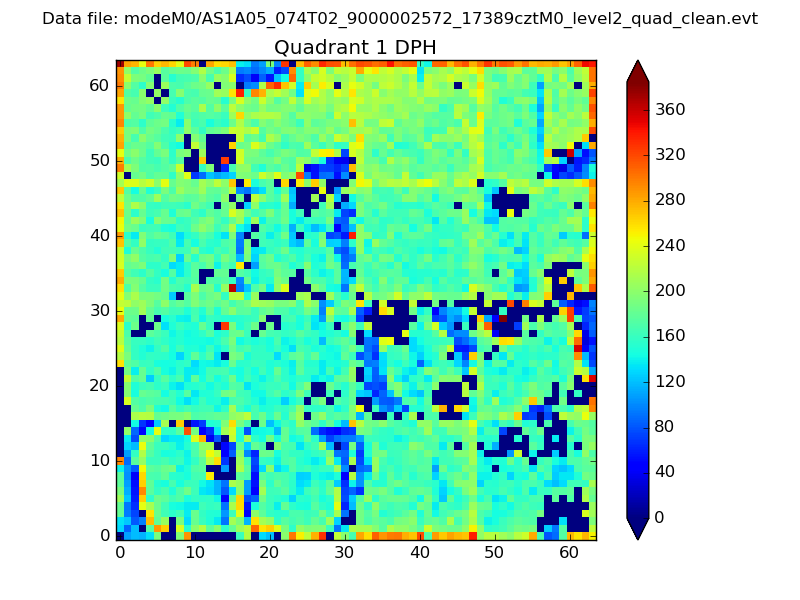 |
Quadrant B |
|---|---|---|---|
| Quadrant D | 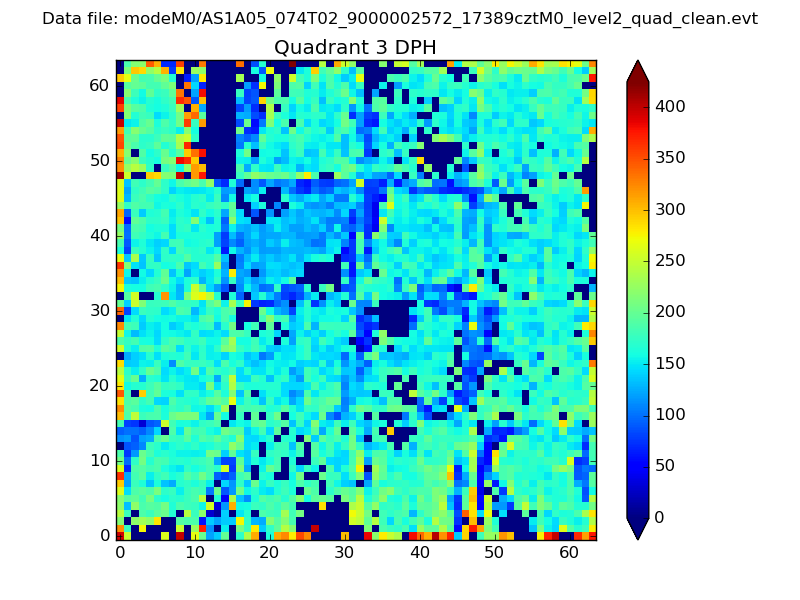 |
 |
Quadrant C |
| Plot type | Count rate plots | Images |
|---|---|---|
| Comparison with Poisson distribution Blue bars denote a histogram of data divided into 1 sec bins. Red curve is a Poisson curve with rate = median count rate of data. |
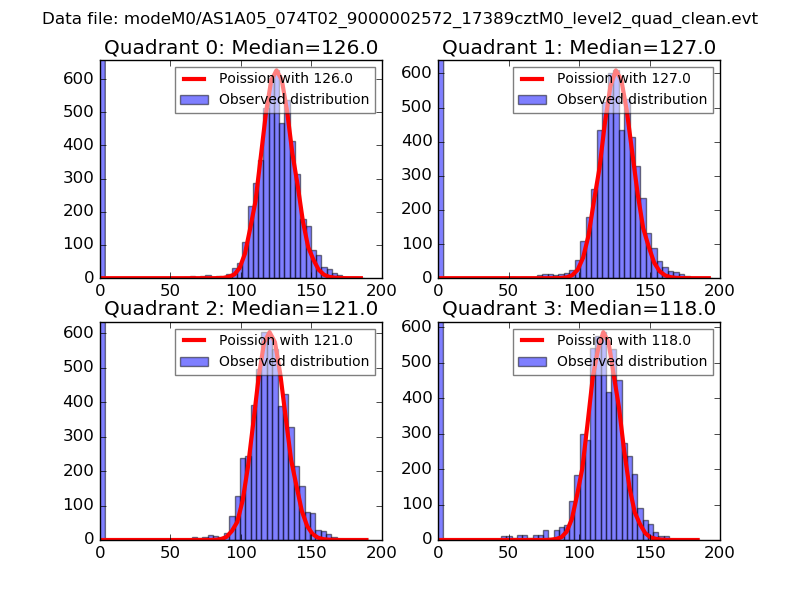 |
 |
| Quadrant-wise count rates Data is divided into 100 sec bins |
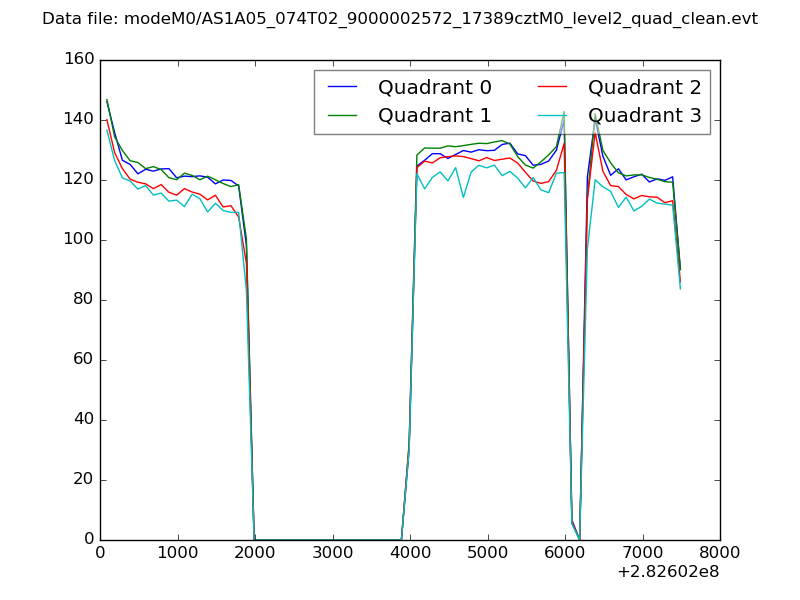 |
|
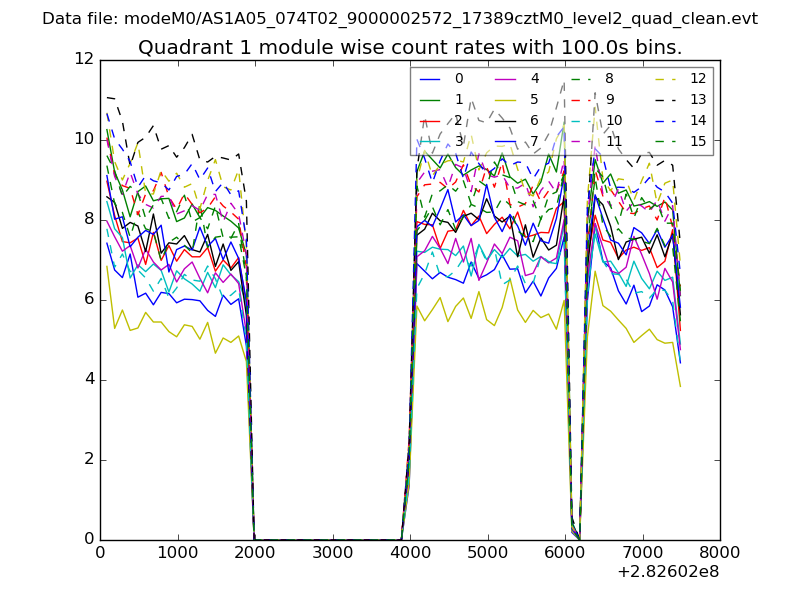
| Module-wise count rates for Quadrant A Data is divided into 100 sec bins |
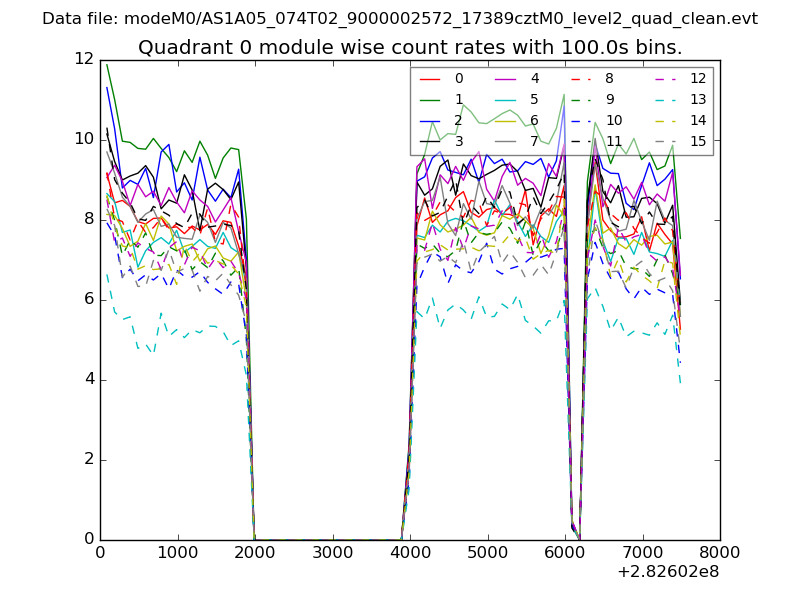 |
 |
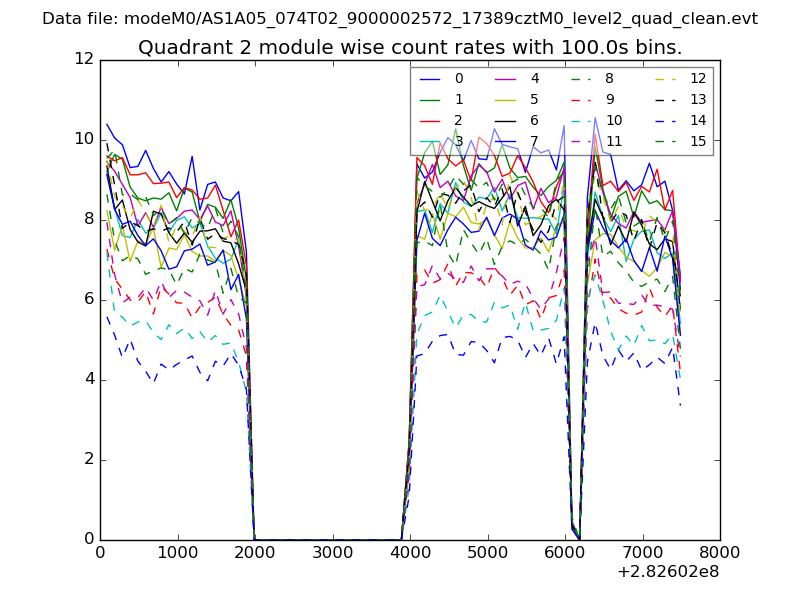
| Module-wise count rates for Quadrant B Data is divided into 100 sec bins |
 |
 |
| Module-wise count rates for Quadrant C Data is divided into 100 sec bins |
 |
 |
| Module-wise count rates for Quadrant D Data is divided into 100 sec bins |
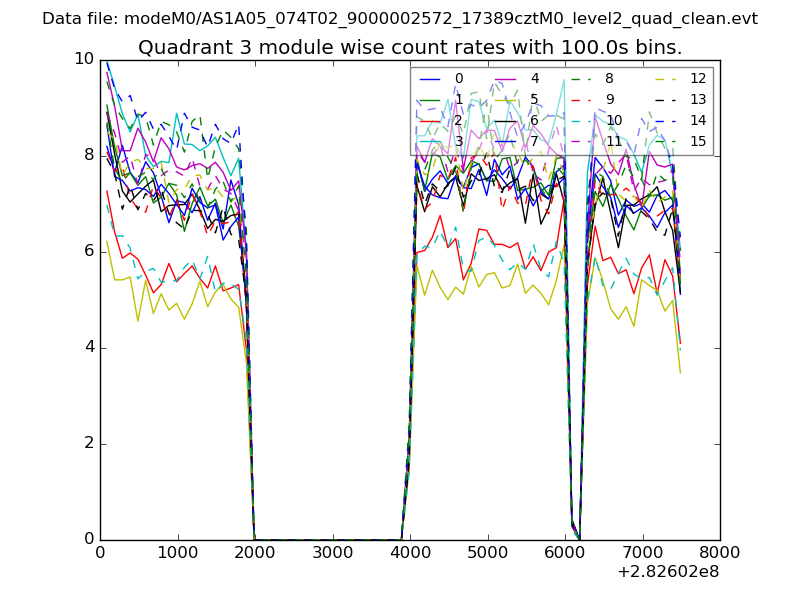 |
 |
| Parameter | Plot |
|---|---|
| CZT HV Monitor | 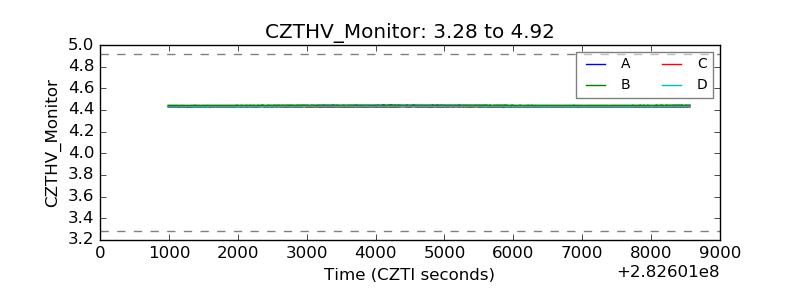 |
| D_VDD | 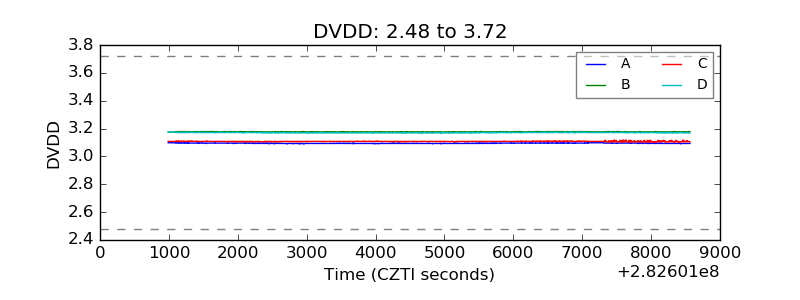 |
| Temperature 1 | 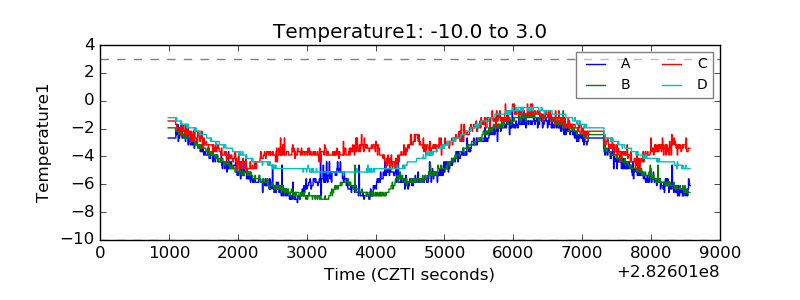 |
| Veto HV Monitor | 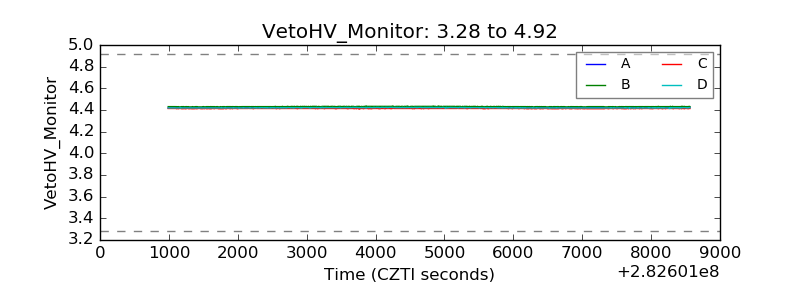 |
| Veto LLD | 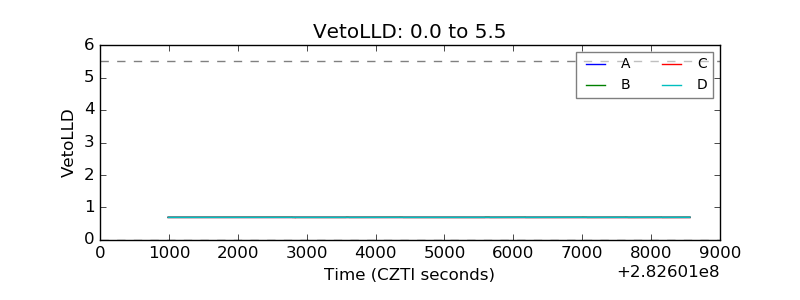 |
| Alpha Counter | 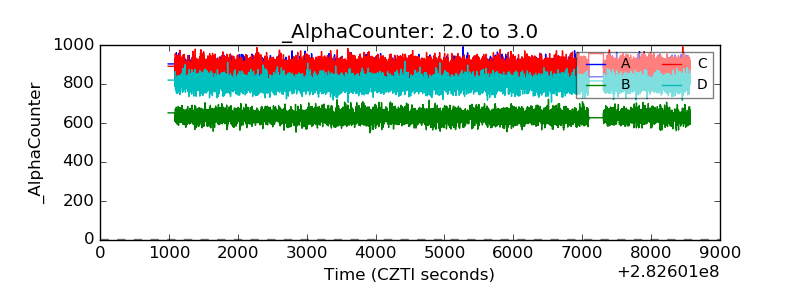 |
| _CPM_Rate | 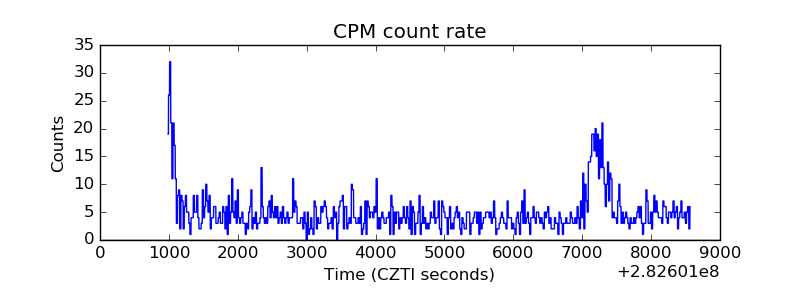 |
| CZT Counter | 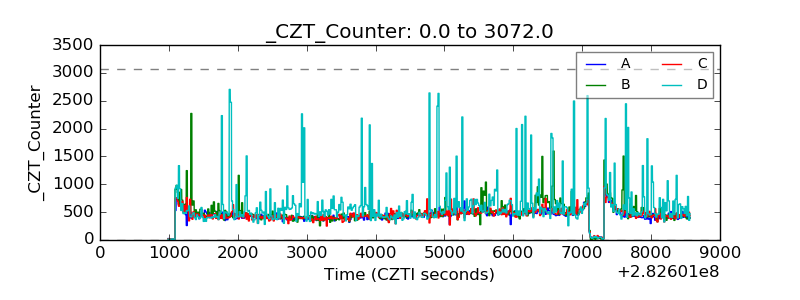 |
| +2.5 Volts monitor | 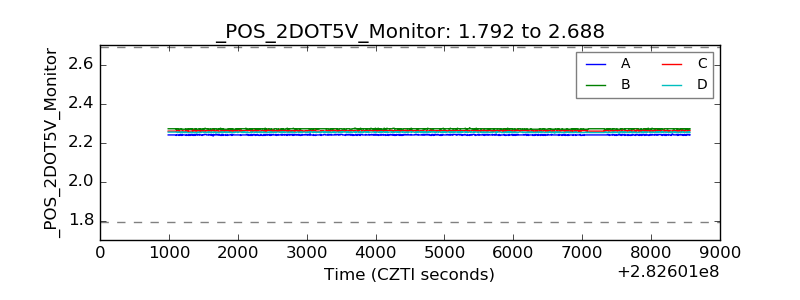 |
| +5 Volts monitor |  |
| _ROLL_ROT | 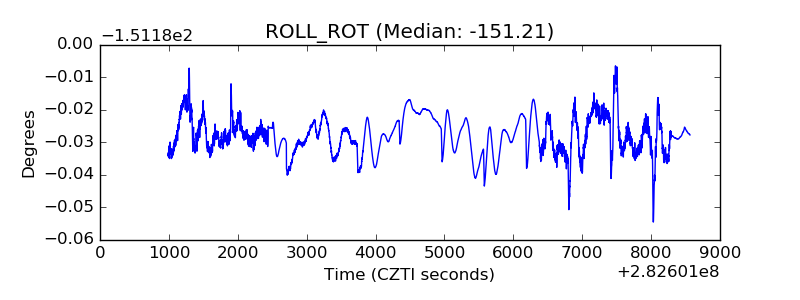 |
| _Roll_DEC | 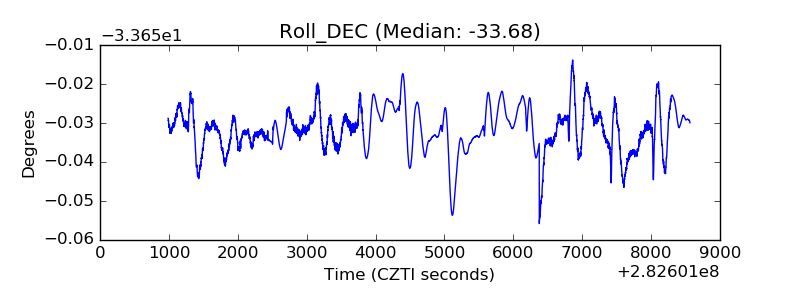 |
| _Roll_RA | 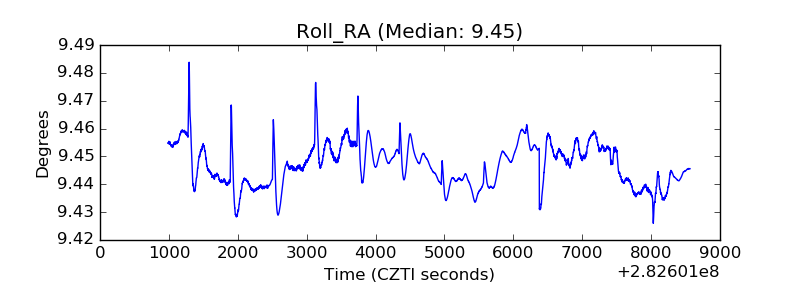 |
| Veto Counter | 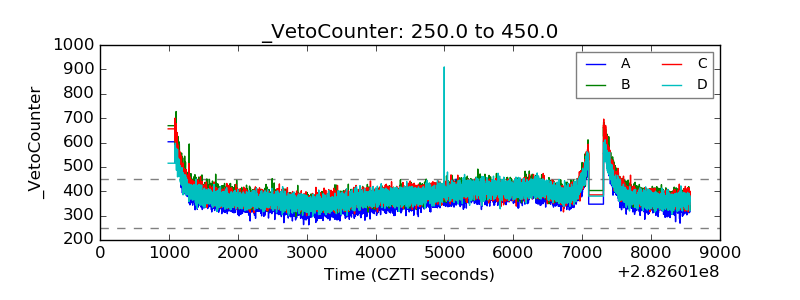 |