| Param | Original file | Final file |
|---|---|---|
| Filename | modeM0/AS1A05_225T02_9000002570cztM0_level2.fits | modeM0/AS1A05_225T02_9000002570cztM0_level2_quad_clean.evt |
| Size (bytes) | 86,924,160 | 65,917,440 |
| Size | 82.9 MB | 62.9 MB |
| Events in quadrant A | 558,294 | 386,985 |
| Events in quadrant B | 526,592 | 376,346 |
| Events in quadrant C | 537,850 | 354,214 |
| Events in quadrant D | 460,016 | 327,545 |
| Mode M9 | |||
|---|---|---|---|
| Quadrant | BADHDUFLAG | Total packets | Discarded packets |
| A | 0 | 20 | 0 |
| B | 0 | 20 | 0 |
| C | 0 | 20 | 0 |
| D | 0 | 20 | 0 |
| Mode M0 | |||
|---|---|---|---|
| Quadrant | BADHDUFLAG | Total packets | Discarded packets |
| A | 0 | 17350 | 0 |
| B | 0 | 17104 | 0 |
| C | 0 | 16877 | 0 |
| D | 0 | 23784 | 0 |
| Mode SS | |||
|---|---|---|---|
| Quadrant | BADHDUFLAG | Total packets | Discarded packets |
| A | 0 | 160 | 0 |
| B | 0 | 160 | 0 |
| C | 0 | 160 | 0 |
| D | 0 | 160 | 0 |
| Quadrant | Total seconds | Saturated seconds | Saturation percentage |
|---|---|---|---|
| A | 7914 | 117 | 1.478393% |
| B | 7914 | 89 | 1.124589% |
| C | 7914 | 97 | 1.225676% |
| D | 7914 | 422 | 5.332322% |
Noise dominated data is calculated using 1-second bins in cleaned event files. If a bin has >2000 counts, and if more than 50% of those come from <1% of pixels, then it is considered to be noise-dominated and hence unusable.
| Quadrant | # 1 sec bins | Bins with >0 counts | Bins with >2000 counts | High rate bins dominated by noise | Noise dominated (total time) | Noise dominated (detector-on time) | Marked lightcurve |
|---|---|---|---|---|---|---|---|
| A | 9188 | 7900 | 0 | 0 | 0.00% | 0.00% | 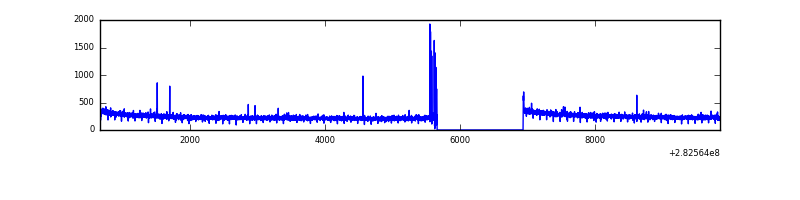 |
| B | 9188 | 7912 | 0 | 0 | 0.00% | 0.00% |  |
| C | 9188 | 7913 | 0 | 0 | 0.00% | 0.00% |  |
| D | 9188 | 7912 | 0 | 0 | 0.00% | 0.00% |  |
Top three noisy pixels from each quadrant. If the there are fewer than three noisy pixels in the level2.evt file, extra rows are filled as -1
| Pixel properties | Quadrant properties | ||||||
|---|---|---|---|---|---|---|---|
| Quadrant | DetID | PixID | Counts | Sigma | Mean | Median | Sigma |
| A | 0 | 29 | 532 | 10.61 | 145 | 139 | 37.0 |
| A | 7 | 110 | 442 | 8.18 | 145 | 139 | 37.0 |
| A | 0 | 30 | 427 | 7.78 | 145 | 139 | 37.0 |
| B | 2 | 9 | 415 | 9.38 | 139 | 134 | 29.9 |
| B | 5 | 128 | 390 | 8.55 | 139 | 134 | 29.9 |
| B | 3 | 80 | 359 | 7.51 | 139 | 134 | 29.9 |
| C | 1 | 80 | 403 | 7.05 | 141 | 133 | 38.3 |
| C | 1 | 81 | 401 | 7.0 | 141 | 133 | 38.3 |
| C | 12 | 241 | 386 | 6.61 | 141 | 133 | 38.3 |
| D | 10 | 189 | 351 | 6.55 | 131 | 121 | 35.1 |
| D | 7 | 3 | 345 | 6.38 | 131 | 121 | 35.1 |
| D | 6 | 67 | 328 | 5.9 | 131 | 121 | 35.1 |
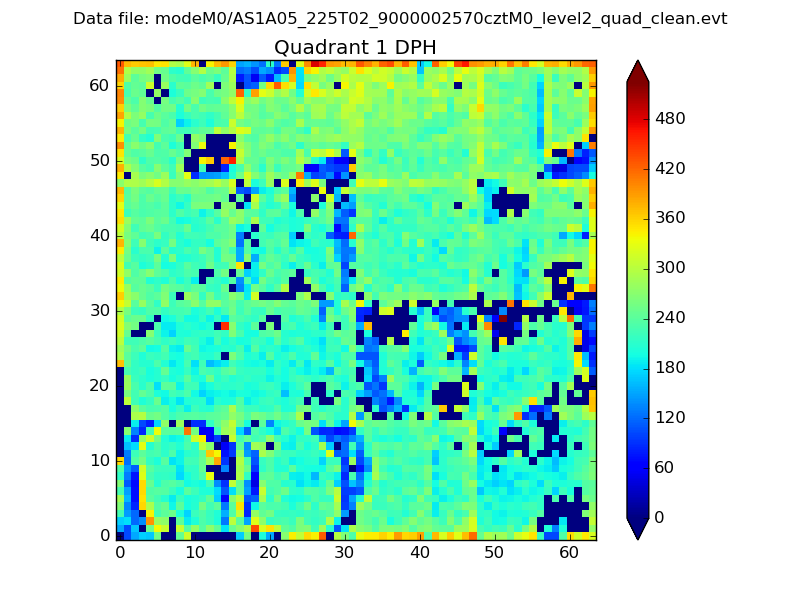
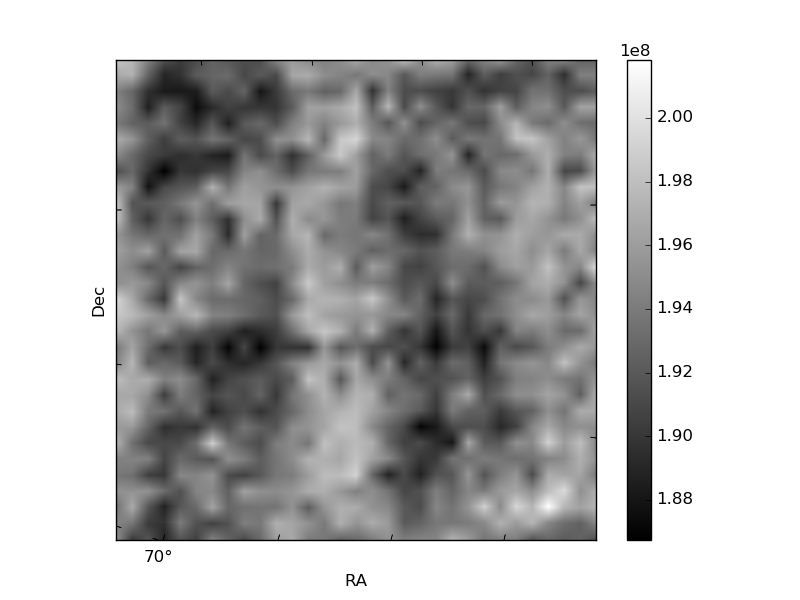
Histogram calculated using DETX and DETY for each event in the final _common_clean file
| Quadrant A |  |
 |
Quadrant B |
|---|---|---|---|
| Quadrant D |  |
 |
Quadrant C |
| Plot type | Count rate plots | Images |
|---|---|---|
| Comparison with Poisson distribution Blue bars denote a histogram of data divided into 1 sec bins. Red curve is a Poisson curve with rate = median count rate of data. |
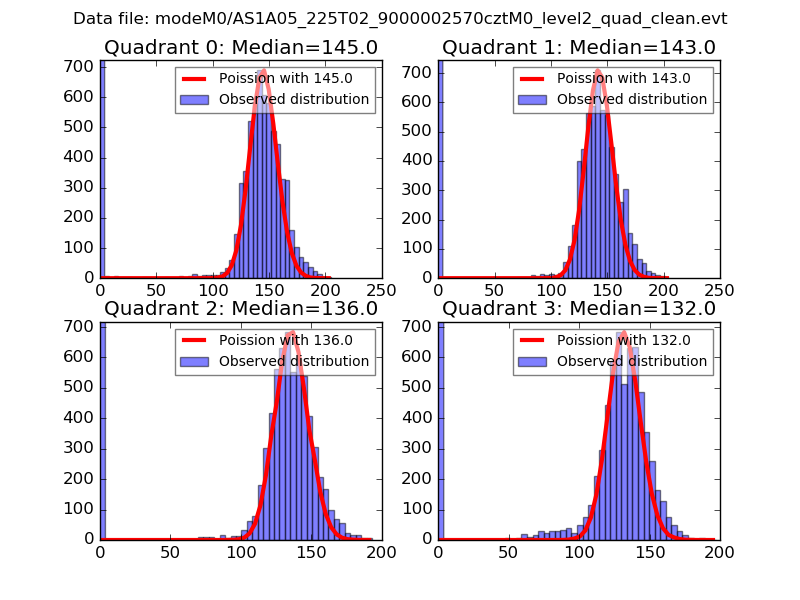 |
 |
| Quadrant-wise count rates Data is divided into 100 sec bins |
 |
|
| Module-wise count rates for Quadrant A Data is divided into 100 sec bins |
 |
 |
| Module-wise count rates for Quadrant B Data is divided into 100 sec bins |
 |
 |
| Module-wise count rates for Quadrant C Data is divided into 100 sec bins |
 |
 |
| Module-wise count rates for Quadrant D Data is divided into 100 sec bins |
 |
 |
| Parameter | Plot |
|---|---|
| CZT HV Monitor | 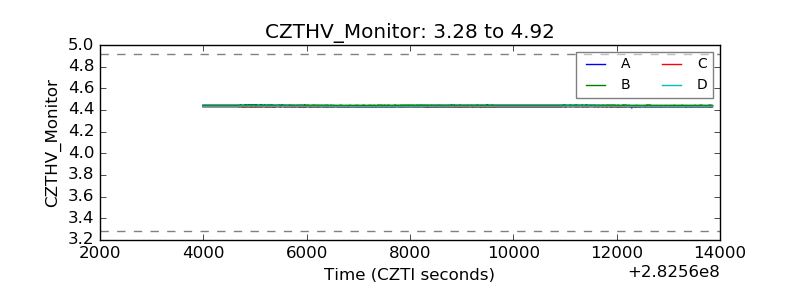 |
| D_VDD | 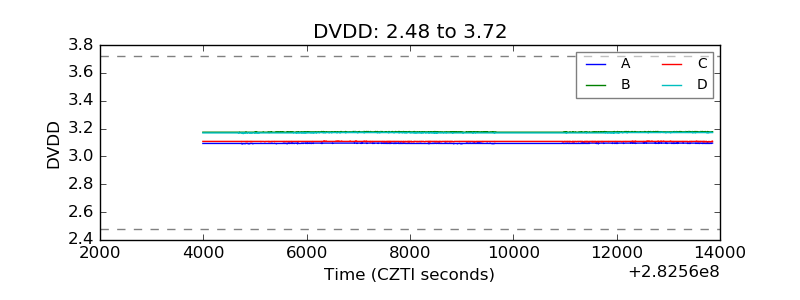 |
| Temperature 1 |  |
| Veto HV Monitor |  |
| Veto LLD | 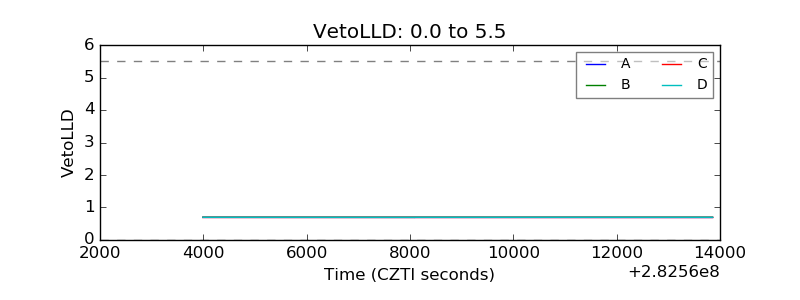 |
| Alpha Counter |  |
| _CPM_Rate | 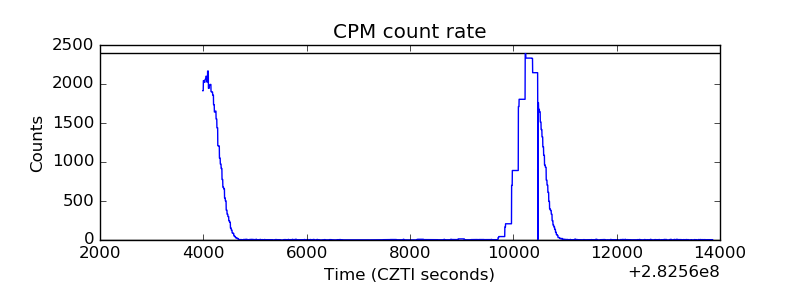 |
| CZT Counter |  |
| +2.5 Volts monitor |  |
| +5 Volts monitor | 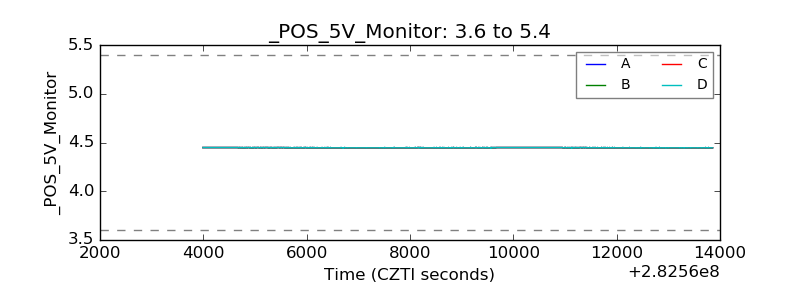 |
| _ROLL_ROT |  |
| _Roll_DEC | 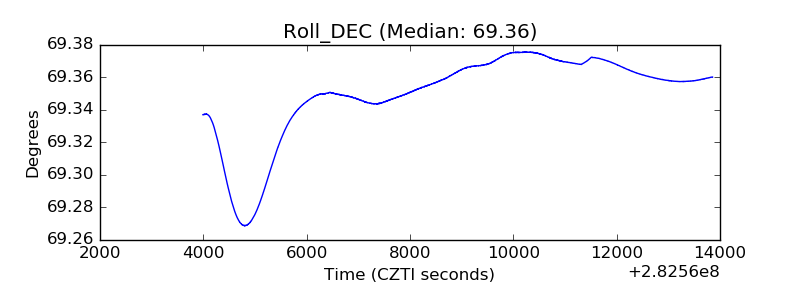 |
| _Roll_RA | 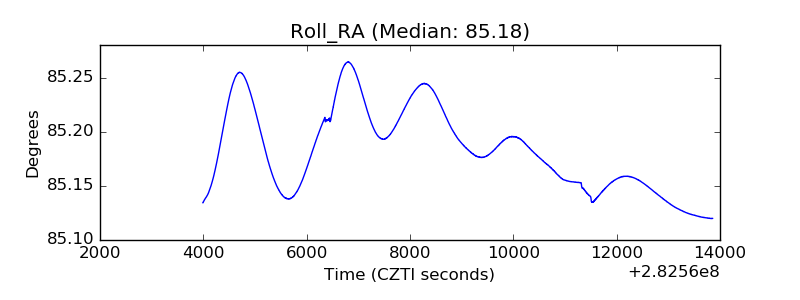 |
| Veto Counter |  |