| Param | Original file | Final file |
|---|---|---|
| Filename | modeM0/AS1A05_225T02_9000002570_17381cztM0_level2.evt | modeM0/AS1A05_225T02_9000002570_17381cztM0_level2_quad_clean.evt |
| Size (bytes) | 119,399,040 | 11,868,480 |
| Size | 113.9 MB | 11.3 MB |
| Events in quadrant A | 878,819 | 63,118 |
| Events in quadrant B | 870,550 | 63,774 |
| Events in quadrant C | 853,553 | 58,949 |
| Events in quadrant D | 905,056 | 58,274 |
| Mode M9 | |||
|---|---|---|---|
| Quadrant | BADHDUFLAG | Total packets | Discarded packets |
| A | 0 | 7 | 0 |
| B | 0 | 7 | 0 |
| C | 0 | 7 | 0 |
| D | 0 | 7 | 0 |
| Mode M0 | |||
|---|---|---|---|
| Quadrant | BADHDUFLAG | Total packets | Discarded packets |
| A | 0 | 3594 | 1 |
| B | 0 | 3547 | 2 |
| C | 0 | 3476 | 1 |
| D | 0 | 3624 | 1 |
| Mode SS | |||
|---|---|---|---|
| Quadrant | BADHDUFLAG | Total packets | Discarded packets |
| A | 0 | 32 | 0 |
| B | 0 | 32 | 0 |
| C | 0 | 32 | 0 |
| D | 0 | 32 | 0 |
| Quadrant | Total seconds | Saturated seconds | Saturation percentage |
|---|---|---|---|
| A | 1546 | 26 | 1.681759% |
| B | 1545 | 24 | 1.553398% |
| C | 1545 | 27 | 1.747573% |
| D | 1545 | 19 | 1.229773% |
Noise dominated data is calculated using 1-second bins in cleaned event files. If a bin has >2000 counts, and if more than 50% of those come from <1% of pixels, then it is considered to be noise-dominated and hence unusable.
| Quadrant | # 1 sec bins | Bins with >0 counts | Bins with >2000 counts | High rate bins dominated by noise | Noise dominated (total time) | Noise dominated (detector-on time) | Marked lightcurve |
|---|---|---|---|---|---|---|---|
| A | 1546 | 1546 | 0 | 0 | 0.00% | 0.00% | 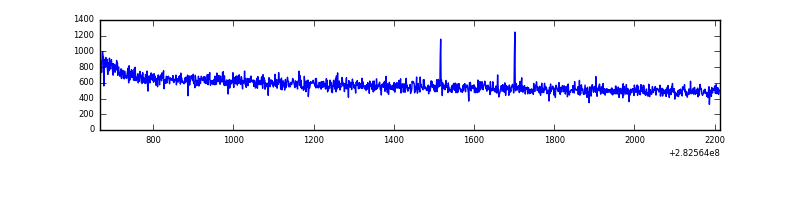 |
| B | 1545 | 1545 | 0 | 0 | 0.00% | 0.00% | 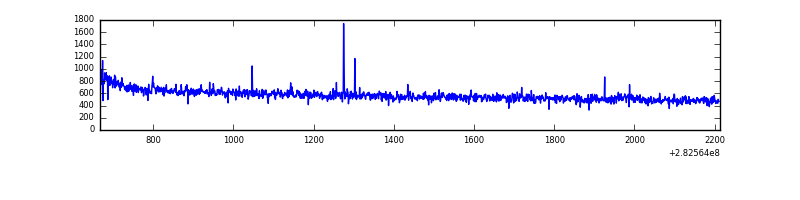 |
| C | 1545 | 1545 | 0 | 0 | 0.00% | 0.00% | 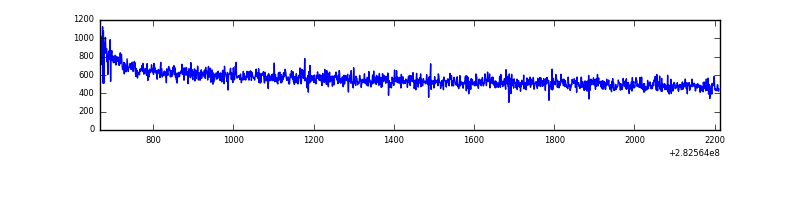 |
| D | 1545 | 1545 | 4 | 4 | 0.26% | 0.26% | 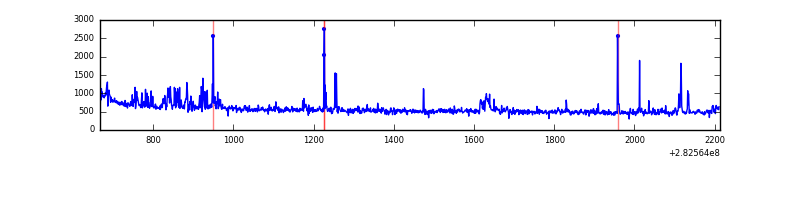 |
Top three noisy pixels from each quadrant. If the there are fewer than three noisy pixels in the level2.evt file, extra rows are filled as -1
| Pixel properties | Quadrant properties | ||||||
|---|---|---|---|---|---|---|---|
| Quadrant | DetID | PixID | Counts | Sigma | Mean | Median | Sigma |
| A | 9 | 143 | 3769 | 76.38 | 227 | 223 | 46.4 |
| A | 0 | 226 | 2101 | 40.45 | 227 | 223 | 46.4 |
| A | 12 | 194 | 1728 | 32.42 | 227 | 223 | 46.4 |
| B | 12 | 111 | 4779 | 106.43 | 221 | 216 | 42.9 |
| B | 11 | 111 | 4275 | 94.67 | 221 | 216 | 42.9 |
| B | 4 | 80 | 3746 | 82.33 | 221 | 216 | 42.9 |
| C | 14 | 238 | 34935 | 708.59 | 208 | 209 | 49.0 |
| C | 3 | 233 | 4348 | 84.46 | 208 | 209 | 49.0 |
| C | 13 | 61 | 1502 | 26.38 | 208 | 209 | 49.0 |
| D | 13 | 232 | 39448 | 741.63 | 214 | 208 | 52.9 |
| D | 11 | 176 | 19292 | 360.68 | 214 | 208 | 52.9 |
| D | 13 | 189 | 15404 | 287.2 | 214 | 208 | 52.9 |
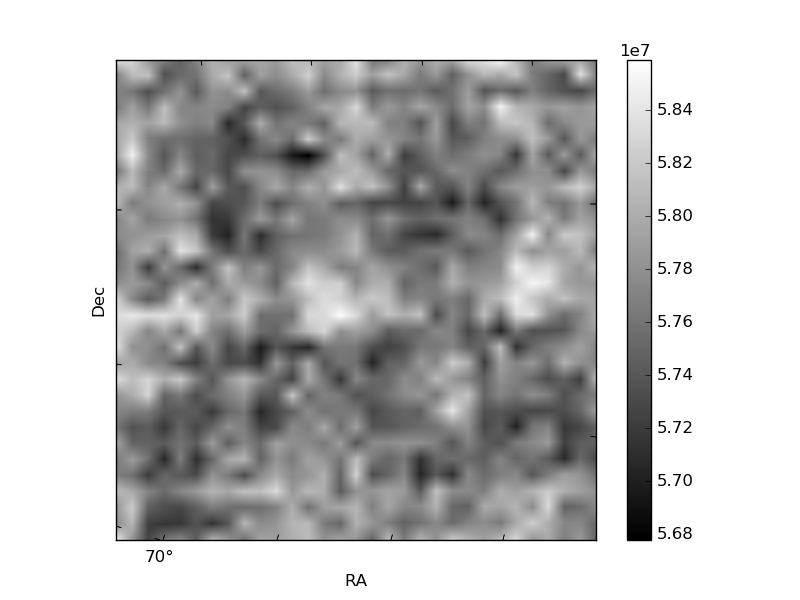
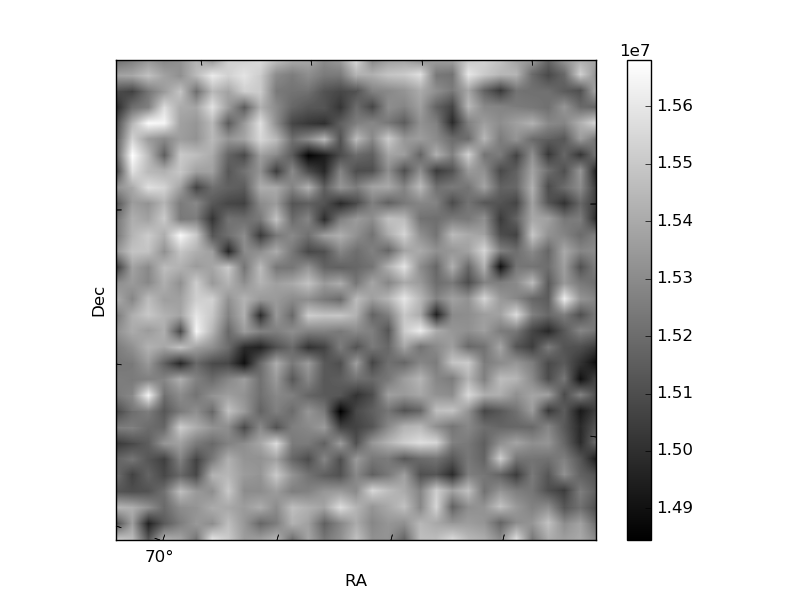
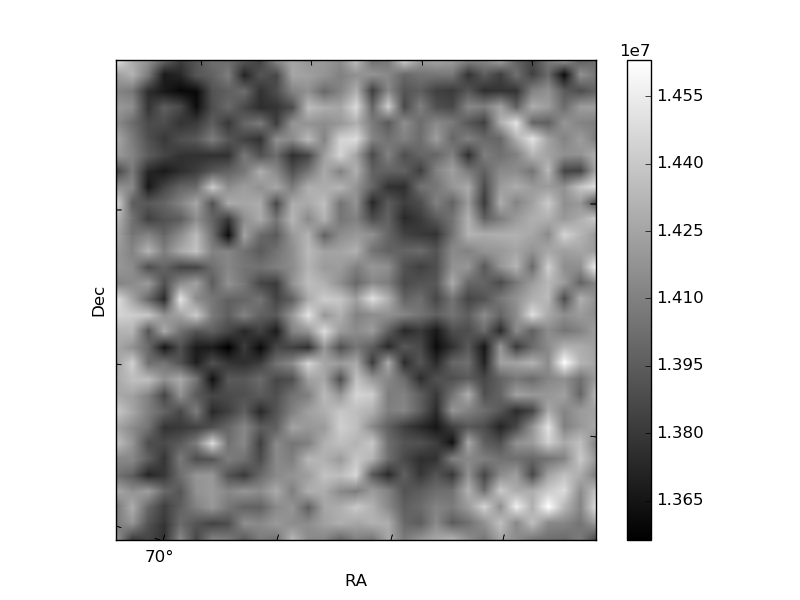
Histogram calculated using DETX and DETY for each event in the final _common_clean file
| Quadrant A | 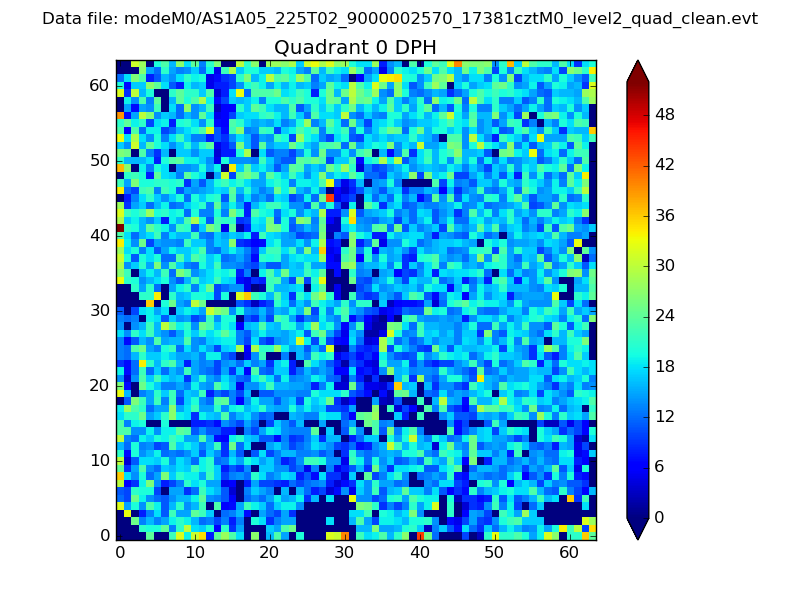 |
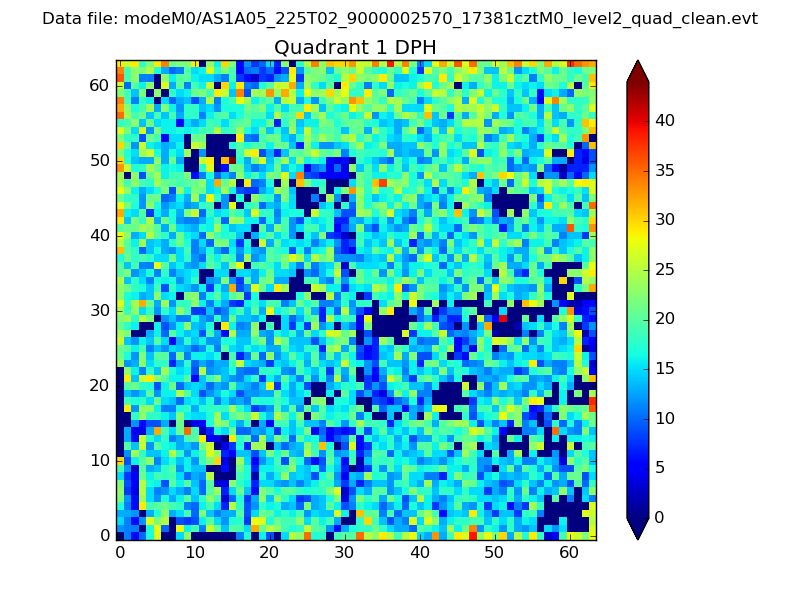 |
Quadrant B |
|---|---|---|---|
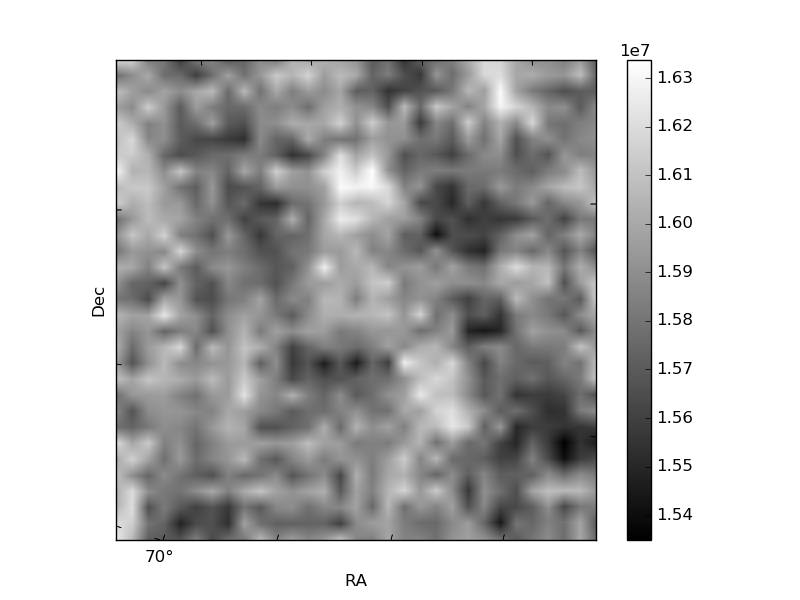
| Quadrant D | 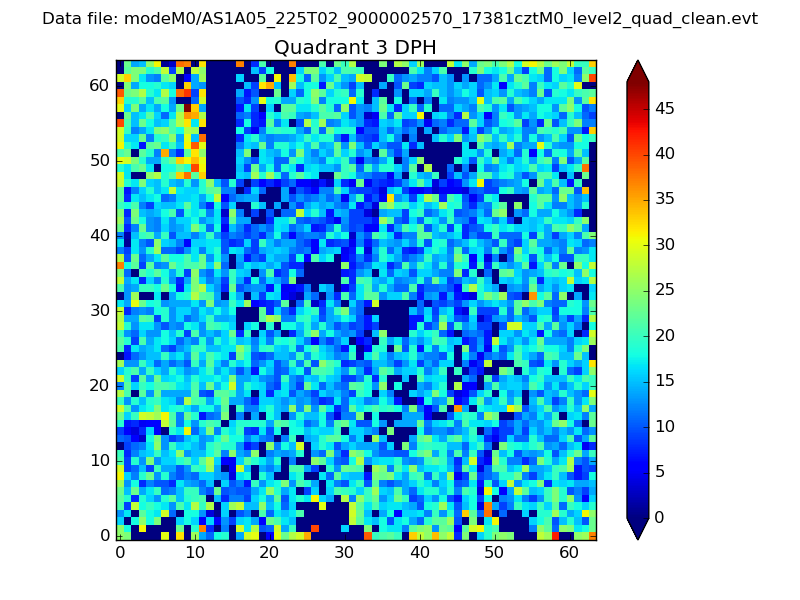 |
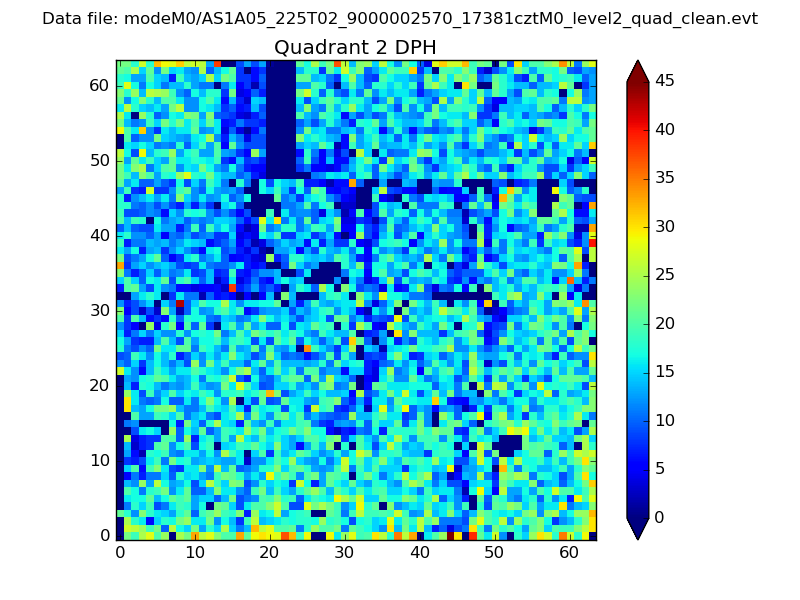 |
Quadrant C |
| Plot type | Count rate plots | Images |
|---|---|---|
| Comparison with Poisson distribution Blue bars denote a histogram of data divided into 1 sec bins. Red curve is a Poisson curve with rate = median count rate of data. |
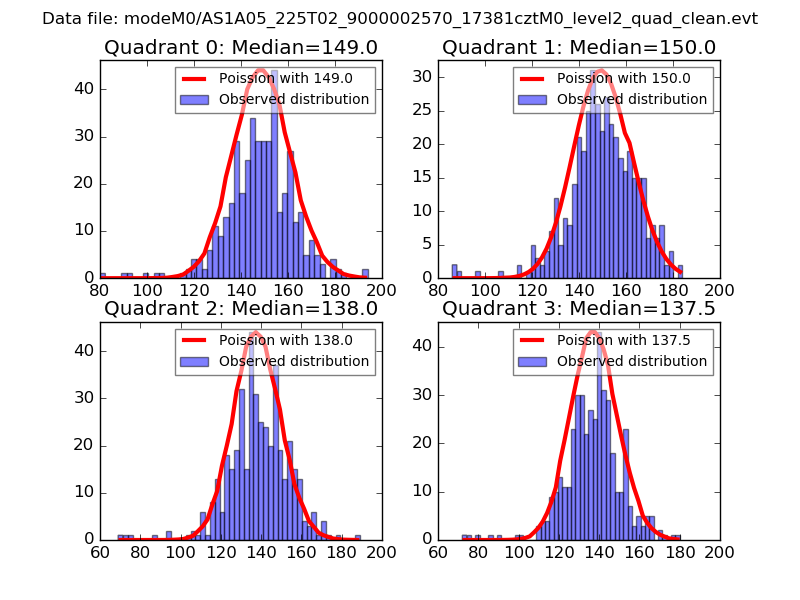 |
 |
| Quadrant-wise count rates Data is divided into 100 sec bins |
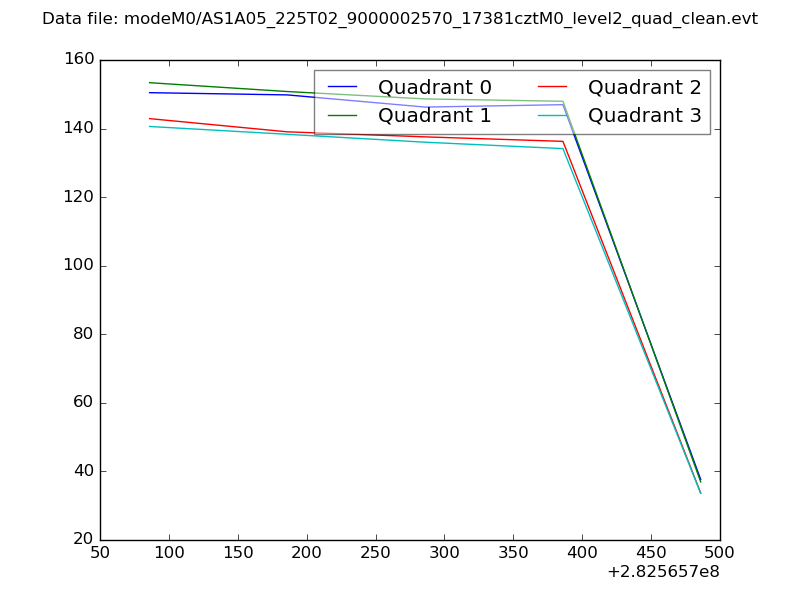 |
|
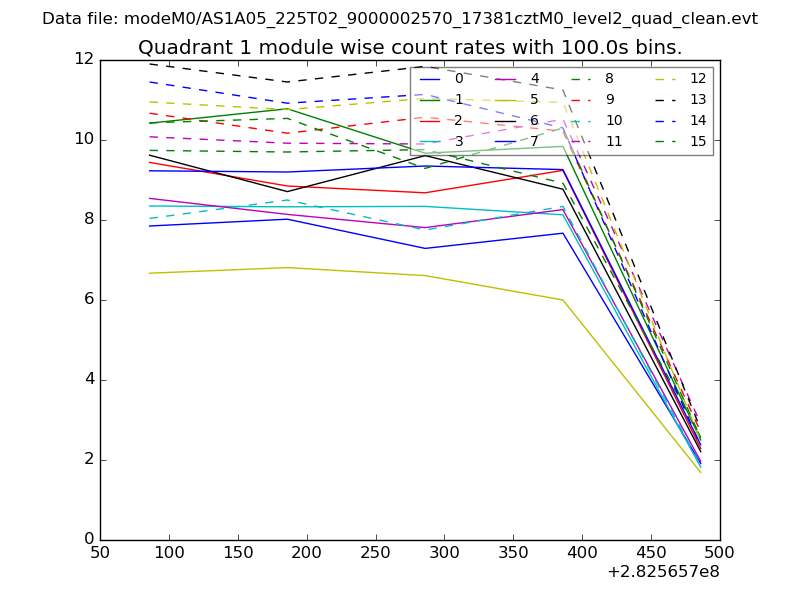
| Module-wise count rates for Quadrant A Data is divided into 100 sec bins |
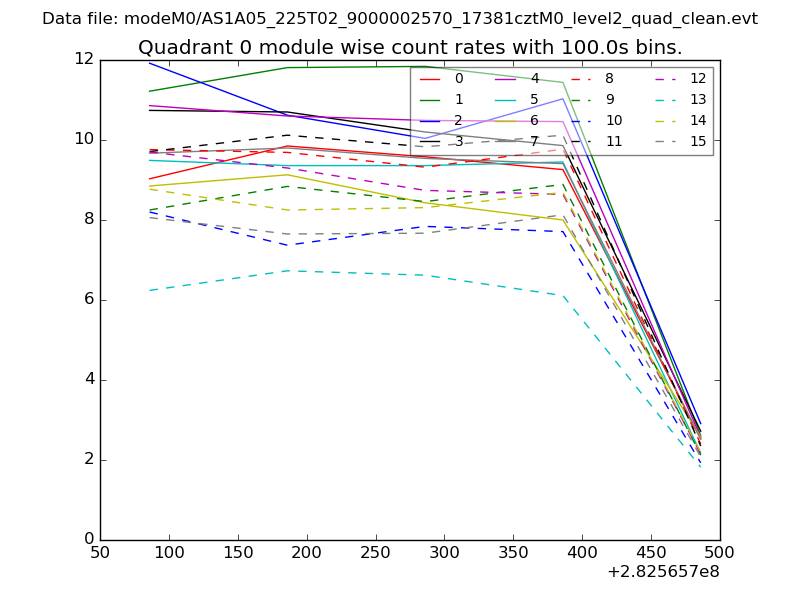 |
 |
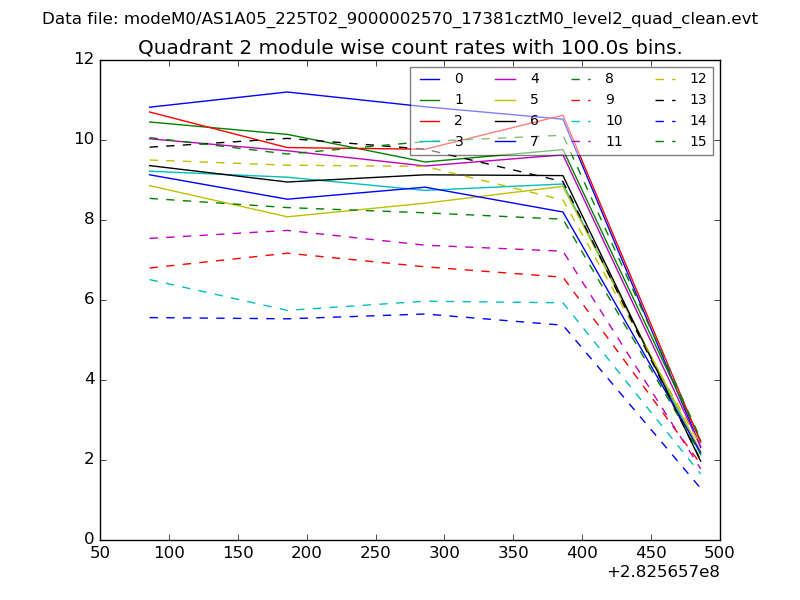
| Module-wise count rates for Quadrant B Data is divided into 100 sec bins |
 |
 |
| Module-wise count rates for Quadrant C Data is divided into 100 sec bins |
 |
 |
| Module-wise count rates for Quadrant D Data is divided into 100 sec bins |
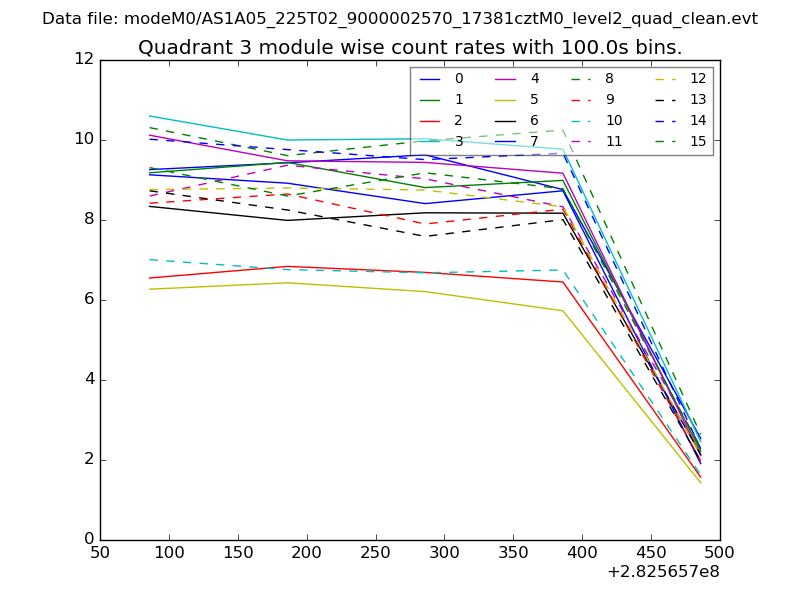 |
 |
| Parameter | Plot |
|---|---|
| CZT HV Monitor | 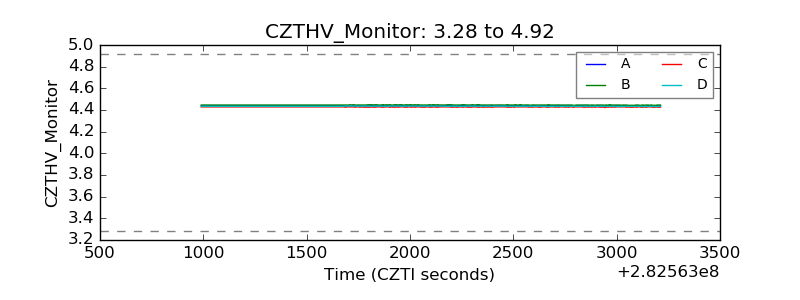 |
| D_VDD | 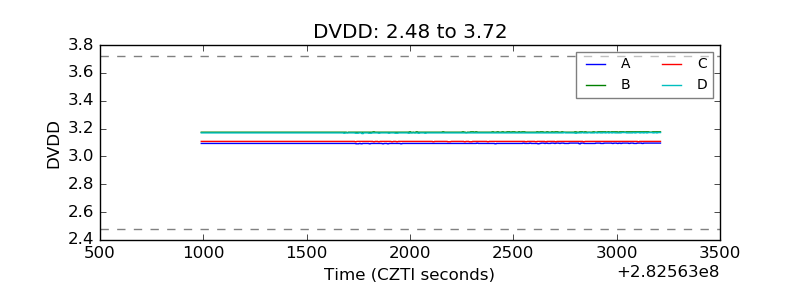 |
| Temperature 1 | 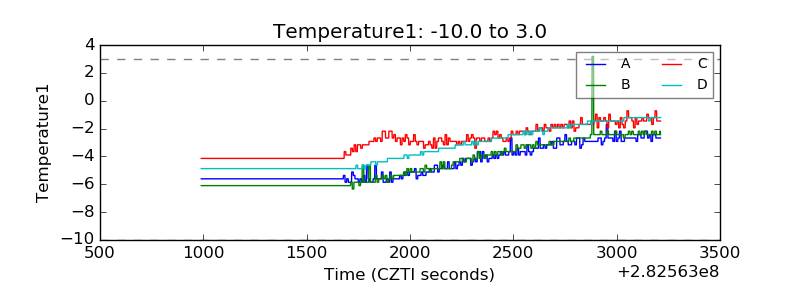 |
| Veto HV Monitor | 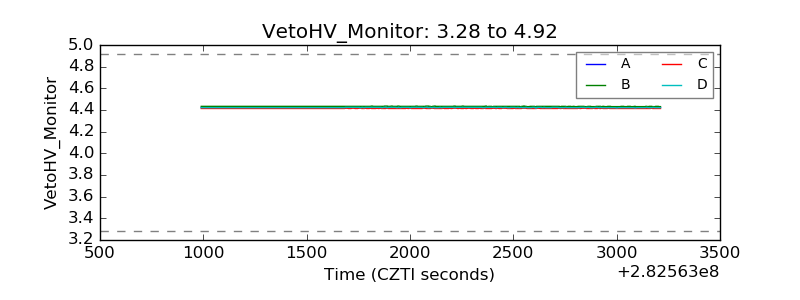 |
| Veto LLD |  |
| Alpha Counter | 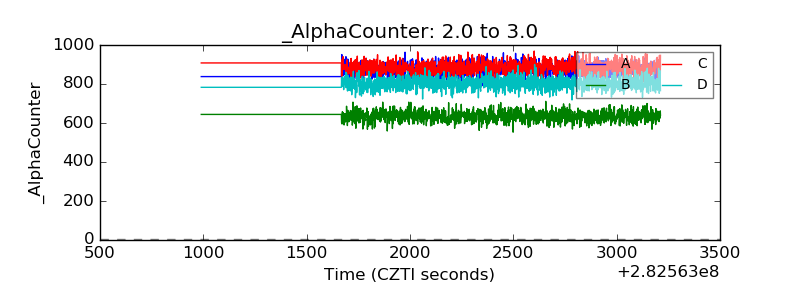 |
| _CPM_Rate | 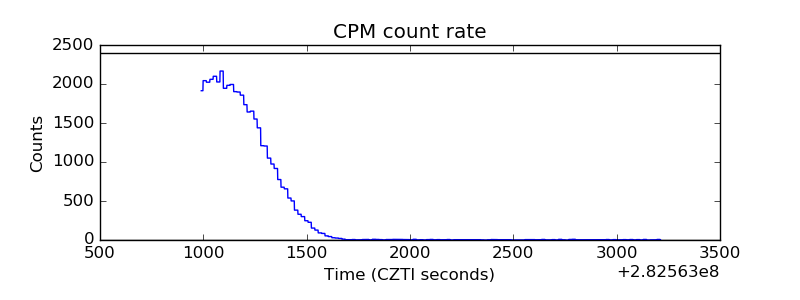 |
| CZT Counter | 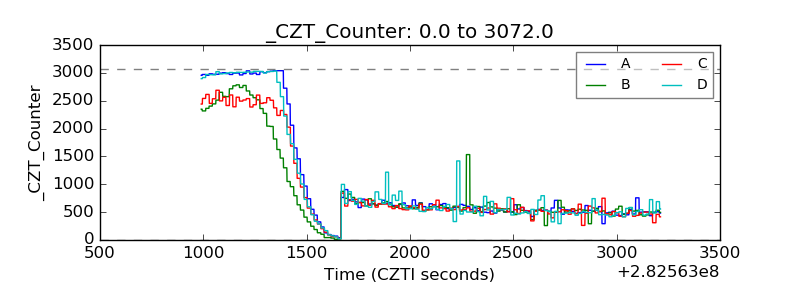 |
| +2.5 Volts monitor |  |
| +5 Volts monitor | 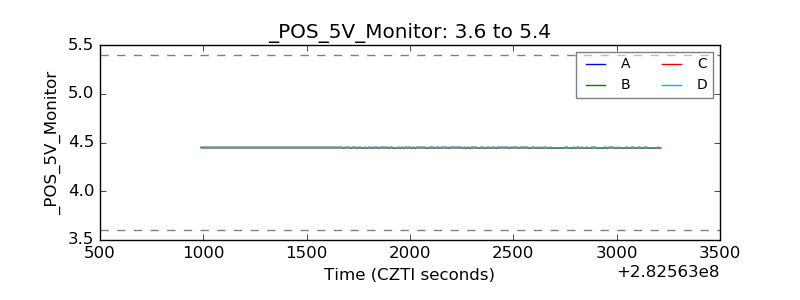 |
| _ROLL_ROT | 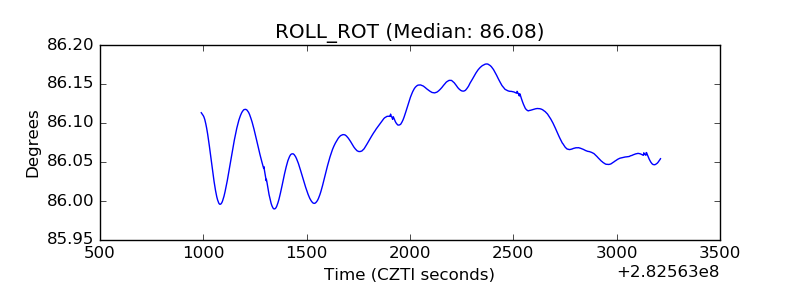 |
| _Roll_DEC | 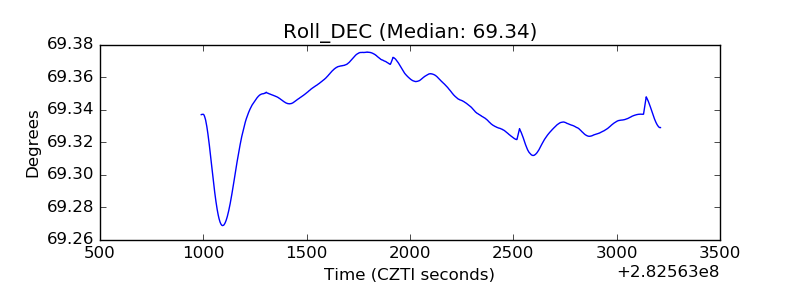 |
| _Roll_RA | 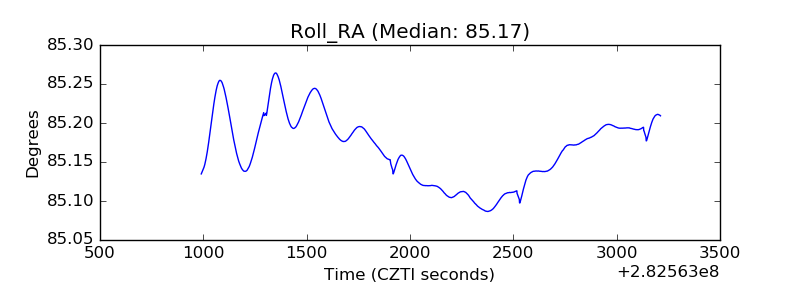 |
| Veto Counter | 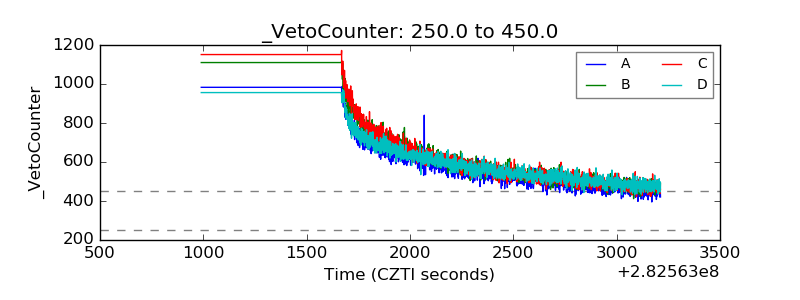 |