| Param | Original file | Final file |
|---|---|---|
| Filename | modeM0/AS1A05_225T02_9000002570_17382cztM0_level2.evt | modeM0/AS1A05_225T02_9000002570_17382cztM0_level2_quad_clean.evt |
| Size (bytes) | 497,908,800 | 99,815,040 |
| Size | 474.8 MB | 95.2 MB |
| Events in quadrant A | 3,319,544 | 669,851 |
| Events in quadrant B | 3,231,847 | 671,432 |
| Events in quadrant C | 3,210,240 | 634,172 |
| Events in quadrant D | 4,891,351 | 608,792 |
| Mode M9 | |||
|---|---|---|---|
| Quadrant | BADHDUFLAG | Total packets | Discarded packets |
| A | 0 | 13 | 0 |
| B | 0 | 13 | 0 |
| C | 0 | 13 | 0 |
| D | 0 | 13 | 0 |
| Mode M0 | |||
|---|---|---|---|
| Quadrant | BADHDUFLAG | Total packets | Discarded packets |
| A | 0 | 13883 | 1 |
| B | 0 | 13597 | 1 |
| C | 0 | 13417 | 2 |
| D | 0 | 18677 | 1 |
| Mode SS | |||
|---|---|---|---|
| Quadrant | BADHDUFLAG | Total packets | Discarded packets |
| A | 0 | 128 | 0 |
| B | 0 | 128 | 0 |
| C | 0 | 128 | 0 |
| D | 0 | 128 | 0 |
| Quadrant | Total seconds | Saturated seconds | Saturation percentage |
|---|---|---|---|
| A | 6283 | 93 | 1.480185% |
| B | 6283 | 64 | 1.018622% |
| C | 6282 | 76 | 1.209806% |
| D | 6282 | 379 | 6.033110% |
Noise dominated data is calculated using 1-second bins in cleaned event files. If a bin has >2000 counts, and if more than 50% of those come from <1% of pixels, then it is considered to be noise-dominated and hence unusable.
| Quadrant | # 1 sec bins | Bins with >0 counts | Bins with >2000 counts | High rate bins dominated by noise | Noise dominated (total time) | Noise dominated (detector-on time) | Marked lightcurve |
|---|---|---|---|---|---|---|---|
| A | 7558 | 6283 | 48 | 48 | 0.64% | 0.76% | 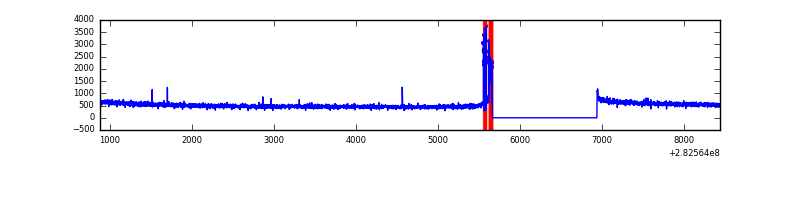 |
| B | 7558 | 6283 | 0 | 0 | 0.00% | 0.00% | 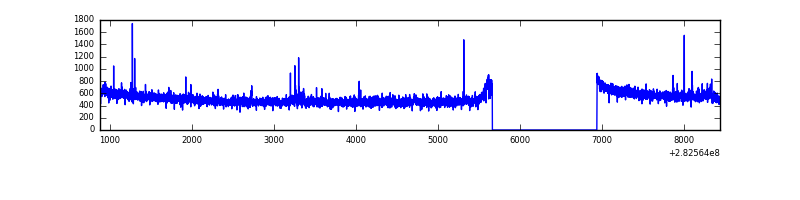 |
| C | 7557 | 6283 | 0 | 0 | 0.00% | 0.00% | 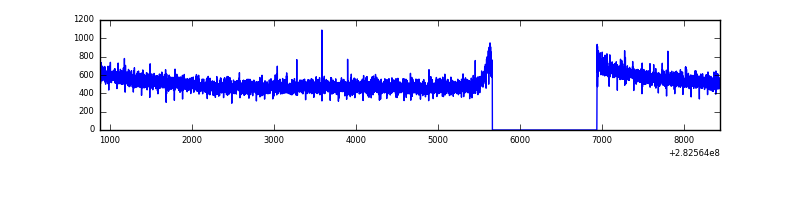 |
| D | 7557 | 6283 | 295 | 295 | 3.90% | 4.70% | 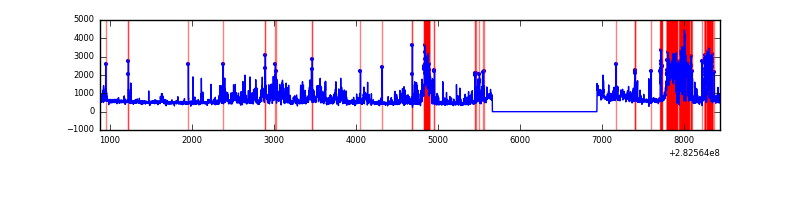 |
Top three noisy pixels from each quadrant. If the there are fewer than three noisy pixels in the level2.evt file, extra rows are filled as -1
| Pixel properties | Quadrant properties | ||||||
|---|---|---|---|---|---|---|---|
| Quadrant | DetID | PixID | Counts | Sigma | Mean | Median | Sigma |
| A | 9 | 143 | 139532 | 851.57 | 826 | 810 | 162.9 |
| A | 0 | 226 | 7389 | 40.38 | 826 | 810 | 162.9 |
| A | 12 | 194 | 6240 | 33.33 | 826 | 810 | 162.9 |
| B | 4 | 216 | 24181 | 152.98 | 818 | 799 | 152.8 |
| B | 12 | 111 | 17260 | 107.7 | 818 | 799 | 152.8 |
| B | 11 | 111 | 14931 | 92.46 | 818 | 799 | 152.8 |
| C | 14 | 238 | 127992 | 706.88 | 787 | 793 | 179.9 |
| C | 3 | 233 | 13438 | 70.27 | 787 | 793 | 179.9 |
| C | 13 | 61 | 5606 | 26.75 | 787 | 793 | 179.9 |
| D | 11 | 176 | 1340344 | 7030.86 | 791 | 770 | 190.5 |
| D | 13 | 232 | 367430 | 1924.45 | 791 | 770 | 190.5 |
| D | 13 | 189 | 65938 | 342.04 | 791 | 770 | 190.5 |
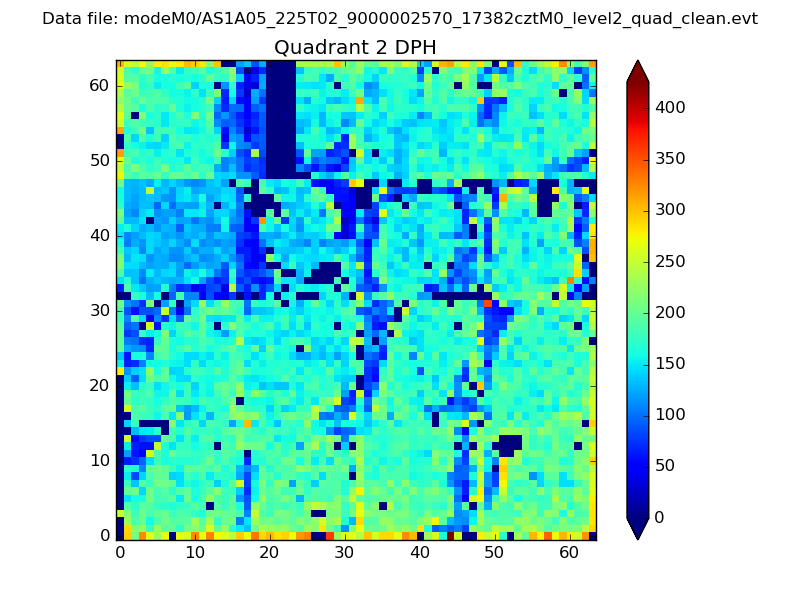
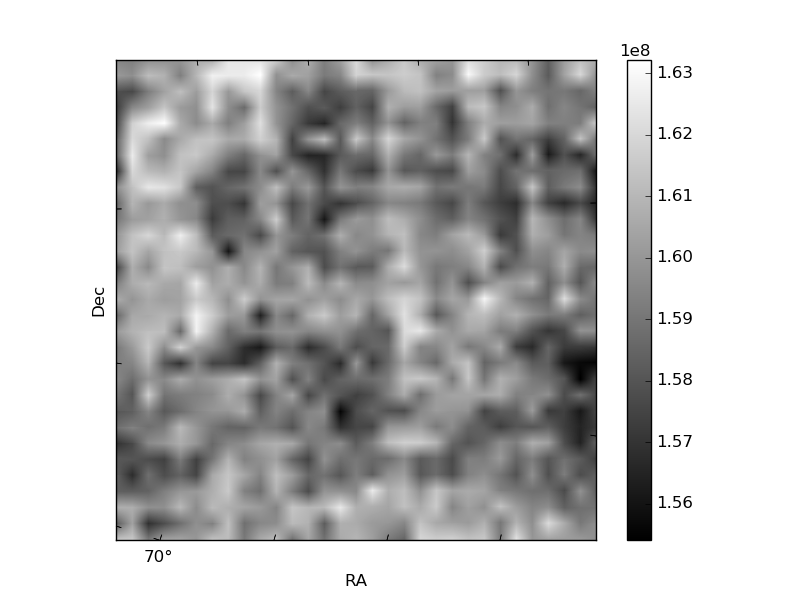
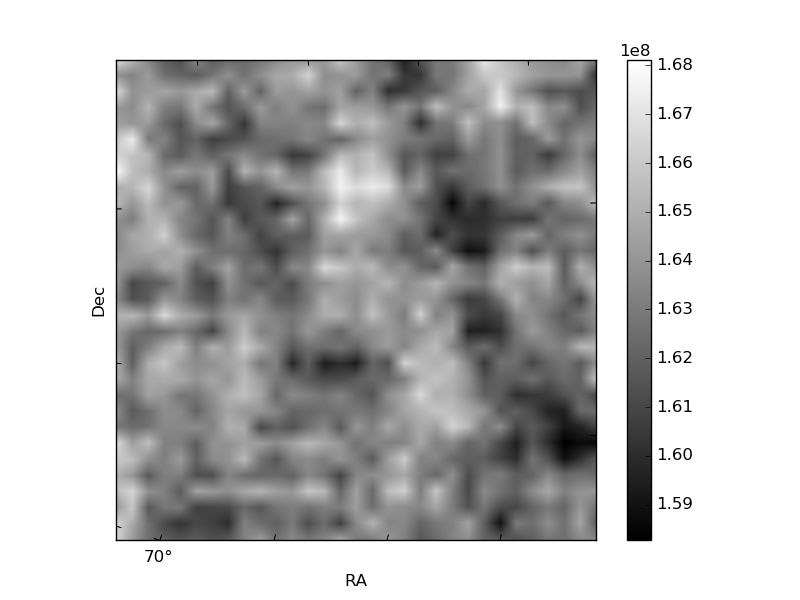
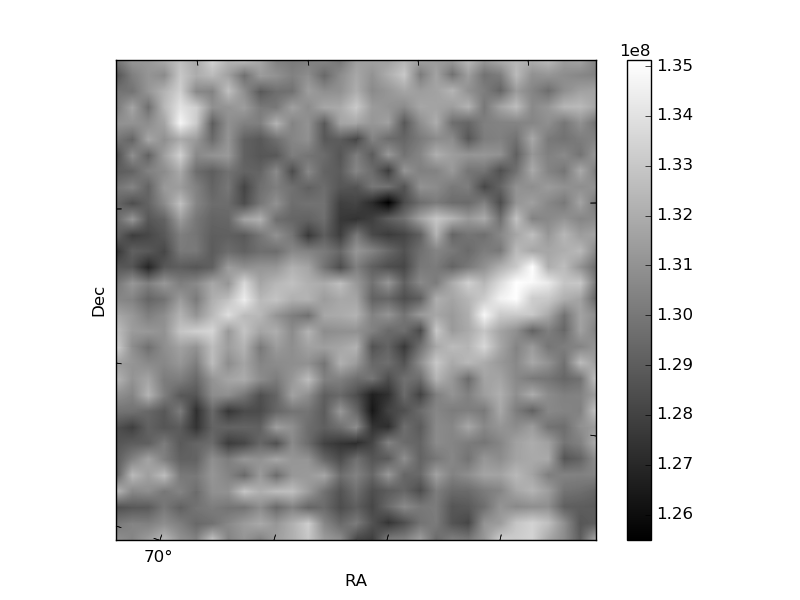
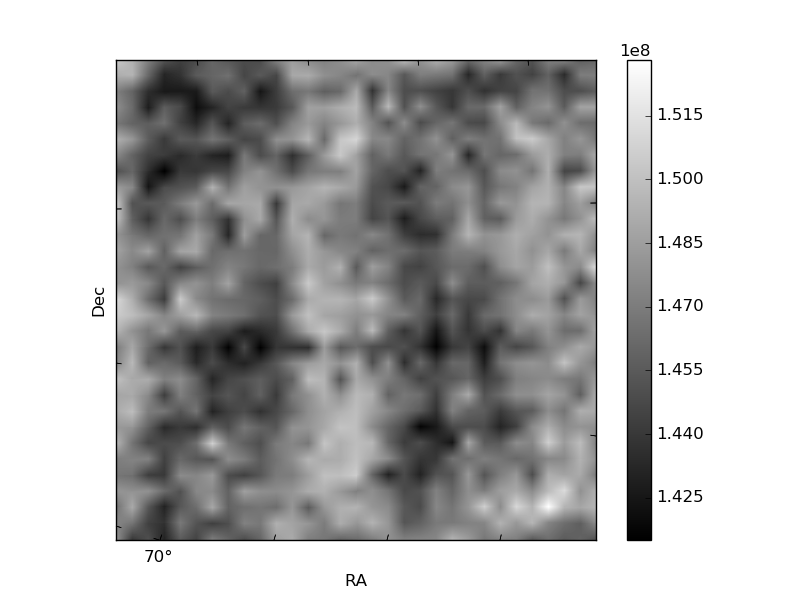
Histogram calculated using DETX and DETY for each event in the final _common_clean file
| Quadrant A |  |
 |
Quadrant B |
|---|---|---|---|
| Quadrant D |  |
 |
Quadrant C |
| Plot type | Count rate plots | Images |
|---|---|---|
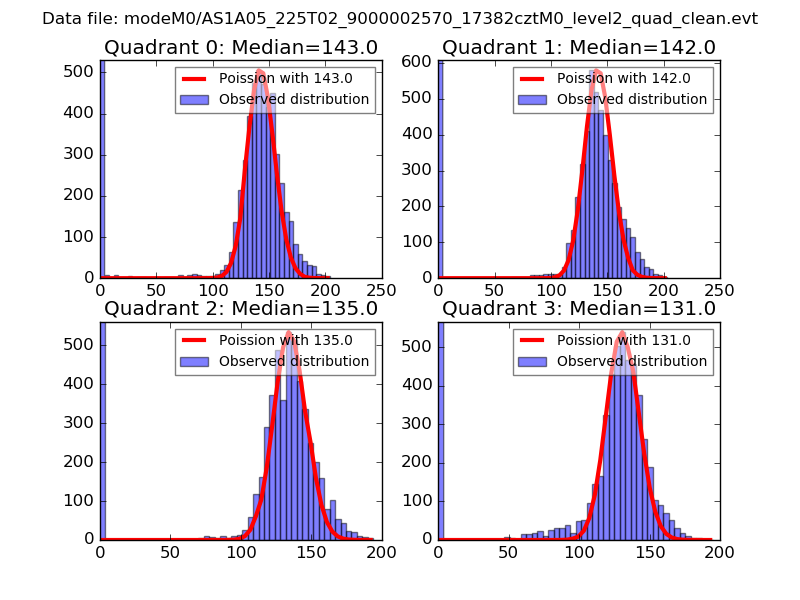
| Comparison with Poisson distribution Blue bars denote a histogram of data divided into 1 sec bins. Red curve is a Poisson curve with rate = median count rate of data. |
 |
 |
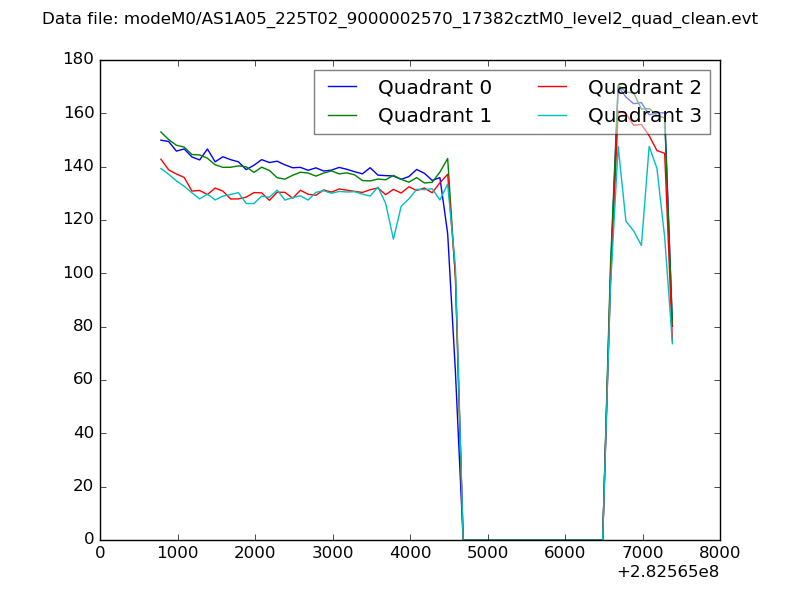
| Quadrant-wise count rates Data is divided into 100 sec bins |
 |
|
| Module-wise count rates for Quadrant A Data is divided into 100 sec bins |
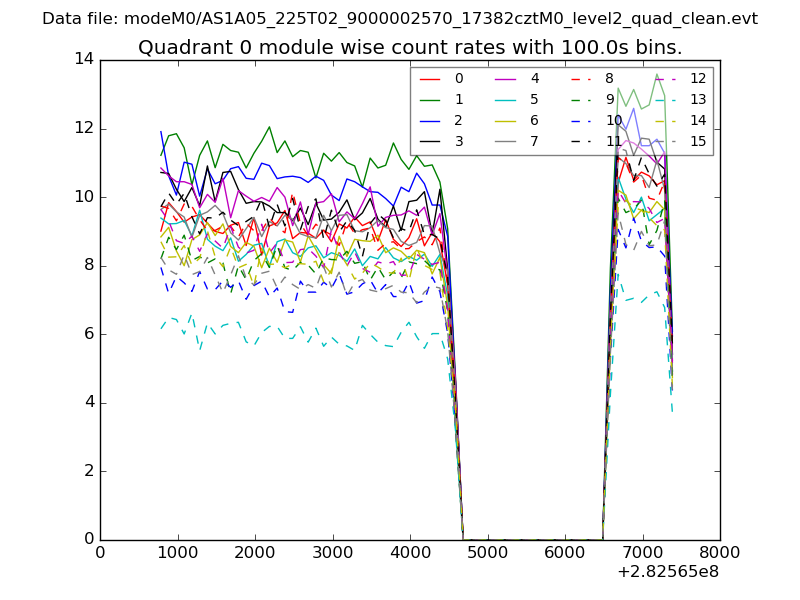 |
 |
| Module-wise count rates for Quadrant B Data is divided into 100 sec bins |
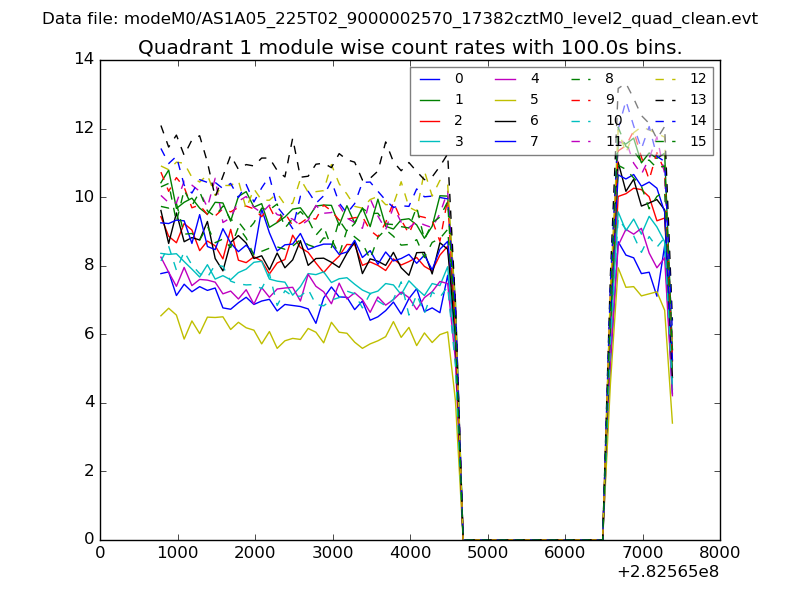 |
 |
| Module-wise count rates for Quadrant C Data is divided into 100 sec bins |
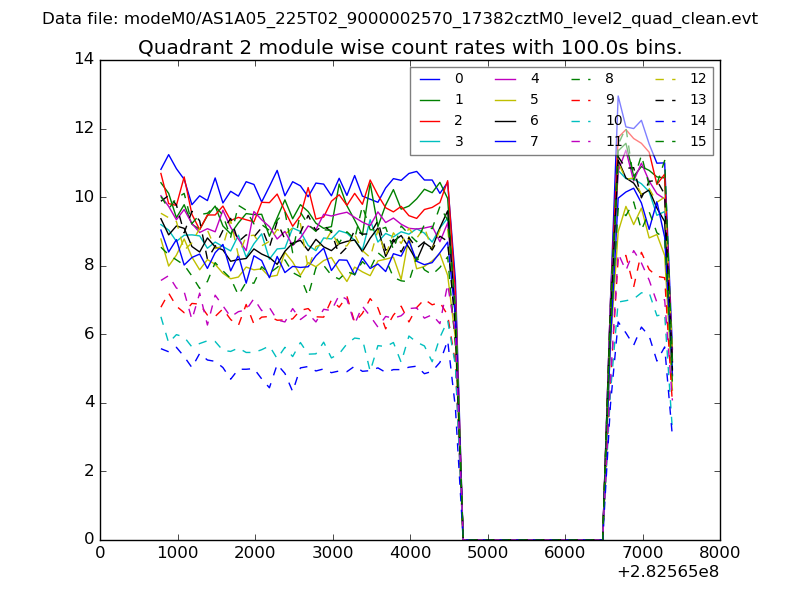 |
 |
| Module-wise count rates for Quadrant D Data is divided into 100 sec bins |
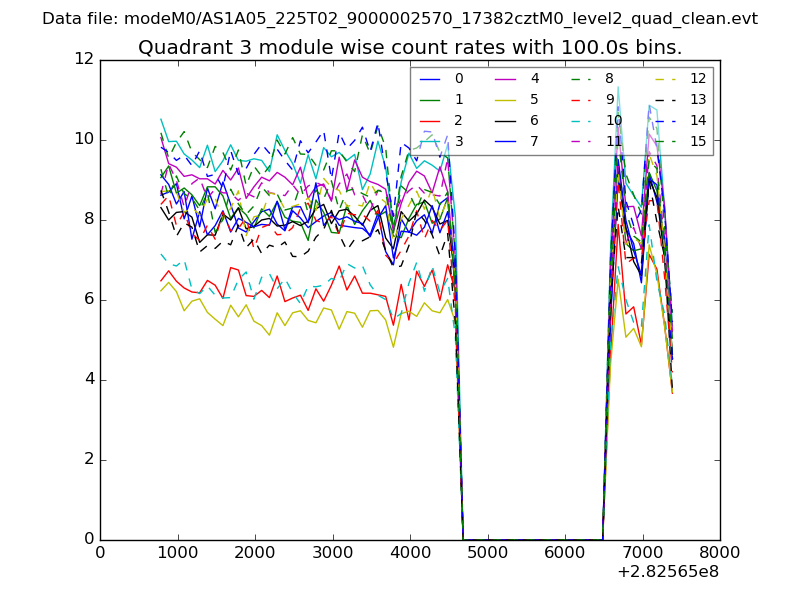 |
 |
| Parameter | Plot |
|---|---|
| CZT HV Monitor | 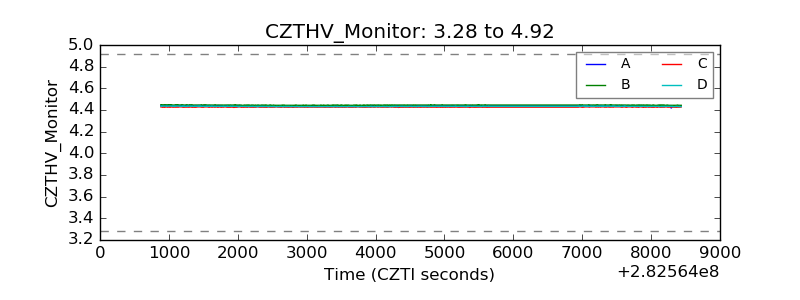 |
| D_VDD | 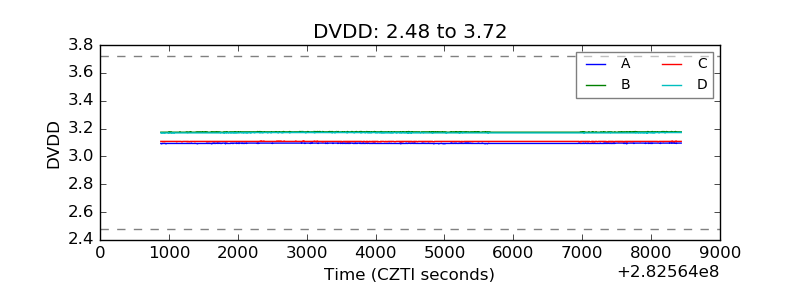 |
| Temperature 1 | 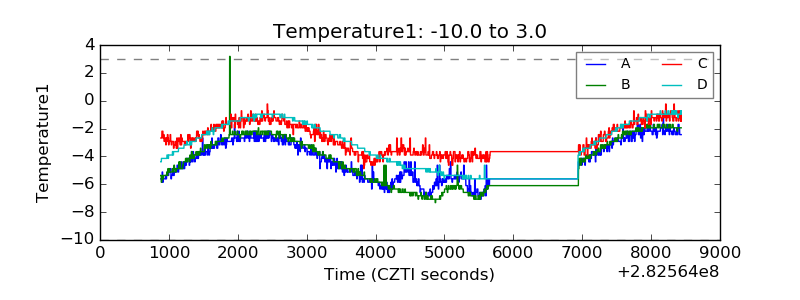 |
| Veto HV Monitor | 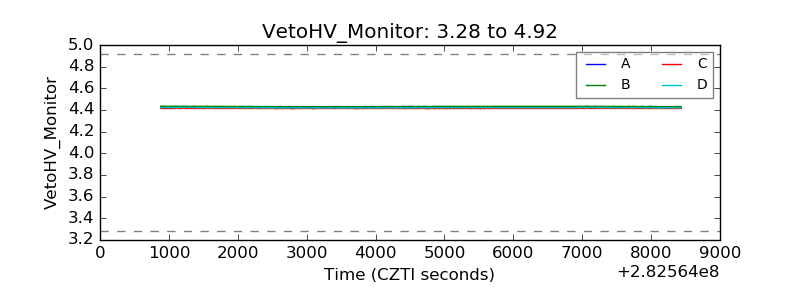 |
| Veto LLD | 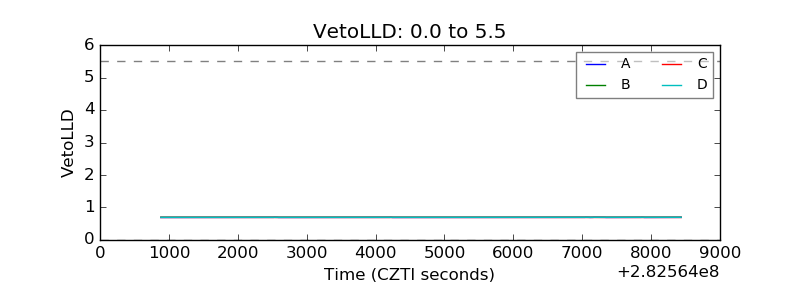 |
| Alpha Counter | 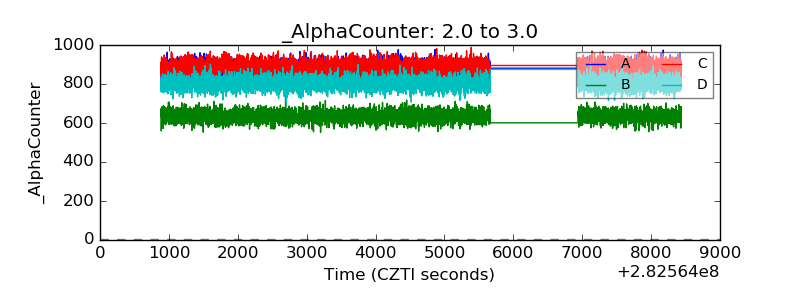 |
| _CPM_Rate | 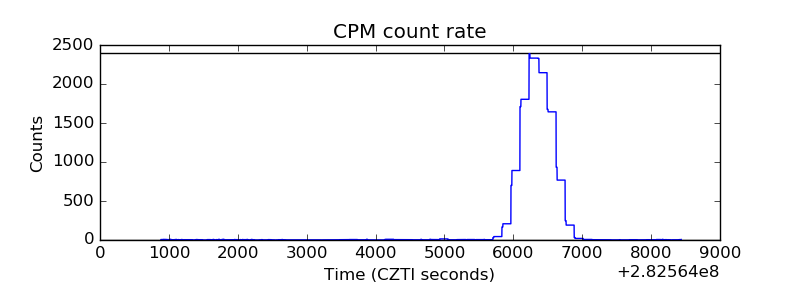 |
| CZT Counter | 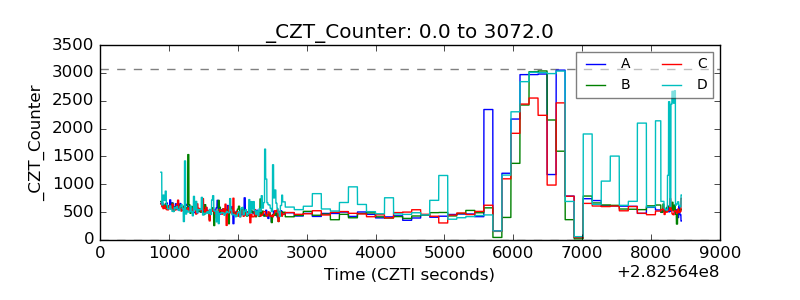 |
| +2.5 Volts monitor | 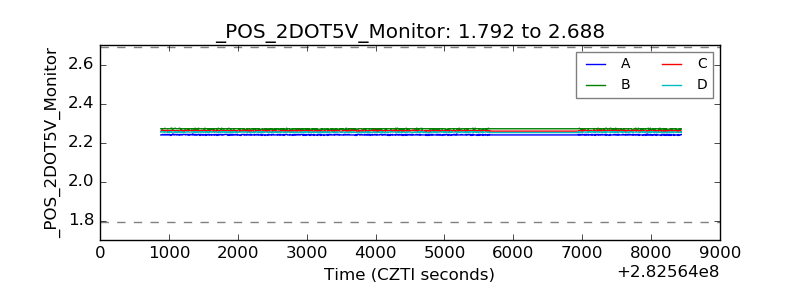 |
| +5 Volts monitor |  |
| _ROLL_ROT | 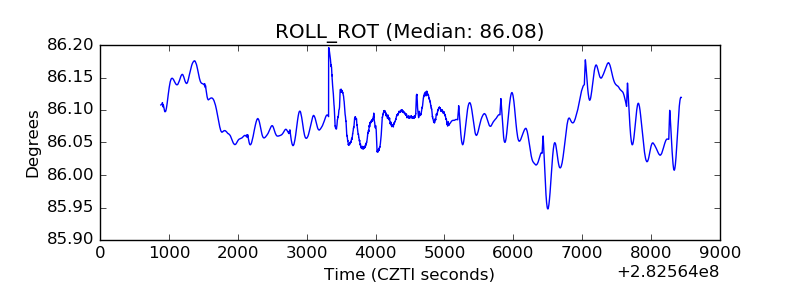 |
| _Roll_DEC | 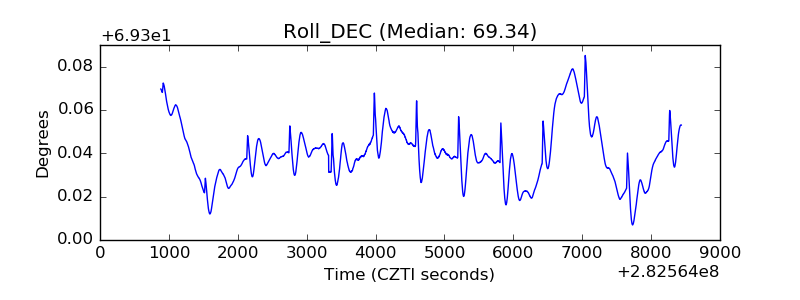 |
| _Roll_RA | 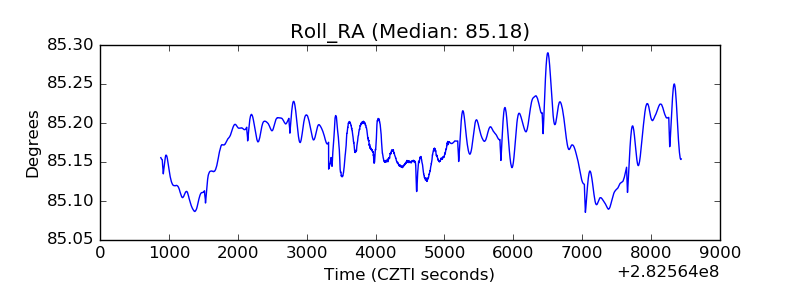 |
| Veto Counter | 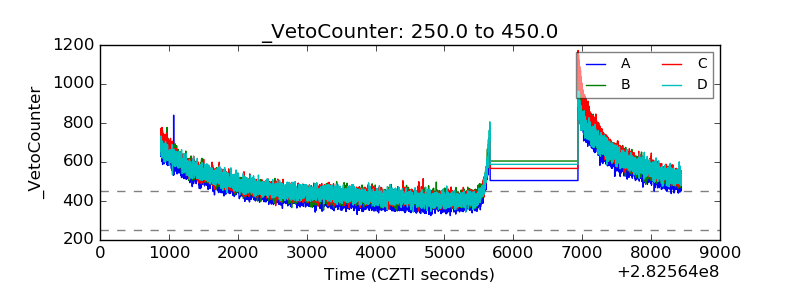 |