| Param | Original file | Final file |
|---|---|---|
| Filename | modeM0/AS1A05_225T02_9000002570_17383cztM0_level2.evt | modeM0/AS1A05_225T02_9000002570_17383cztM0_level2_quad_clean.evt |
| Size (bytes) | 239,564,160 | 49,654,080 |
| Size | 228.5 MB | 47.4 MB |
| Events in quadrant A | 1,459,002 | 343,770 |
| Events in quadrant B | 1,475,466 | 340,946 |
| Events in quadrant C | 1,461,890 | 320,008 |
| Events in quadrant D | 2,667,695 | 299,160 |
| Mode M0 | |||
|---|---|---|---|
| Quadrant | BADHDUFLAG | Total packets | Discarded packets |
| A | 0 | 6054 | 0 |
| B | 0 | 6128 | 0 |
| C | 0 | 6003 | 0 |
| D | 0 | 9875 | 0 |
| Mode SS | |||
|---|---|---|---|
| Quadrant | BADHDUFLAG | Total packets | Discarded packets |
| A | 0 | 56 | 0 |
| B | 0 | 56 | 0 |
| C | 0 | 56 | 0 |
| D | 0 | 56 | 0 |
| Quadrant | Total seconds | Saturated seconds | Saturation percentage |
|---|---|---|---|
| A | 2789 | 7 | 0.250986% |
| B | 2790 | 4 | 0.143369% |
| C | 2790 | 8 | 0.286738% |
| D | 2790 | 285 | 10.215054% |
Noise dominated data is calculated using 1-second bins in cleaned event files. If a bin has >2000 counts, and if more than 50% of those come from <1% of pixels, then it is considered to be noise-dominated and hence unusable.
| Quadrant | # 1 sec bins | Bins with >0 counts | Bins with >2000 counts | High rate bins dominated by noise | Noise dominated (total time) | Noise dominated (detector-on time) | Marked lightcurve |
|---|---|---|---|---|---|---|---|
| A | 2789 | 2789 | 0 | 0 | 0.00% | 0.00% | 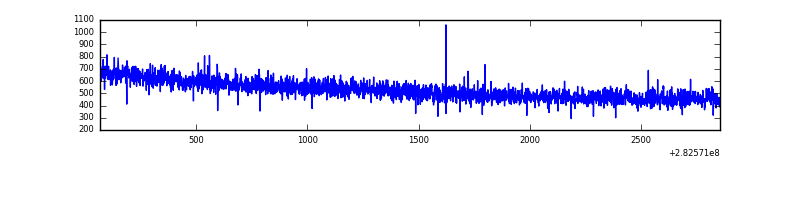 |
| B | 2790 | 2790 | 1 | 1 | 0.04% | 0.04% | 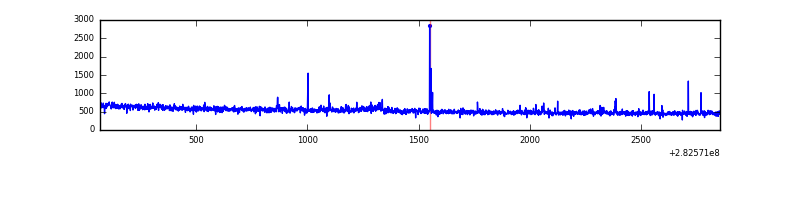 |
| C | 2790 | 2790 | 0 | 0 | 0.00% | 0.00% | 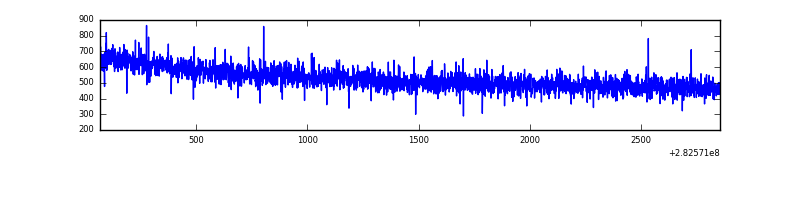 |
| D | 2790 | 2790 | 253 | 253 | 9.07% | 9.07% | 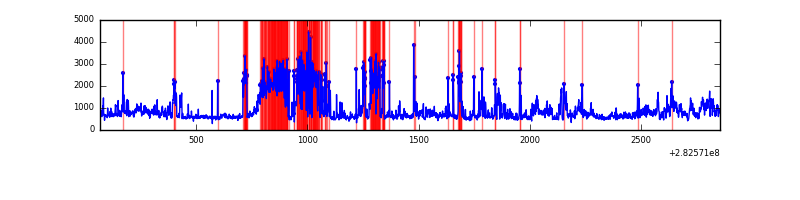 |
Top three noisy pixels from each quadrant. If the there are fewer than three noisy pixels in the level2.evt file, extra rows are filled as -1
| Pixel properties | Quadrant properties | ||||||
|---|---|---|---|---|---|---|---|
| Quadrant | DetID | PixID | Counts | Sigma | Mean | Median | Sigma |
| A | 0 | 226 | 3392 | 40.25 | 379 | 372 | 75.0 |
| A | 12 | 194 | 2786 | 32.18 | 379 | 372 | 75.0 |
| A | 3 | 137 | 2400 | 27.03 | 379 | 372 | 75.0 |
| B | 4 | 216 | 14483 | 202.82 | 370 | 362 | 69.6 |
| B | 0 | 189 | 11470 | 159.54 | 370 | 362 | 69.6 |
| B | 12 | 111 | 7126 | 97.15 | 370 | 362 | 69.6 |
| C | 14 | 238 | 58378 | 703.77 | 357 | 360 | 82.4 |
| C | 3 | 233 | 7413 | 85.55 | 357 | 360 | 82.4 |
| C | 13 | 61 | 2558 | 26.66 | 357 | 360 | 82.4 |
| D | 11 | 176 | 1145358 | 13176.36 | 355 | 346 | 86.9 |
| D | 10 | 70 | 67148 | 768.73 | 355 | 346 | 86.9 |
| D | 13 | 189 | 39969 | 455.97 | 355 | 346 | 86.9 |
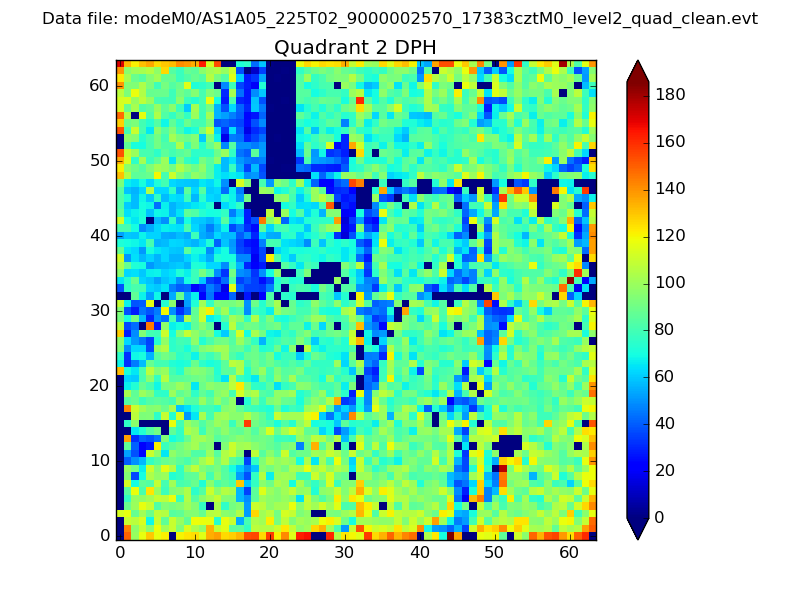
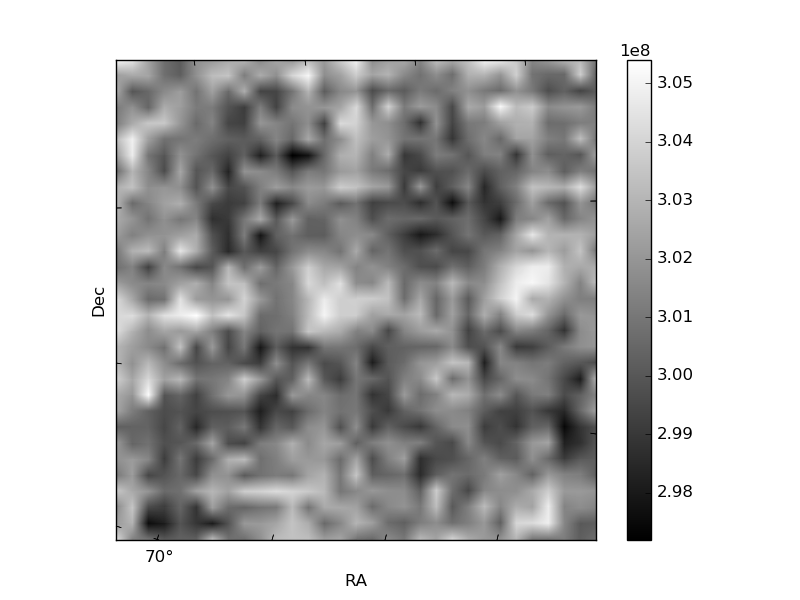
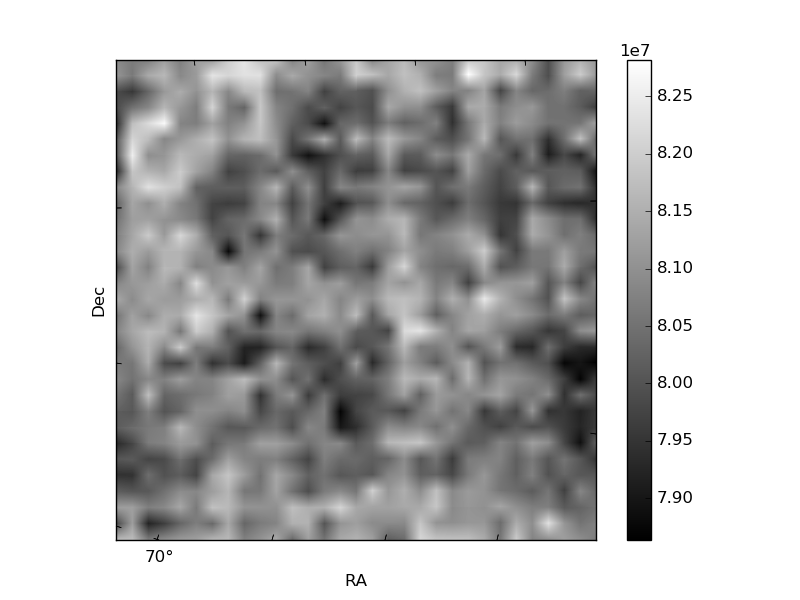
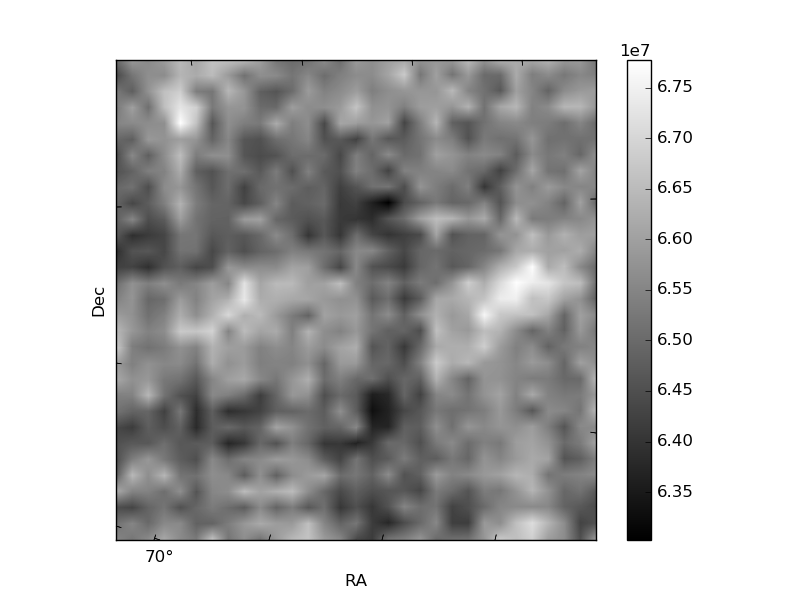
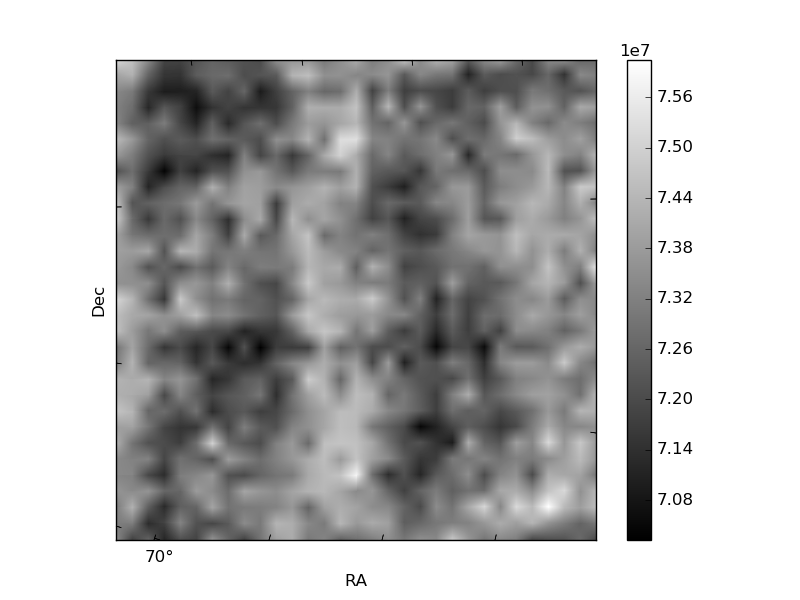
Histogram calculated using DETX and DETY for each event in the final _common_clean file
| Quadrant A | 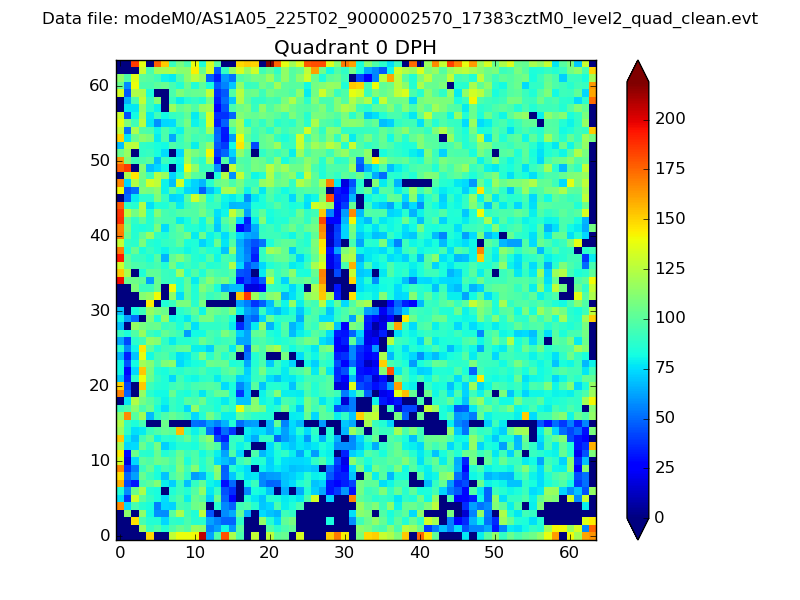 |
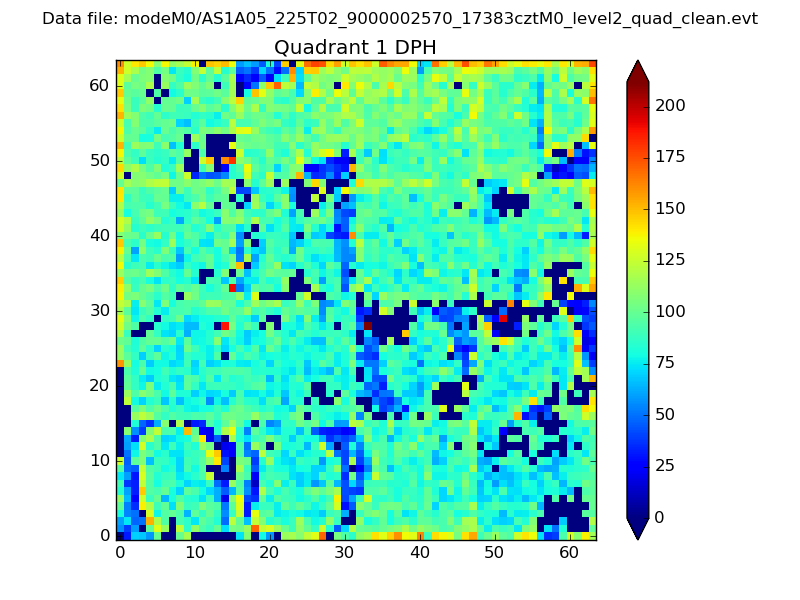 |
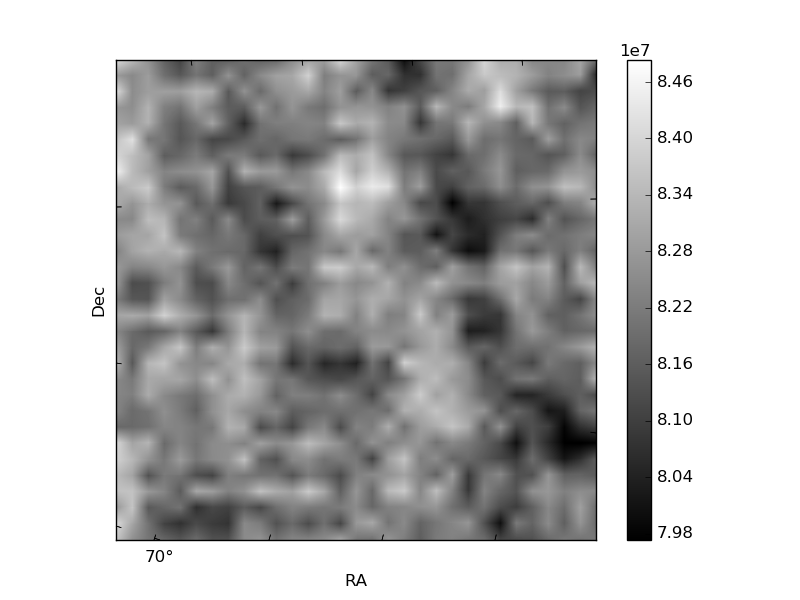
Quadrant B |
|---|---|---|---|
| Quadrant D | 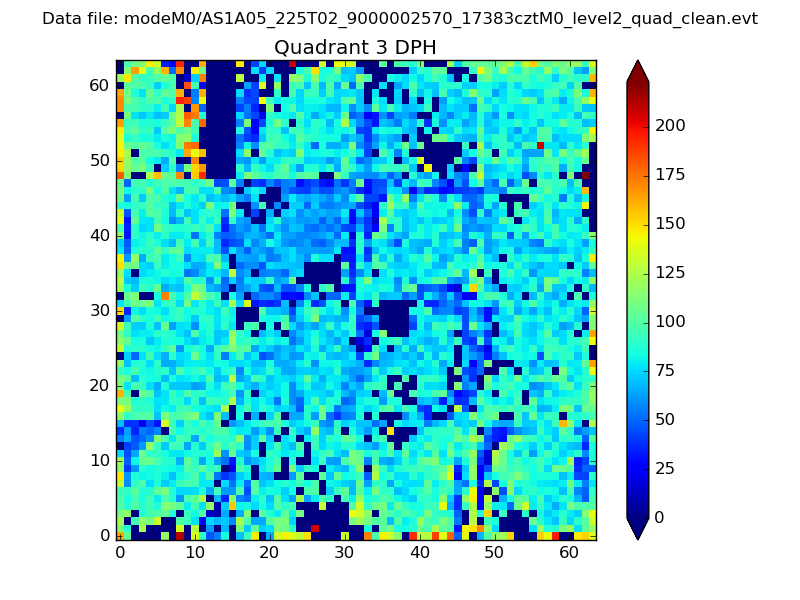 |
 |
Quadrant C |
| Plot type | Count rate plots | Images |
|---|---|---|
| Comparison with Poisson distribution Blue bars denote a histogram of data divided into 1 sec bins. Red curve is a Poisson curve with rate = median count rate of data. |
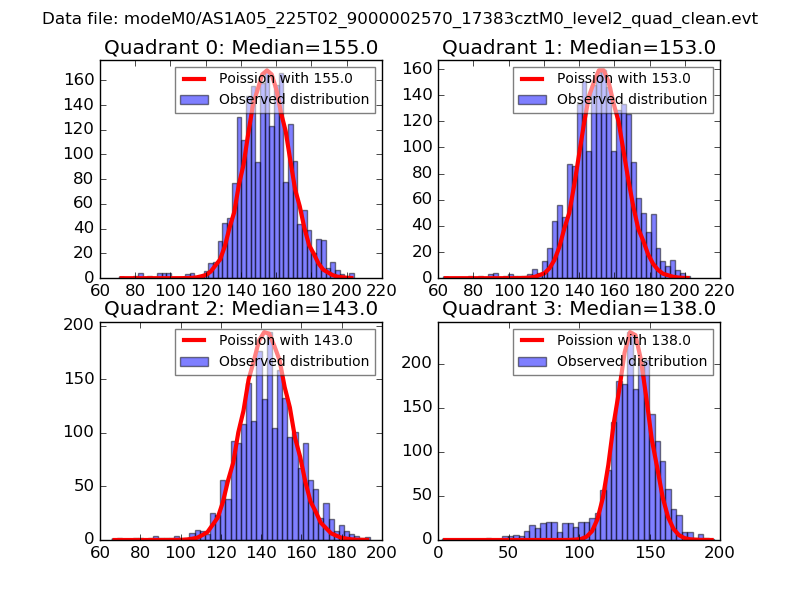 |
 |
| Quadrant-wise count rates Data is divided into 100 sec bins |
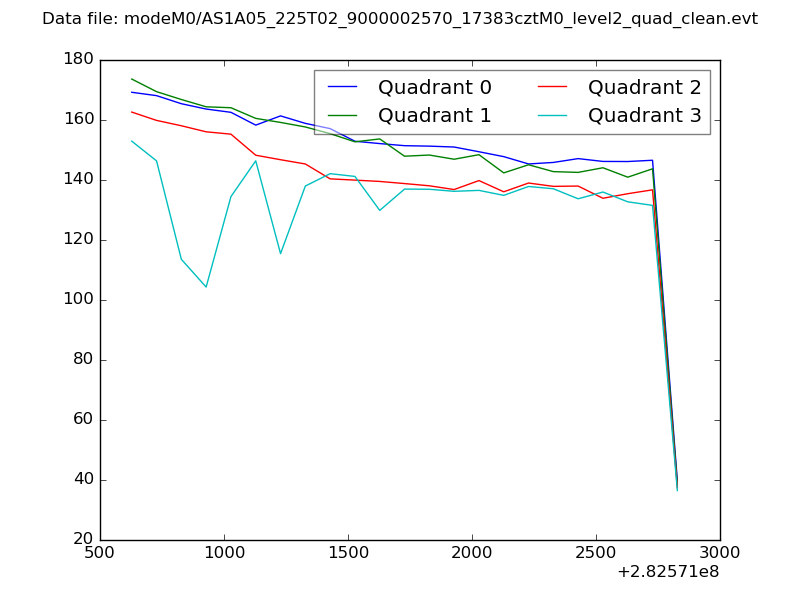 |
|
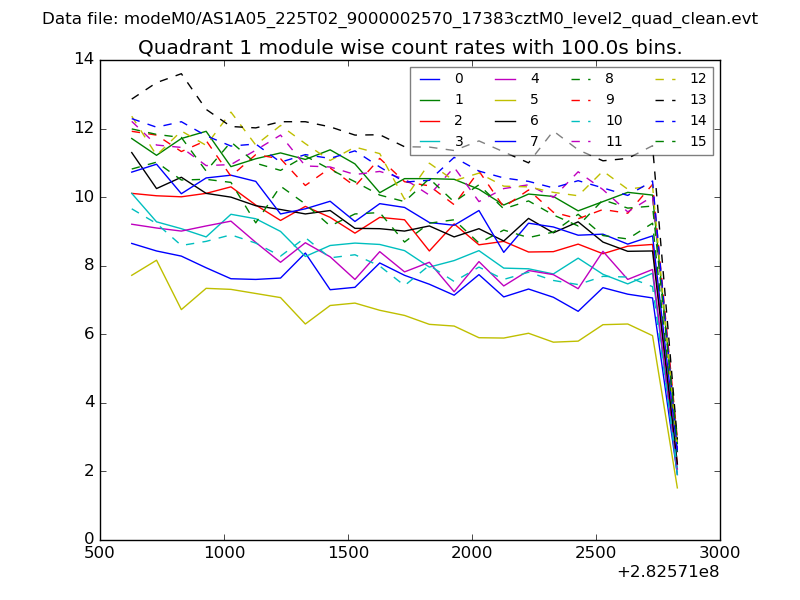
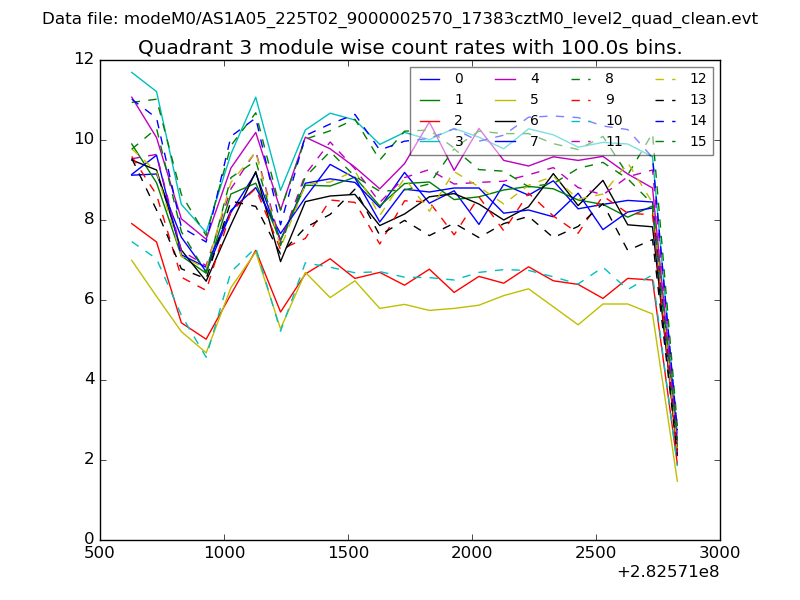
| Module-wise count rates for Quadrant A Data is divided into 100 sec bins |
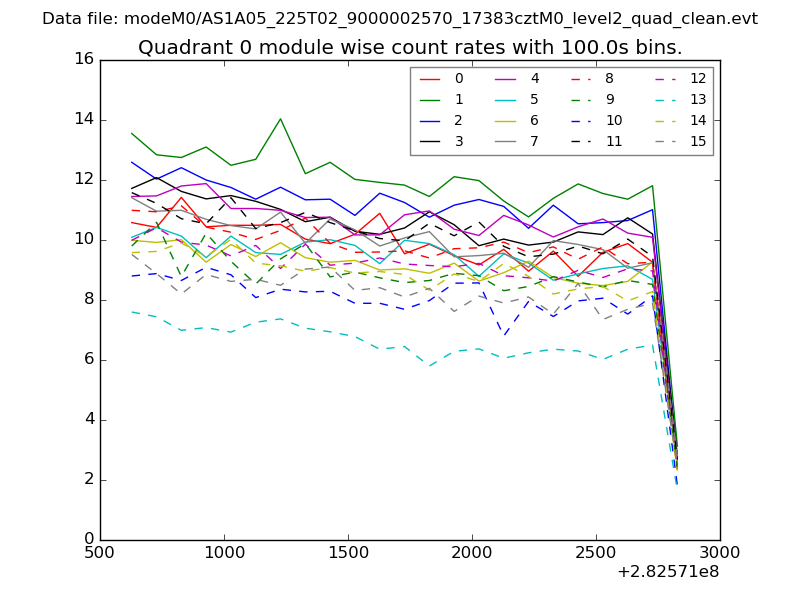 |
 |
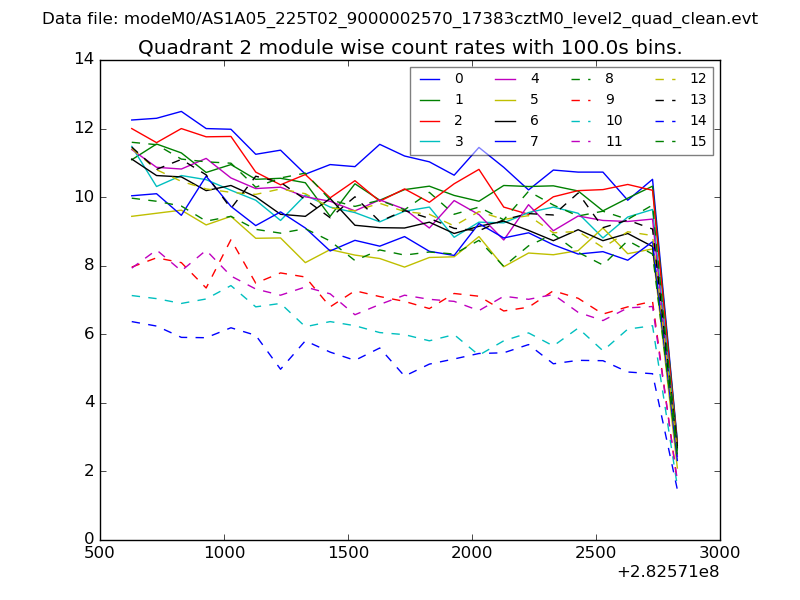
| Module-wise count rates for Quadrant B Data is divided into 100 sec bins |
 |
 |
| Module-wise count rates for Quadrant C Data is divided into 100 sec bins |
 |
 |
| Module-wise count rates for Quadrant D Data is divided into 100 sec bins |
 |
 |
| Parameter | Plot |
|---|---|
| CZT HV Monitor | 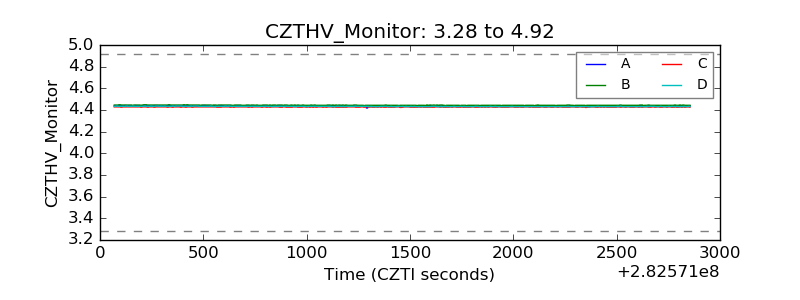 |
| D_VDD | 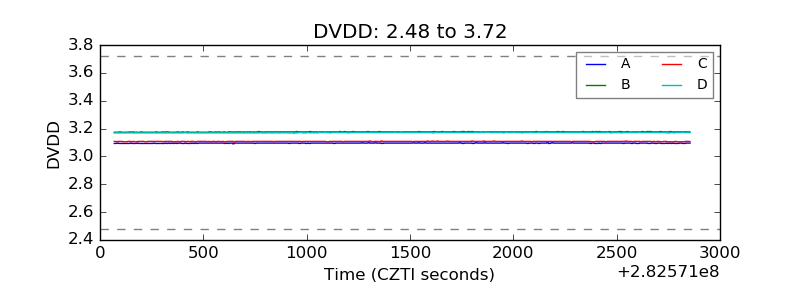 |
| Temperature 1 | 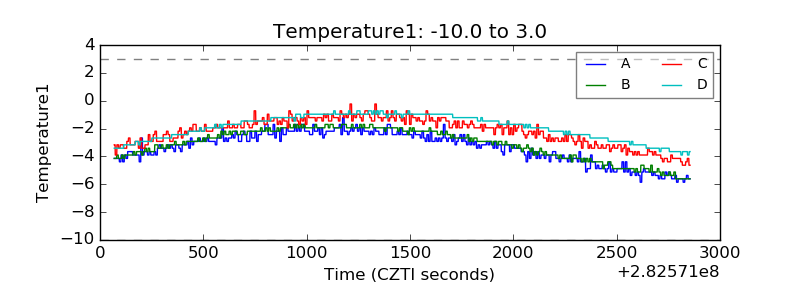 |
| Veto HV Monitor | 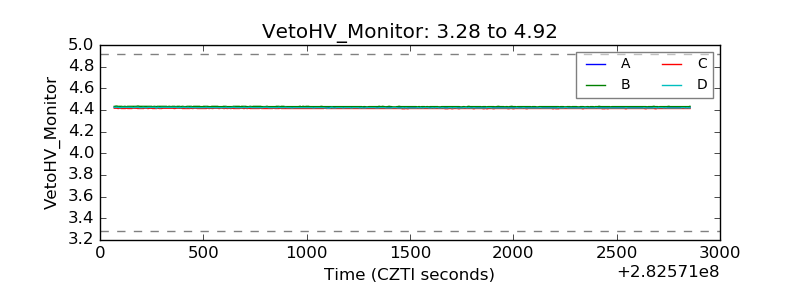 |
| Veto LLD | 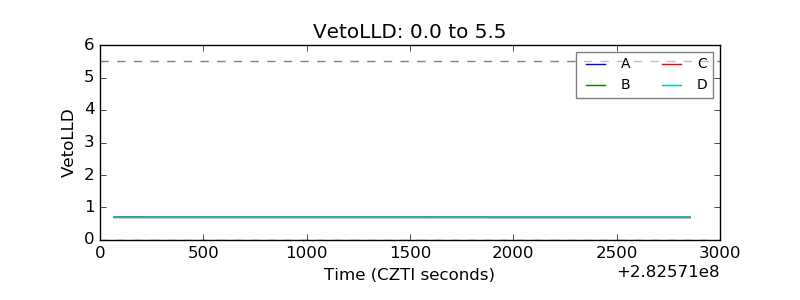 |
| Alpha Counter | 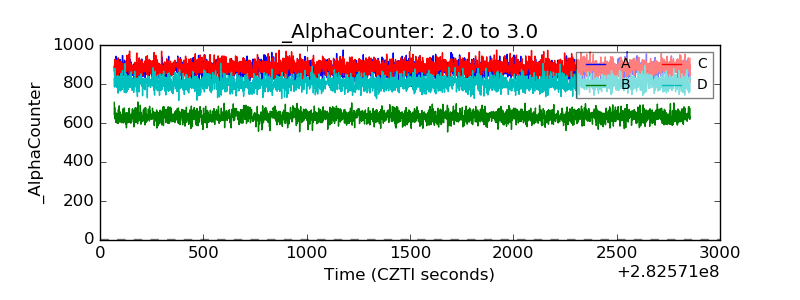 |
| _CPM_Rate |  |
| CZT Counter | 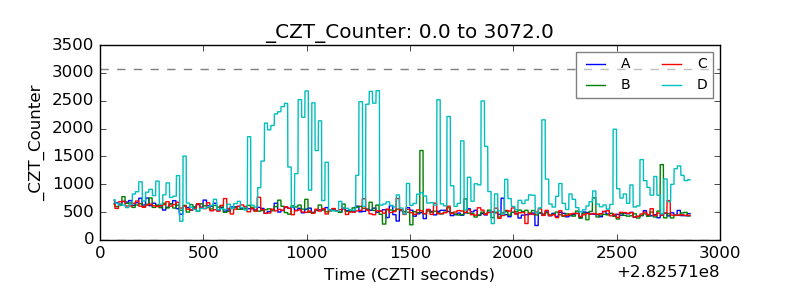 |
| +2.5 Volts monitor |  |
| +5 Volts monitor |  |
| _ROLL_ROT | 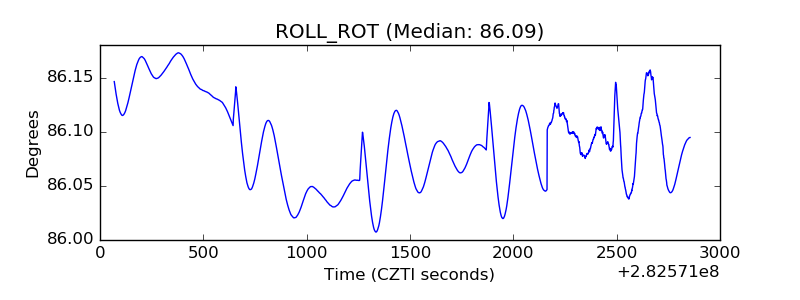 |
| _Roll_DEC | 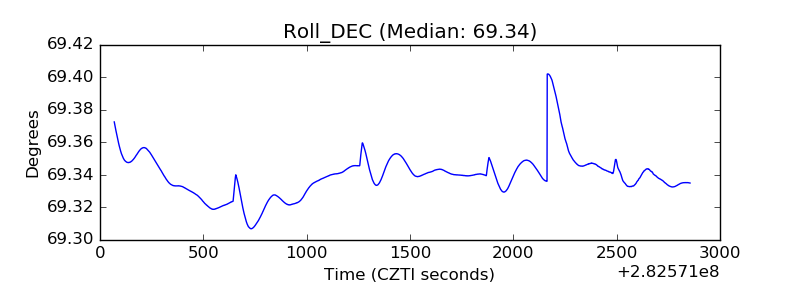 |
| _Roll_RA | 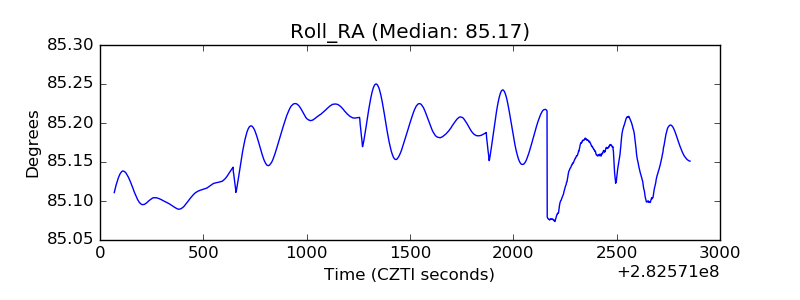 |
| Veto Counter | 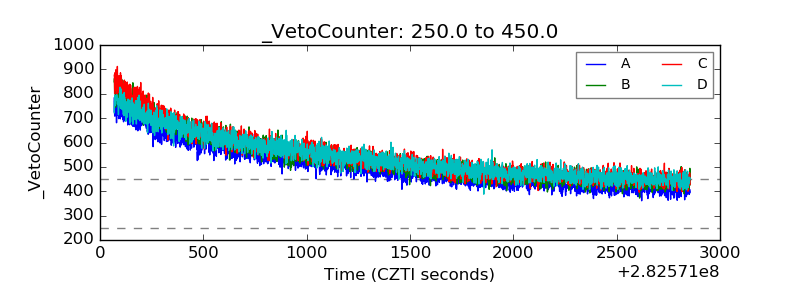 |