| Param | Original file | Final file |
|---|---|---|
| Filename | modeM0/AS1T03_030T01_9000002574cztM0_level2.fits | modeM0/AS1T03_030T01_9000002574cztM0_level2_quad_clean.evt |
| Size (bytes) | 1,070,262,720 | 1,002,695,040 |
| Size | 1020.7 MB | 956.2 MB |
| Events in quadrant A | 6,716,364 | 6,197,936 |
| Events in quadrant B | 6,390,570 | 6,152,227 |
| Events in quadrant C | 6,391,536 | 5,802,272 |
| Events in quadrant D | 5,347,796 | 4,651,597 |
| Mode M0 | |||
|---|---|---|---|
| Quadrant | BADHDUFLAG | Total packets | Discarded packets |
| A | 0 | 228730 | 0 |
| B | 0 | 235092 | 0 |
| C | 0 | 236012 | 0 |
| D | 0 | 380852 | 0 |
| Mode SS | |||
|---|---|---|---|
| Quadrant | BADHDUFLAG | Total packets | Discarded packets |
| A | 0 | 2170 | 0 |
| B | 0 | 2170 | 0 |
| C | 0 | 2170 | 0 |
| D | 0 | 2170 | 0 |
| Mode M9 | |||
|---|---|---|---|
| Quadrant | BADHDUFLAG | Total packets | Discarded packets |
| A | 0 | 170 | 0 |
| B | 0 | 170 | 0 |
| C | 0 | 170 | 0 |
| D | 0 | 170 | 0 |
| Quadrant | Total seconds | Saturated seconds | Saturation percentage |
|---|---|---|---|
| A | 110596 | 1036 | 0.936743% |
| B | 110596 | 1573 | 1.422294% |
| C | 110596 | 1484 | 1.341821% |
| D | 110596 | 12286 | 11.108901% |
Noise dominated data is calculated using 1-second bins in cleaned event files. If a bin has >2000 counts, and if more than 50% of those come from <1% of pixels, then it is considered to be noise-dominated and hence unusable.
| Quadrant | # 1 sec bins | Bins with >0 counts | Bins with >2000 counts | High rate bins dominated by noise | Noise dominated (total time) | Noise dominated (detector-on time) | Marked lightcurve |
|---|---|---|---|---|---|---|---|
| A | 127386 | 110589 | 0 | 0 | 0.00% | 0.00% | 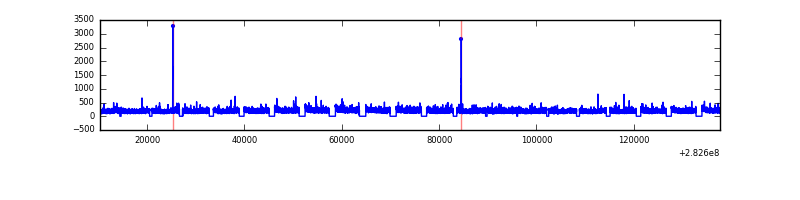 |
| B | 127386 | 110587 | 0 | 0 | 0.00% | 0.00% |  |
| C | 127386 | 110591 | 0 | 0 | 0.00% | 0.00% |  |
| D | 127386 | 110335 | 0 | 0 | 0.00% | 0.00% |  |
Top three noisy pixels from each quadrant. If the there are fewer than three noisy pixels in the level2.evt file, extra rows are filled as -1
| Pixel properties | Quadrant properties | ||||||
|---|---|---|---|---|---|---|---|
| Quadrant | DetID | PixID | Counts | Sigma | Mean | Median | Sigma |
| A | 0 | 29 | 5531 | 9.06 | 1746 | 1635 | 430.2 |
| A | 7 | 110 | 5439 | 8.84 | 1746 | 1635 | 430.2 |
| A | 9 | 19 | 5040 | 7.91 | 1746 | 1635 | 430.2 |
| B | 2 | 9 | 5178 | 10.72 | 1688 | 1609 | 332.9 |
| B | 3 | 80 | 4335 | 8.19 | 1688 | 1609 | 332.9 |
| B | 2 | 8 | 4289 | 8.05 | 1688 | 1609 | 332.9 |
| C | 1 | 80 | 4952 | 7.79 | 1688 | 1573 | 433.8 |
| C | 1 | 81 | 4840 | 7.53 | 1688 | 1573 | 433.8 |
| C | 12 | 241 | 4444 | 6.62 | 1688 | 1573 | 433.8 |
| D | 3 | 14 | 3860 | 6.15 | 1526 | 1392 | 401.3 |
| D | 10 | 189 | 3766 | 5.92 | 1526 | 1392 | 401.3 |
| D | 6 | 231 | 3722 | 5.81 | 1526 | 1392 | 401.3 |
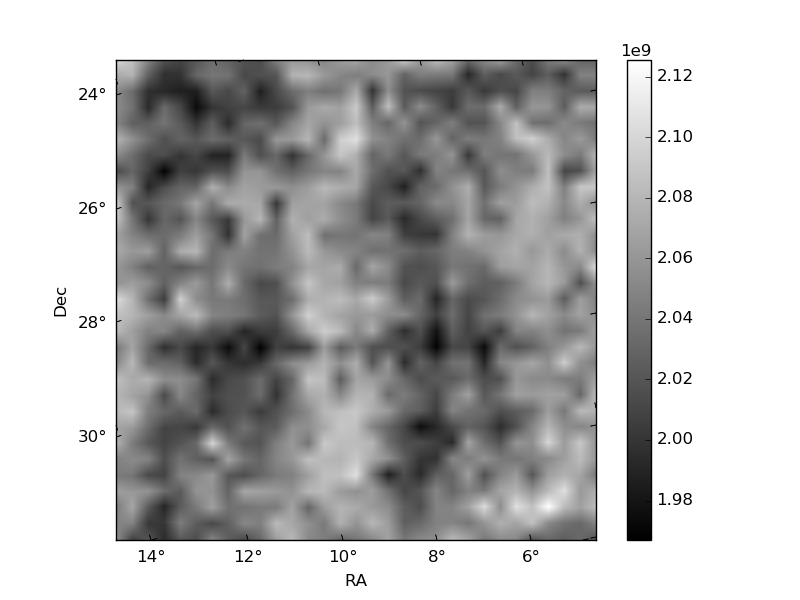
Histogram calculated using DETX and DETY for each event in the final _common_clean file
| Quadrant A |  |
 |
Quadrant B |
|---|---|---|---|
| Quadrant D |  |
 |
Quadrant C |
| Plot type | Count rate plots | Images |
|---|---|---|
| Comparison with Poisson distribution Blue bars denote a histogram of data divided into 1 sec bins. Red curve is a Poisson curve with rate = median count rate of data. |
 |
 |
| Quadrant-wise count rates Data is divided into 100 sec bins |
 |
|
| Module-wise count rates for Quadrant A Data is divided into 100 sec bins |
 |
 |
| Module-wise count rates for Quadrant B Data is divided into 100 sec bins |
 |
 |
| Module-wise count rates for Quadrant C Data is divided into 100 sec bins |
 |
 |
| Module-wise count rates for Quadrant D Data is divided into 100 sec bins |
 |
 |
| Parameter | Plot |
|---|---|
| CZT HV Monitor |  |
| D_VDD |  |
| Temperature 1 |  |
| Veto HV Monitor | 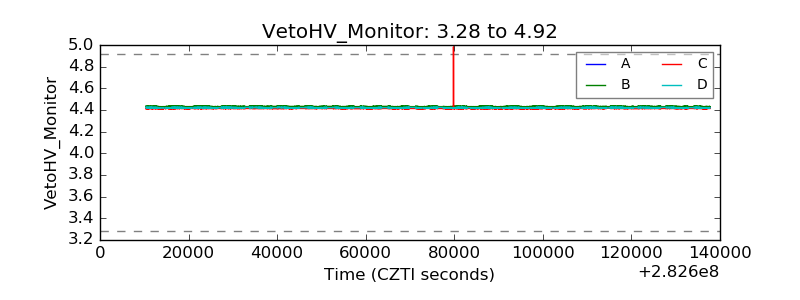 |
| Veto LLD | 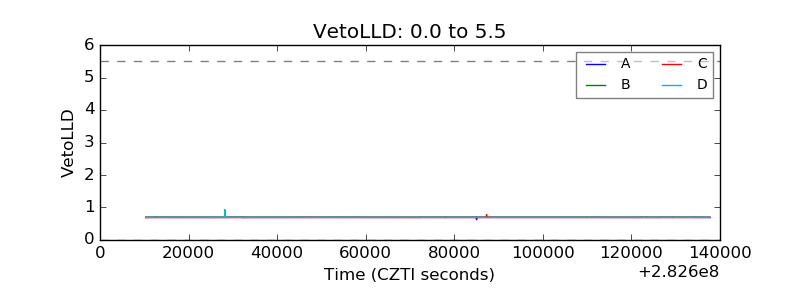 |
| Alpha Counter |  |
| _CPM_Rate | 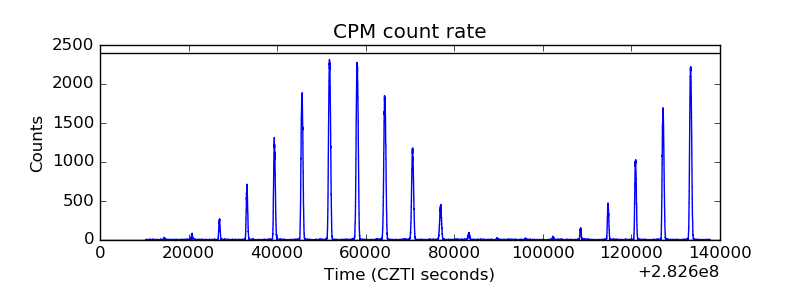 |
| CZT Counter | 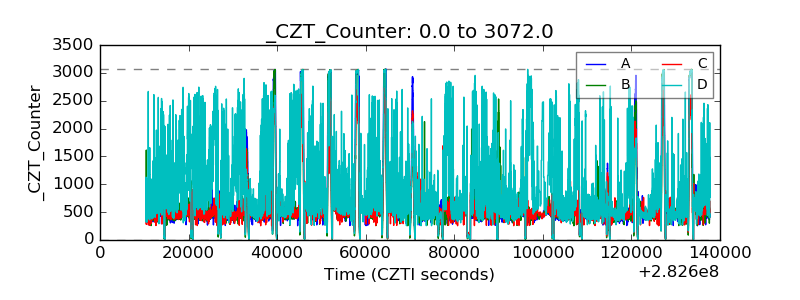 |
| +2.5 Volts monitor |  |
| +5 Volts monitor |  |
| _ROLL_ROT |  |
| _Roll_DEC |  |
| _Roll_RA |  |
| Veto Counter |  |