| Param | Original file | Final file |
|---|---|---|
| Filename | modeM0/AS1T03_030T01_9000002574_17389cztM0_level2.evt | modeM0/AS1T03_030T01_9000002574_17389cztM0_level2_quad_clean.evt |
| Size (bytes) | 443,980,800 | 67,504,320 |
| Size | 423.4 MB | 64.4 MB |
| Events in quadrant A | 2,594,645 | 427,387 |
| Events in quadrant B | 2,826,241 | 429,004 |
| Events in quadrant C | 2,743,164 | 413,841 |
| Events in quadrant D | 4,901,803 | 382,288 |
| Mode M0 | |||
|---|---|---|---|
| Quadrant | BADHDUFLAG | Total packets | Discarded packets |
| A | 0 | 11453 | 1 |
| B | 0 | 12124 | 1 |
| C | 0 | 11539 | 1 |
| D | 0 | 18557 | 1 |
| Mode SS | |||
|---|---|---|---|
| Quadrant | BADHDUFLAG | Total packets | Discarded packets |
| A | 0 | 114 | 0 |
| B | 0 | 114 | 0 |
| C | 0 | 114 | 0 |
| D | 0 | 114 | 0 |
| Mode M9 | |||
|---|---|---|---|
| Quadrant | BADHDUFLAG | Total packets | Discarded packets |
| A | 0 | 3 | 0 |
| B | 0 | 3 | 0 |
| C | 0 | 3 | 0 |
| D | 0 | 3 | 0 |
| Quadrant | Total seconds | Saturated seconds | Saturation percentage |
|---|---|---|---|
| A | 5593 | 45 | 0.804577% |
| B | 5593 | 105 | 1.877347% |
| C | 5592 | 81 | 1.448498% |
| D | 5592 | 519 | 9.281116% |
Noise dominated data is calculated using 1-second bins in cleaned event files. If a bin has >2000 counts, and if more than 50% of those come from <1% of pixels, then it is considered to be noise-dominated and hence unusable.
| Quadrant | # 1 sec bins | Bins with >0 counts | Bins with >2000 counts | High rate bins dominated by noise | Noise dominated (total time) | Noise dominated (detector-on time) | Marked lightcurve |
|---|---|---|---|---|---|---|---|
| A | 5878 | 5594 | 0 | 0 | 0.00% | 0.00% | 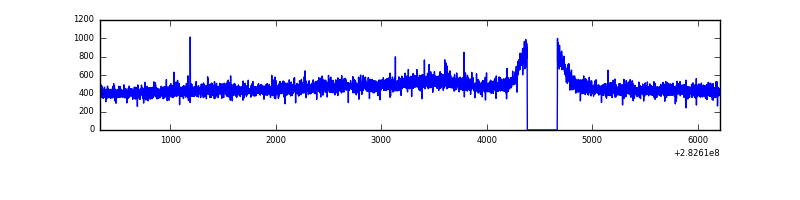 |
| B | 5878 | 5594 | 5 | 5 | 0.09% | 0.09% | 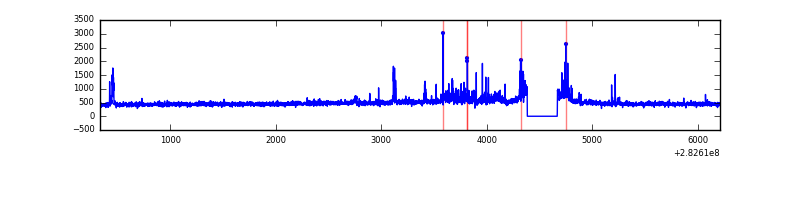 |
| C | 5877 | 5593 | 0 | 0 | 0.00% | 0.00% | 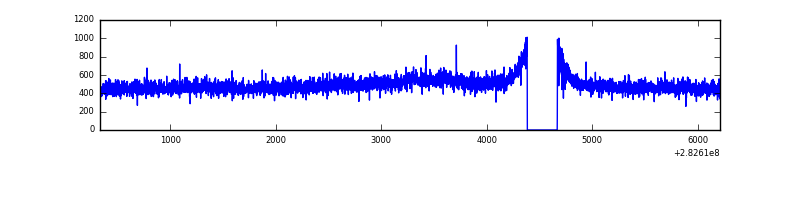 |
| D | 5877 | 5592 | 332 | 332 | 5.65% | 5.94% | 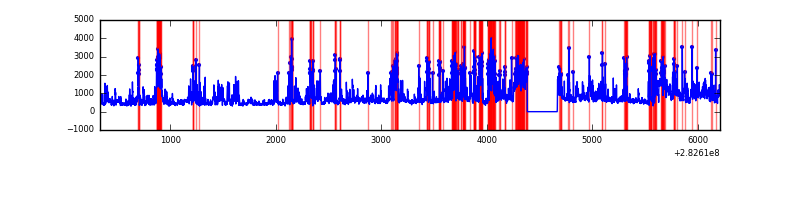 |
Top three noisy pixels from each quadrant. If the there are fewer than three noisy pixels in the level2.evt file, extra rows are filled as -1
| Pixel properties | Quadrant properties | ||||||
|---|---|---|---|---|---|---|---|
| Quadrant | DetID | PixID | Counts | Sigma | Mean | Median | Sigma |
| A | 0 | 226 | 5930 | 38.3 | 674 | 660 | 137.6 |
| A | 3 | 137 | 5031 | 31.76 | 674 | 660 | 137.6 |
| A | 12 | 194 | 4901 | 30.82 | 674 | 660 | 137.6 |
| B | 7 | 220 | 64735 | 490.56 | 671 | 655 | 130.6 |
| B | 15 | 35 | 34838 | 261.69 | 671 | 655 | 130.6 |
| B | 0 | 197 | 34293 | 257.51 | 671 | 655 | 130.6 |
| C | 14 | 238 | 100038 | 651.95 | 647 | 651 | 152.4 |
| C | 5 | 218 | 54869 | 355.65 | 647 | 651 | 152.4 |
| C | 3 | 233 | 42087 | 271.81 | 647 | 651 | 152.4 |
| D | 13 | 232 | 967941 | 6317.92 | 630 | 611 | 153.1 |
| D | 11 | 176 | 713895 | 4658.67 | 630 | 611 | 153.1 |
| D | 1 | 52 | 379028 | 2471.56 | 630 | 611 | 153.1 |
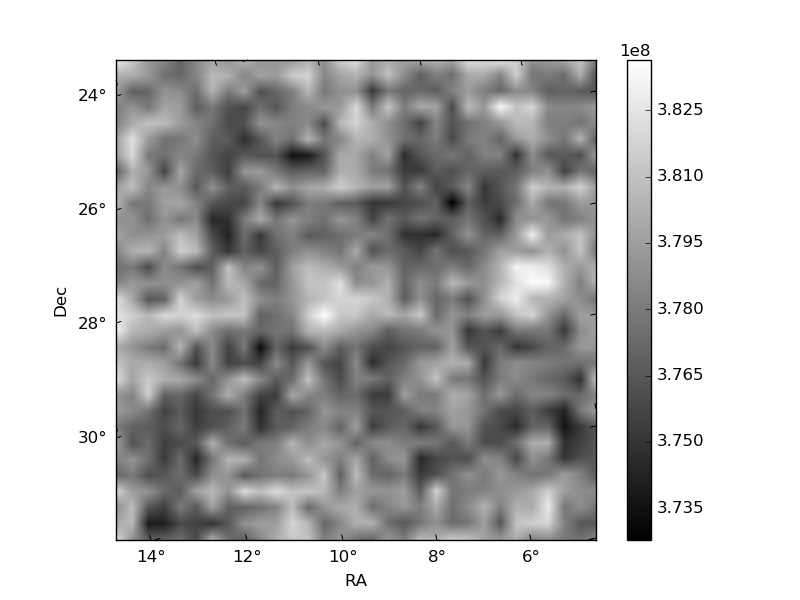
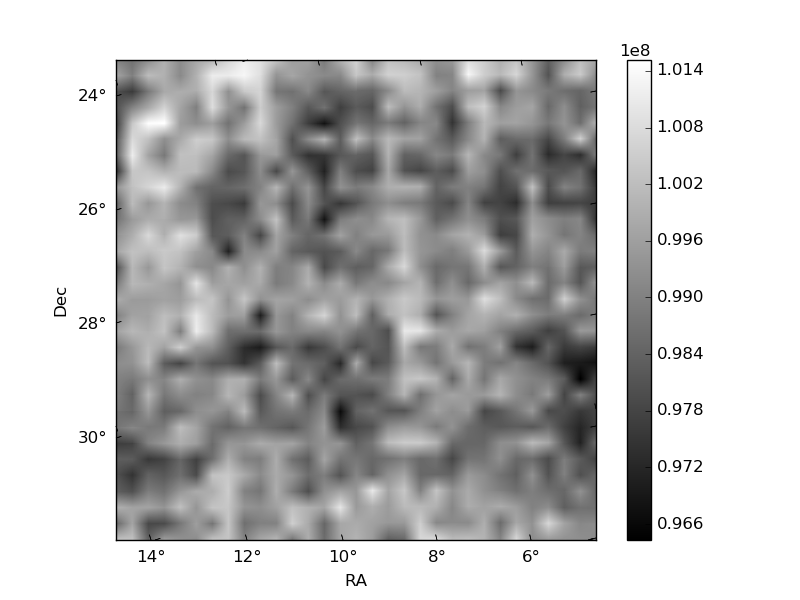
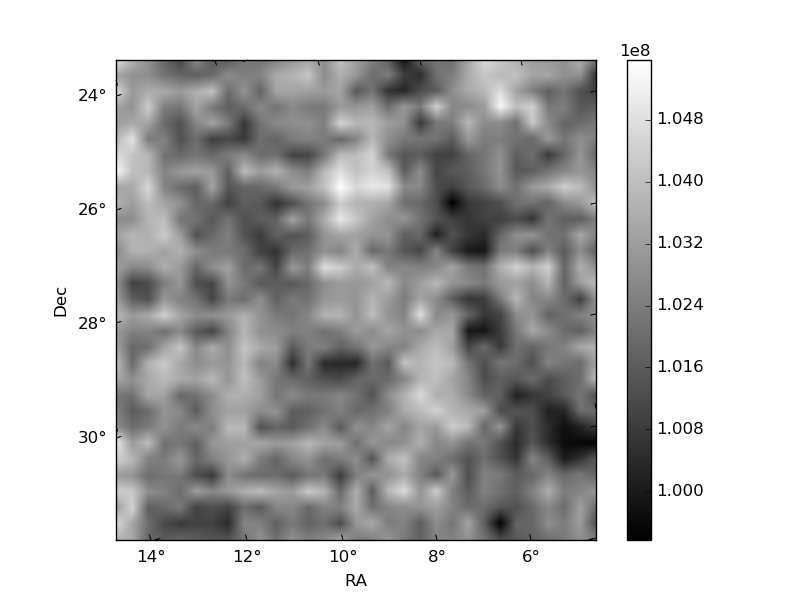
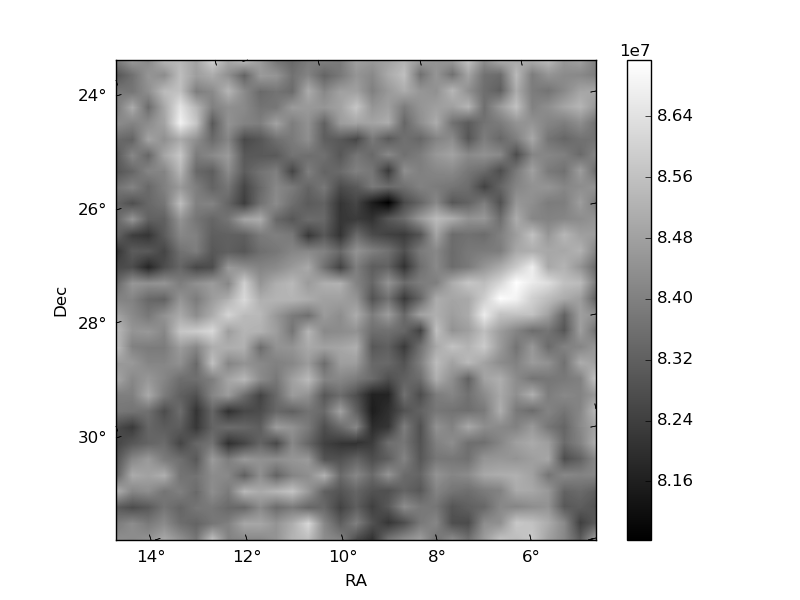
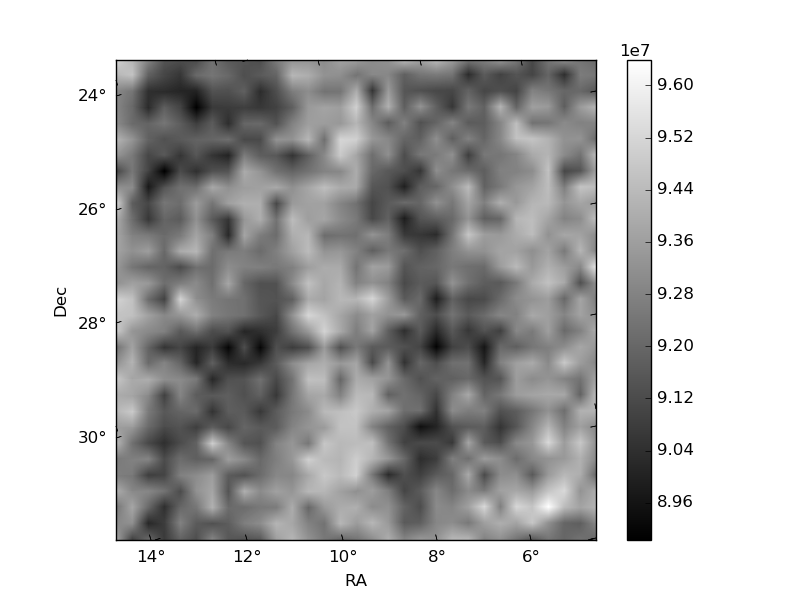
Histogram calculated using DETX and DETY for each event in the final _common_clean file
| Quadrant A | 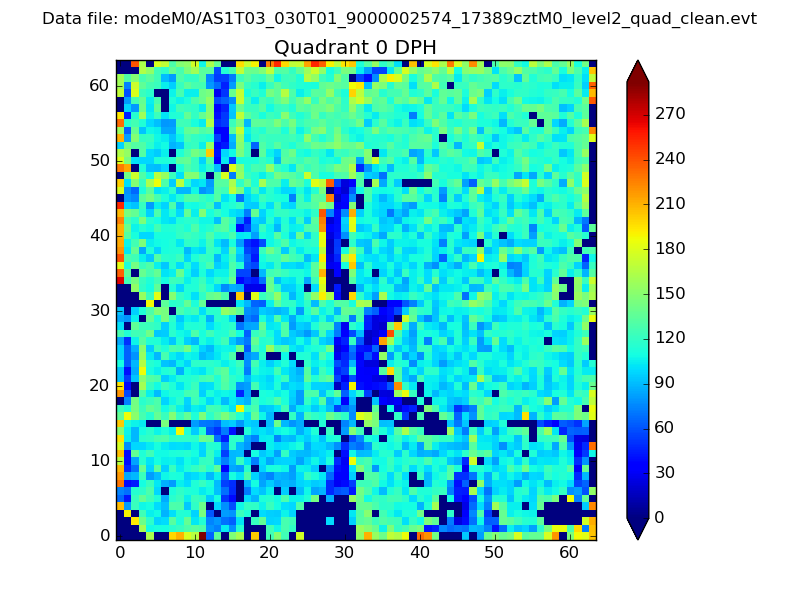 |
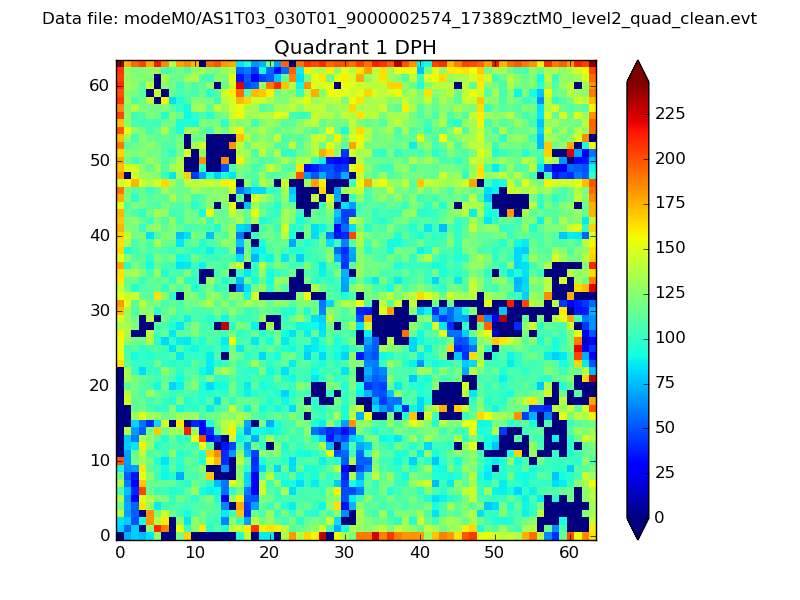 |
Quadrant B |
|---|---|---|---|
| Quadrant D | 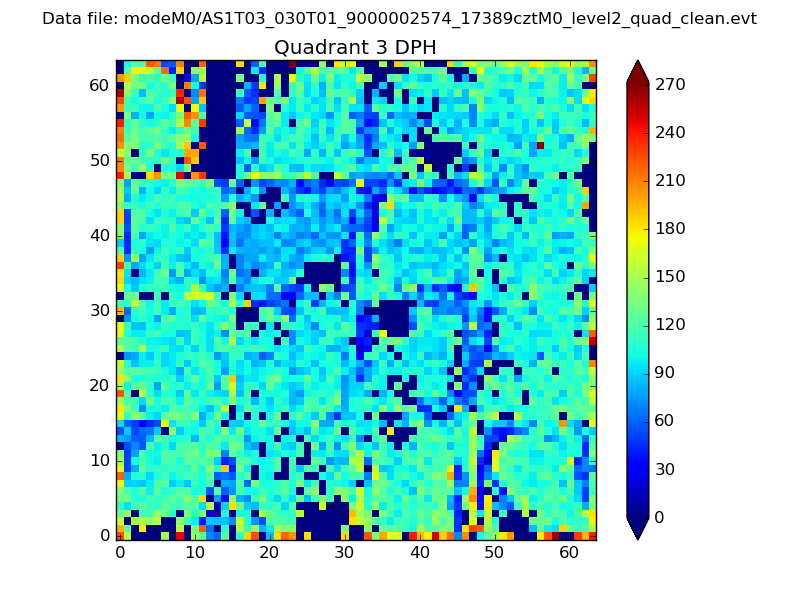 |
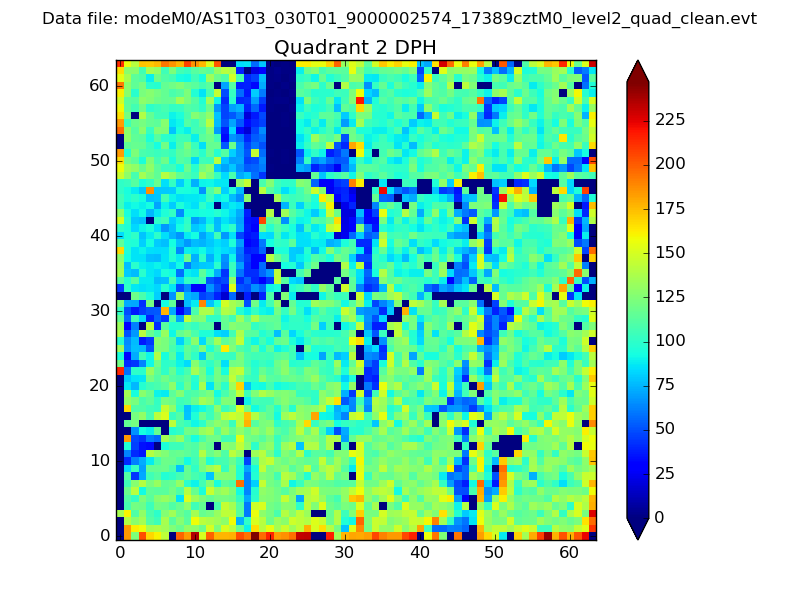 |
Quadrant C |
| Plot type | Count rate plots | Images |
|---|---|---|
| Comparison with Poisson distribution Blue bars denote a histogram of data divided into 1 sec bins. Red curve is a Poisson curve with rate = median count rate of data. |
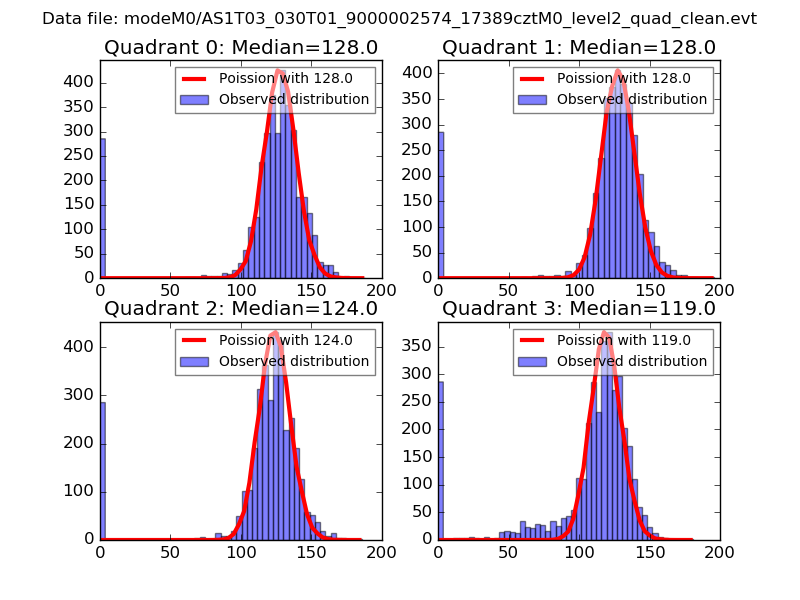 |
 |
| Quadrant-wise count rates Data is divided into 100 sec bins |
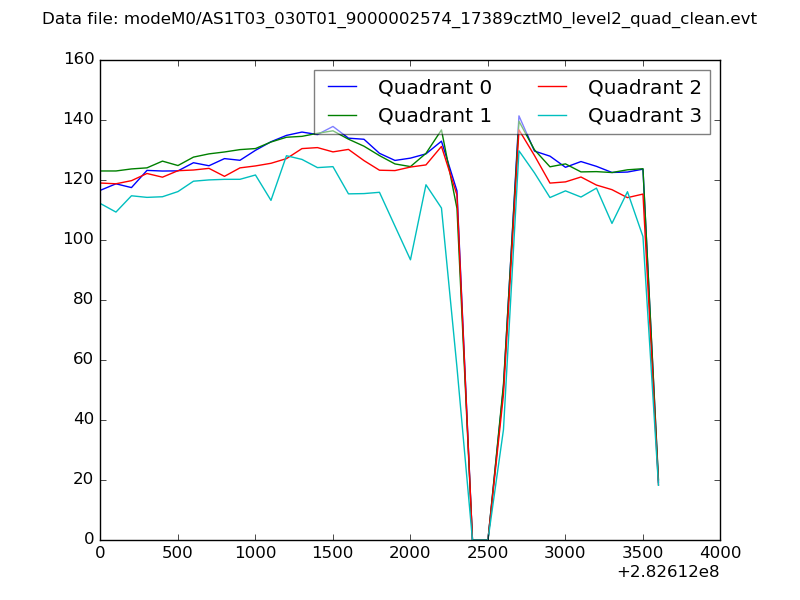 |
|
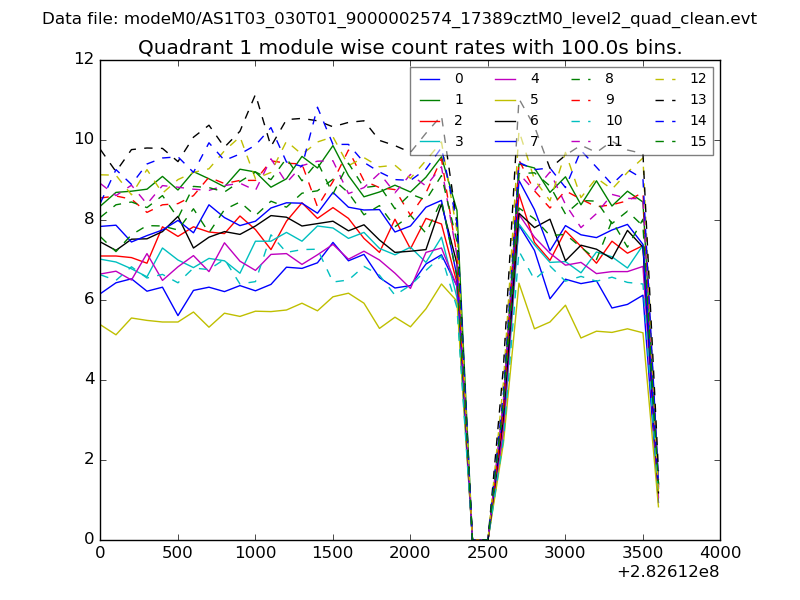
| Module-wise count rates for Quadrant A Data is divided into 100 sec bins |
 |
 |
| Module-wise count rates for Quadrant B Data is divided into 100 sec bins |
 |
 |
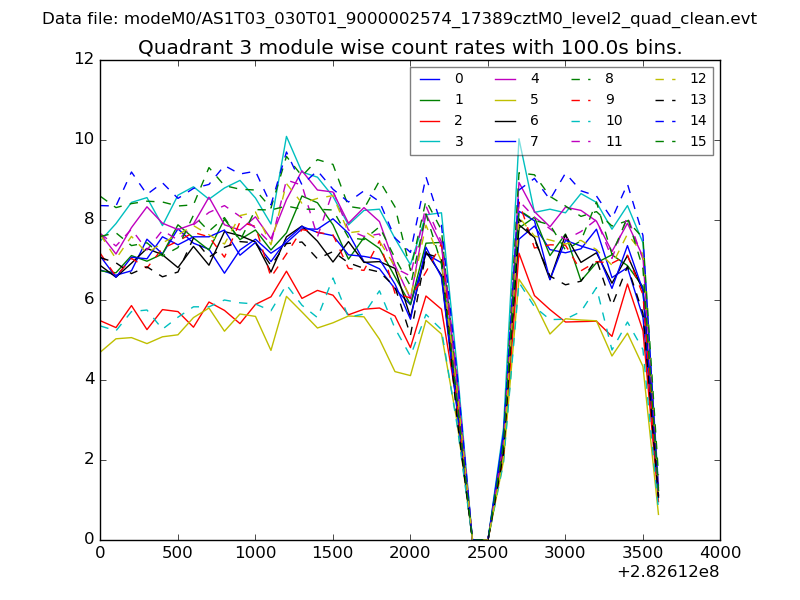
| Module-wise count rates for Quadrant C Data is divided into 100 sec bins |
 |
 |
| Module-wise count rates for Quadrant D Data is divided into 100 sec bins |
 |
 |
| Parameter | Plot |
|---|---|
| CZT HV Monitor |  |
| D_VDD | 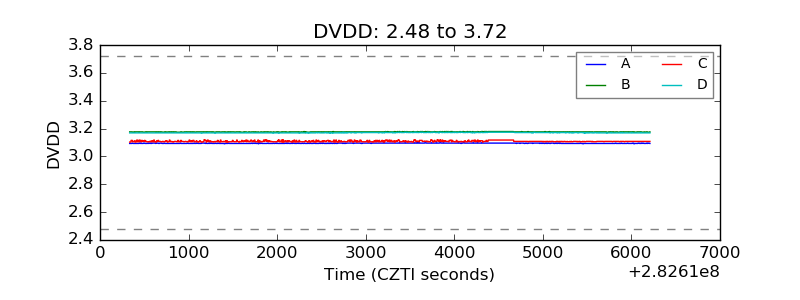 |
| Temperature 1 | 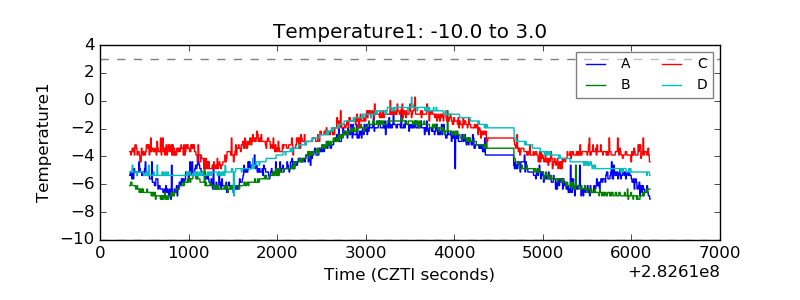 |
| Veto HV Monitor | 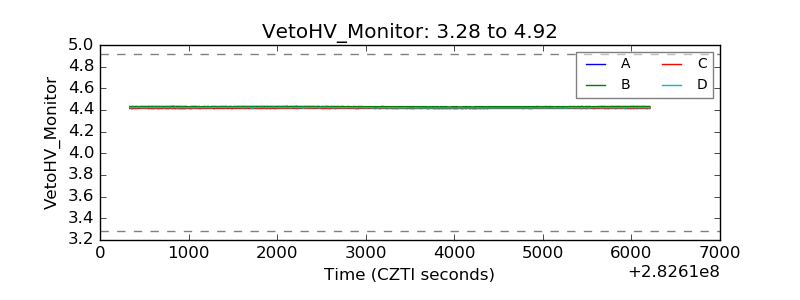 |
| Veto LLD | 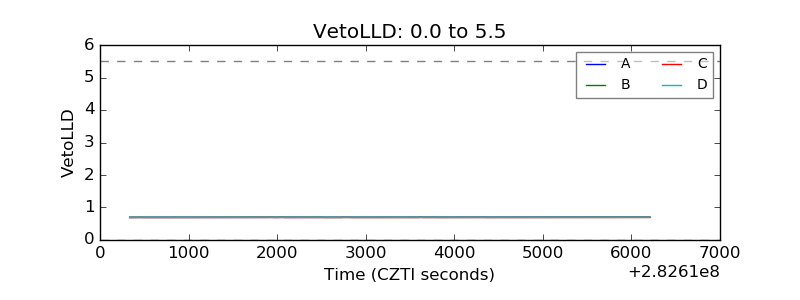 |
| Alpha Counter | 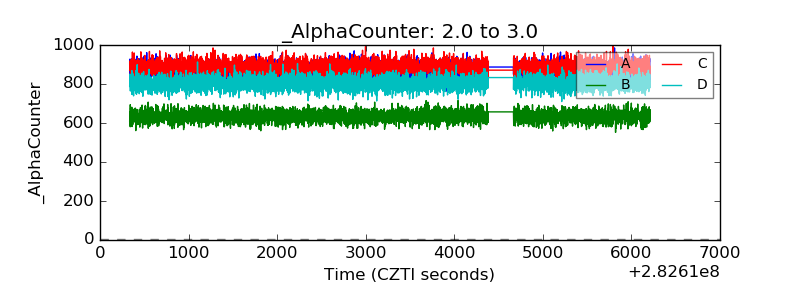 |
| _CPM_Rate | 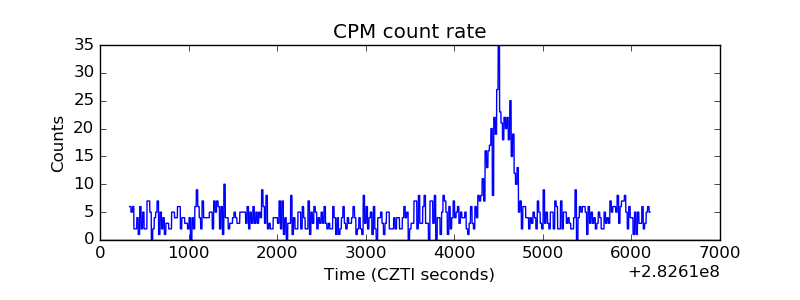 |
| CZT Counter | 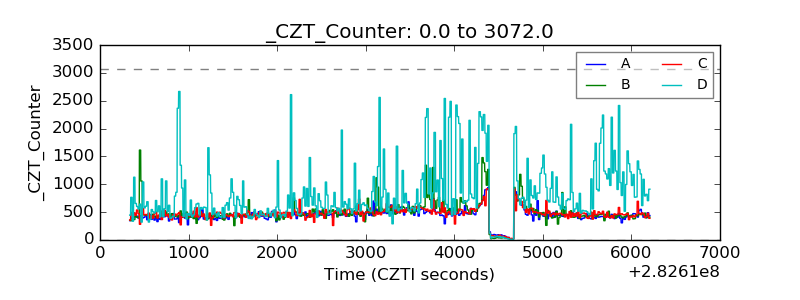 |
| +2.5 Volts monitor | 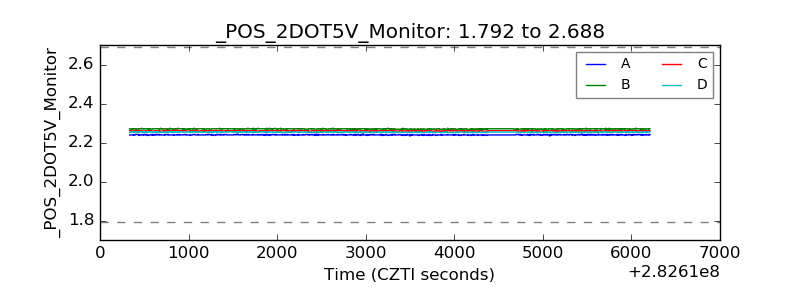 |
| +5 Volts monitor | 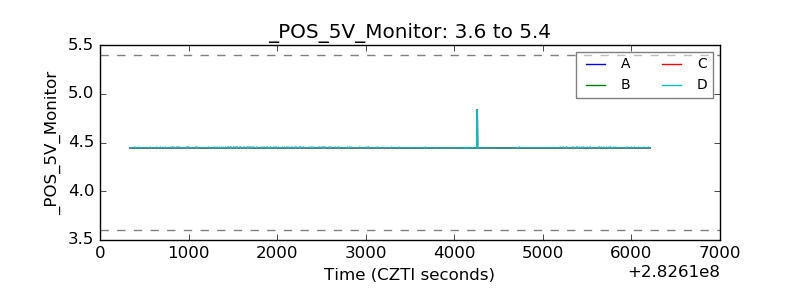 |
| _ROLL_ROT | 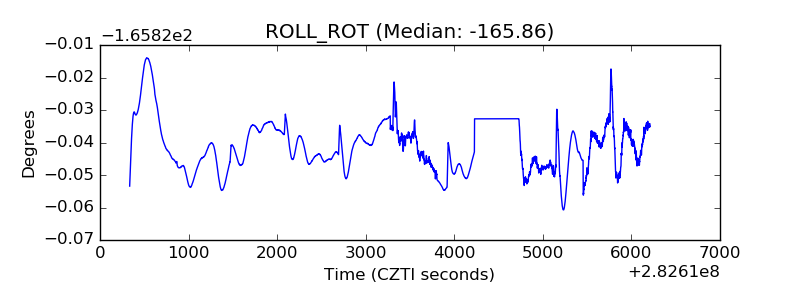 |
| _Roll_DEC | 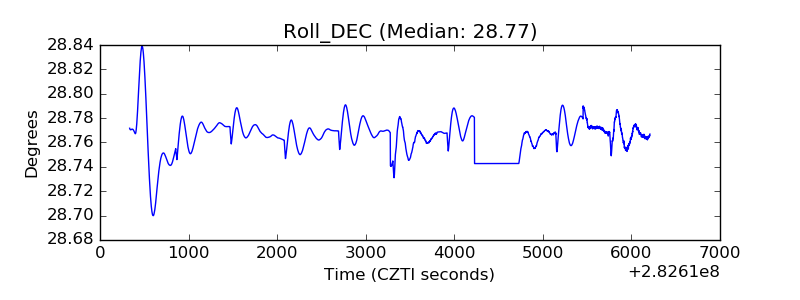 |
| _Roll_RA | 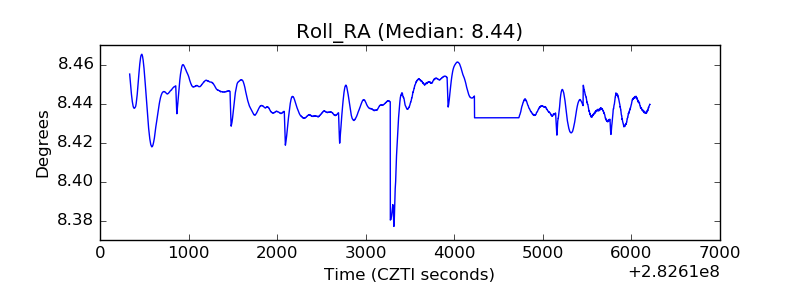 |
| Veto Counter | 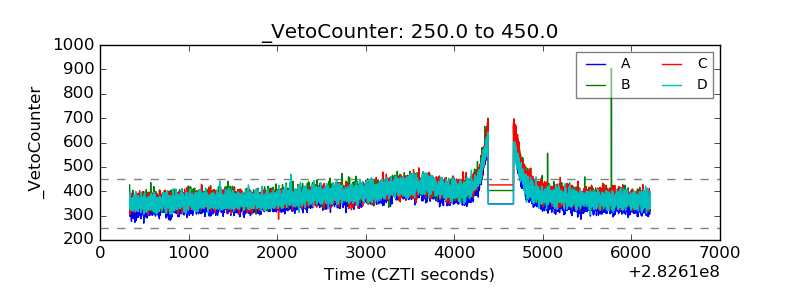 |