| Param | Original file | Final file |
|---|---|---|
| Filename | modeM0/AS1T03_030T01_9000002574_17392cztM0_level2.evt | modeM0/AS1T03_030T01_9000002574_17392cztM0_level2_quad_clean.evt |
| Size (bytes) | 1,644,094,080 | 210,360,960 |
| Size | 1.5 GB | 200.6 MB |
| Events in quadrant A | 8,605,289 | 1,327,578 |
| Events in quadrant B | 8,968,871 | 1,339,335 |
| Events in quadrant C | 9,032,642 | 1,292,988 |
| Events in quadrant D | 21,929,808 | 1,126,926 |
| Mode M0 | |||
|---|---|---|---|
| Quadrant | BADHDUFLAG | Total packets | Discarded packets |
| A | 0 | 38008 | 4 |
| B | 0 | 38609 | 4 |
| C | 0 | 38203 | 5 |
| D | 0 | 78013 | 4 |
| Mode SS | |||
|---|---|---|---|
| Quadrant | BADHDUFLAG | Total packets | Discarded packets |
| A | 0 | 378 | 0 |
| B | 0 | 378 | 0 |
| C | 0 | 378 | 0 |
| D | 0 | 378 | 0 |
| Mode M9 | |||
|---|---|---|---|
| Quadrant | BADHDUFLAG | Total packets | Discarded packets |
| A | 0 | 23 | 0 |
| B | 0 | 23 | 0 |
| C | 0 | 23 | 0 |
| D | 0 | 23 | 0 |
| Quadrant | Total seconds | Saturated seconds | Saturation percentage |
|---|---|---|---|
| A | 18622 | 166 | 0.891419% |
| B | 18623 | 276 | 1.482038% |
| C | 18622 | 235 | 1.261948% |
| D | 18622 | 2895 | 15.546128% |
Noise dominated data is calculated using 1-second bins in cleaned event files. If a bin has >2000 counts, and if more than 50% of those come from <1% of pixels, then it is considered to be noise-dominated and hence unusable.
| Quadrant | # 1 sec bins | Bins with >0 counts | Bins with >2000 counts | High rate bins dominated by noise | Noise dominated (total time) | Noise dominated (detector-on time) | Marked lightcurve |
|---|---|---|---|---|---|---|---|
| A | 20892 | 18627 | 2 | 2 | 0.01% | 0.01% | 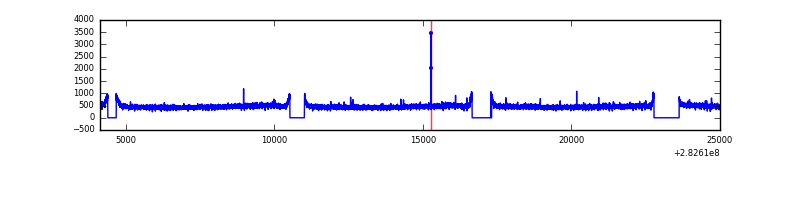 |
| B | 20893 | 18627 | 16 | 16 | 0.08% | 0.09% | 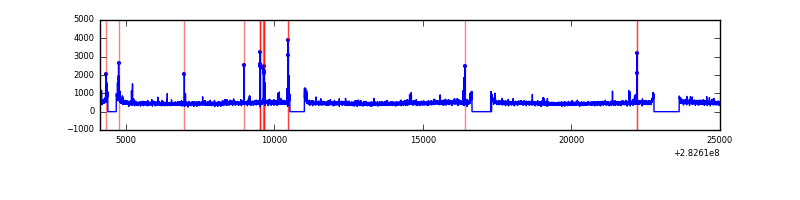 |
| C | 20892 | 18627 | 0 | 0 | 0.00% | 0.00% | 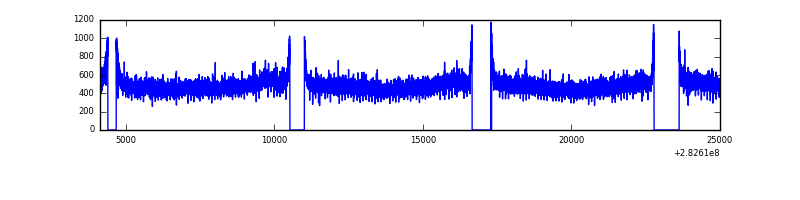 |
| D | 20892 | 18626 | 2495 | 2495 | 11.94% | 13.40% | 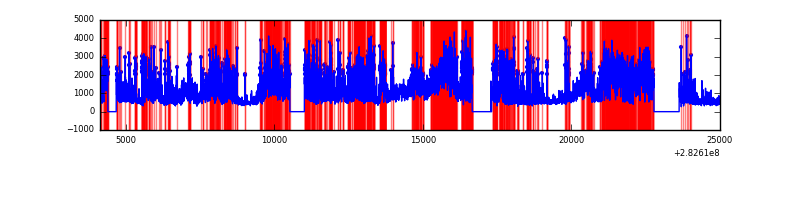 |
Top three noisy pixels from each quadrant. If the there are fewer than three noisy pixels in the level2.evt file, extra rows are filled as -1
| Pixel properties | Quadrant properties | ||||||
|---|---|---|---|---|---|---|---|
| Quadrant | DetID | PixID | Counts | Sigma | Mean | Median | Sigma |
| A | 0 | 226 | 19455 | 38.13 | 2236 | 2186 | 452.9 |
| A | 3 | 137 | 16952 | 32.61 | 2236 | 2186 | 452.9 |
| A | 12 | 194 | 16335 | 31.24 | 2236 | 2186 | 452.9 |
| B | 0 | 197 | 98148 | 224.57 | 2232 | 2172 | 427.4 |
| B | 12 | 111 | 52082 | 116.78 | 2232 | 2172 | 427.4 |
| B | 11 | 111 | 45252 | 100.8 | 2232 | 2172 | 427.4 |
| C | 14 | 238 | 328343 | 649.74 | 2150 | 2163 | 502.0 |
| C | 5 | 218 | 216881 | 427.71 | 2150 | 2163 | 502.0 |
| C | 3 | 233 | 73867 | 142.83 | 2150 | 2163 | 502.0 |
| D | 11 | 176 | 8257091 | 16358.84 | 2062 | 2005 | 504.6 |
| D | 1 | 52 | 2682773 | 5312.39 | 2062 | 2005 | 504.6 |
| D | 13 | 232 | 1805031 | 3573.0 | 2062 | 2005 | 504.6 |
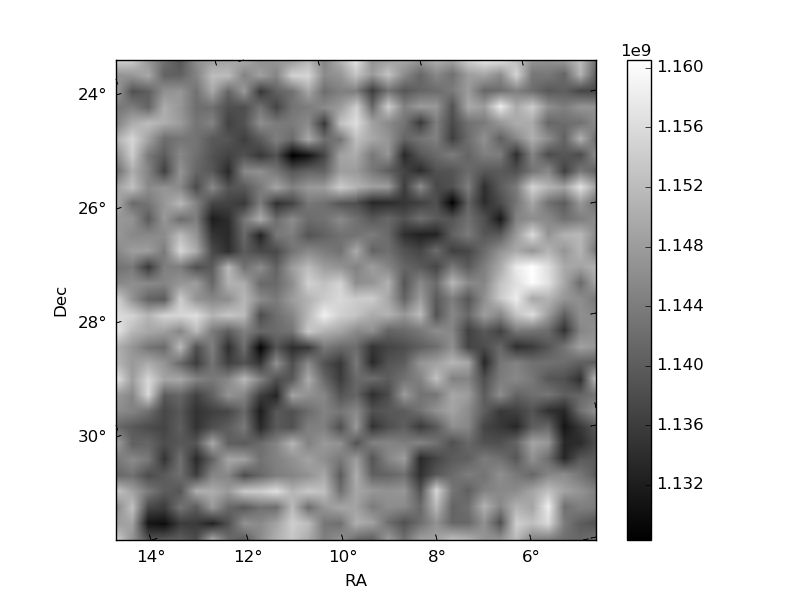
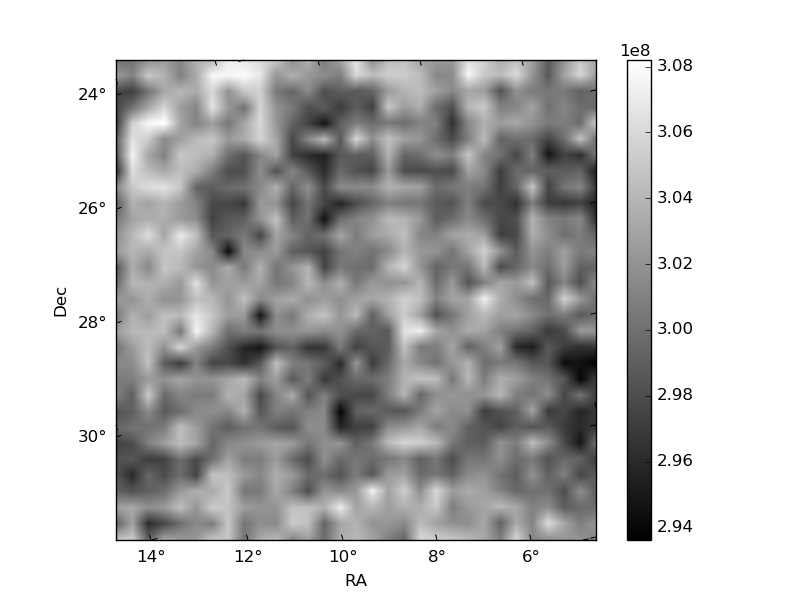
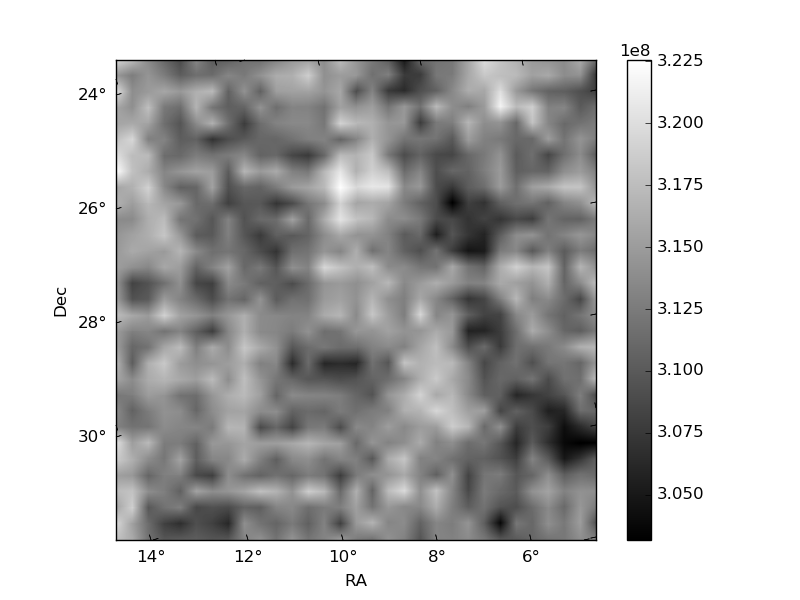
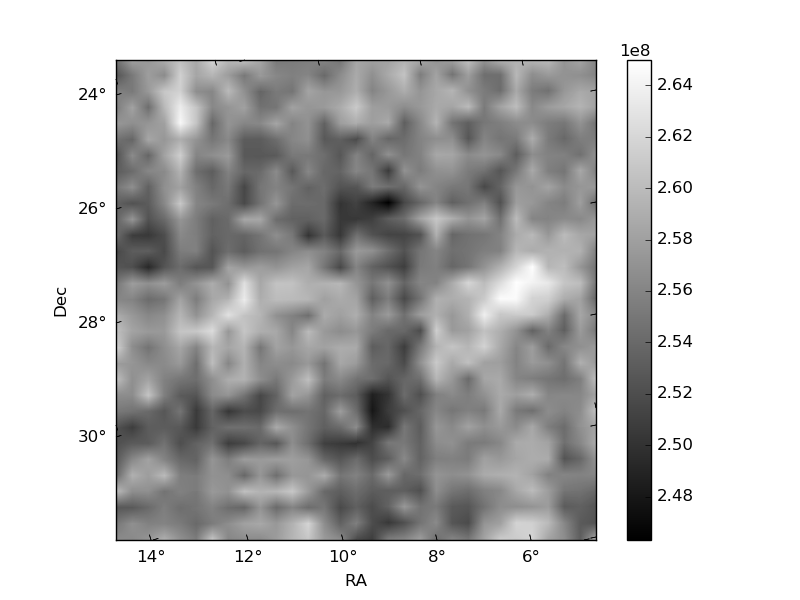
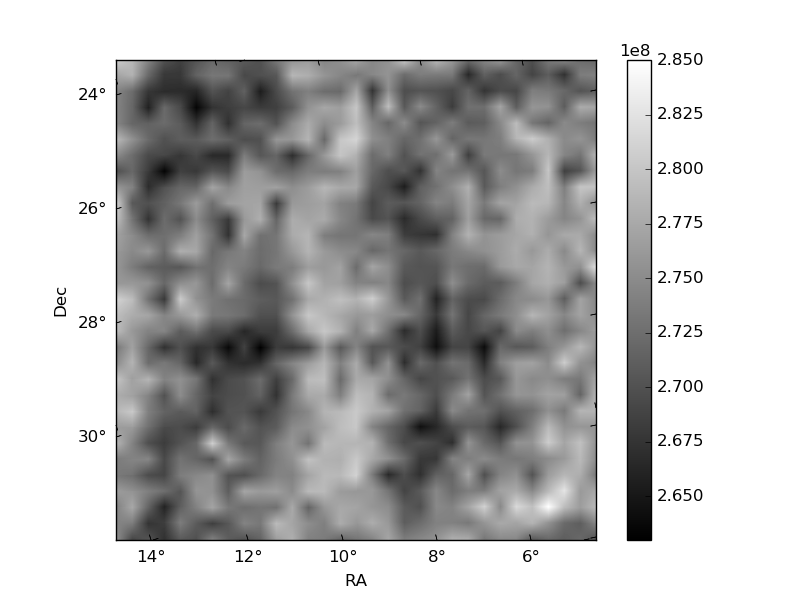
Histogram calculated using DETX and DETY for each event in the final _common_clean file
| Quadrant A | 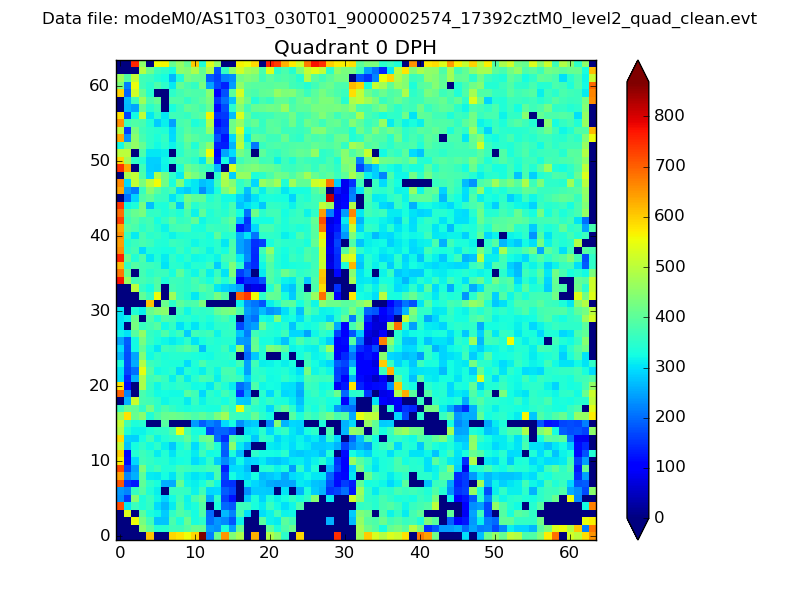 |
 |
Quadrant B |
|---|---|---|---|
| Quadrant D | 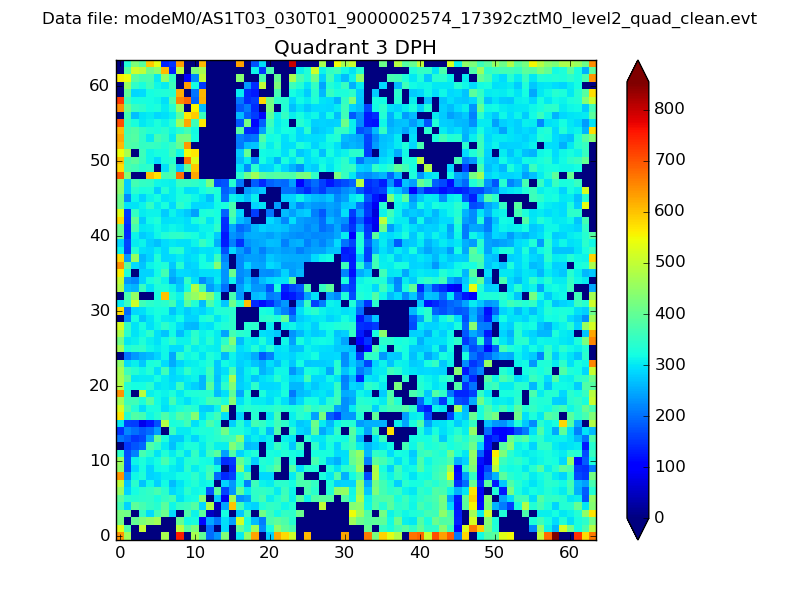 |
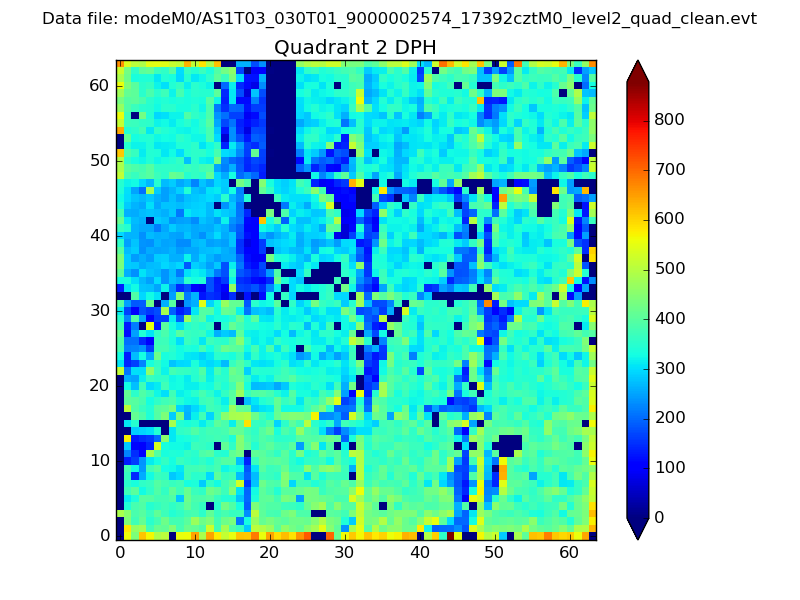 |
Quadrant C |
| Plot type | Count rate plots | Images |
|---|---|---|
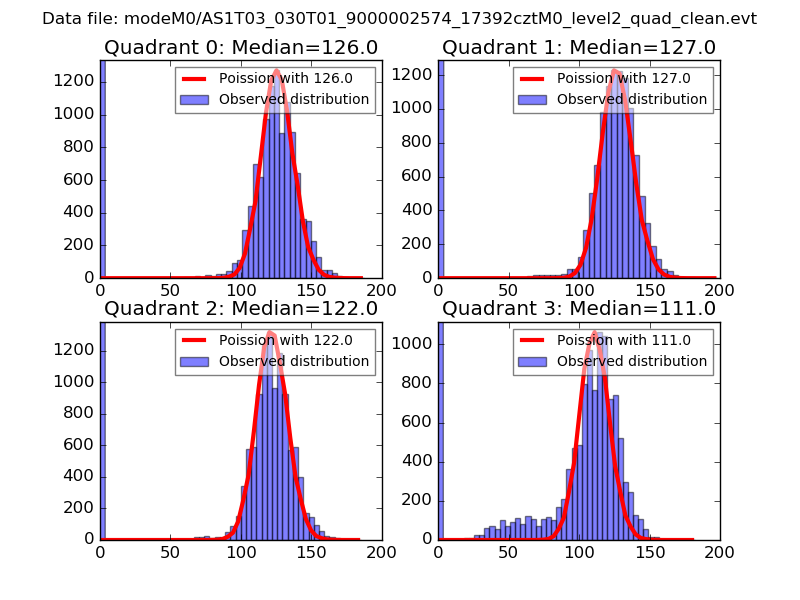
| Comparison with Poisson distribution Blue bars denote a histogram of data divided into 1 sec bins. Red curve is a Poisson curve with rate = median count rate of data. |
 |
 |
| Quadrant-wise count rates Data is divided into 100 sec bins |
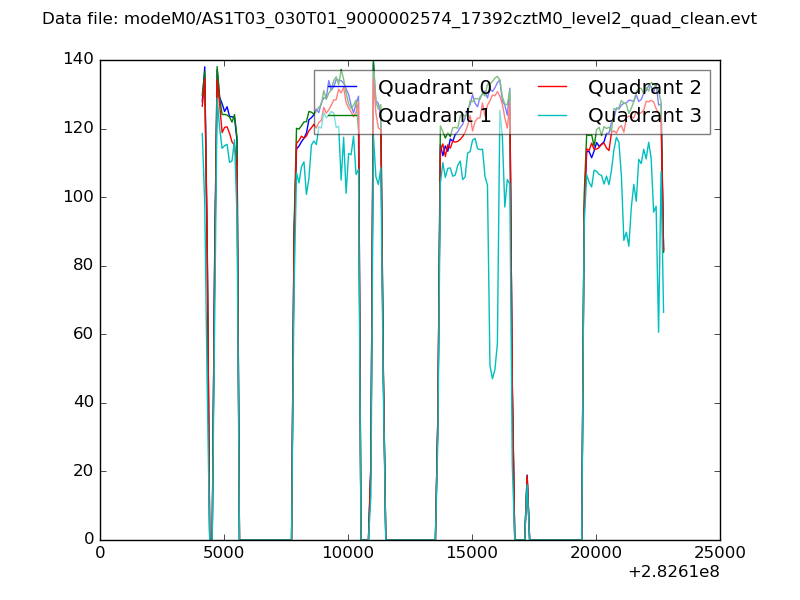 |
|
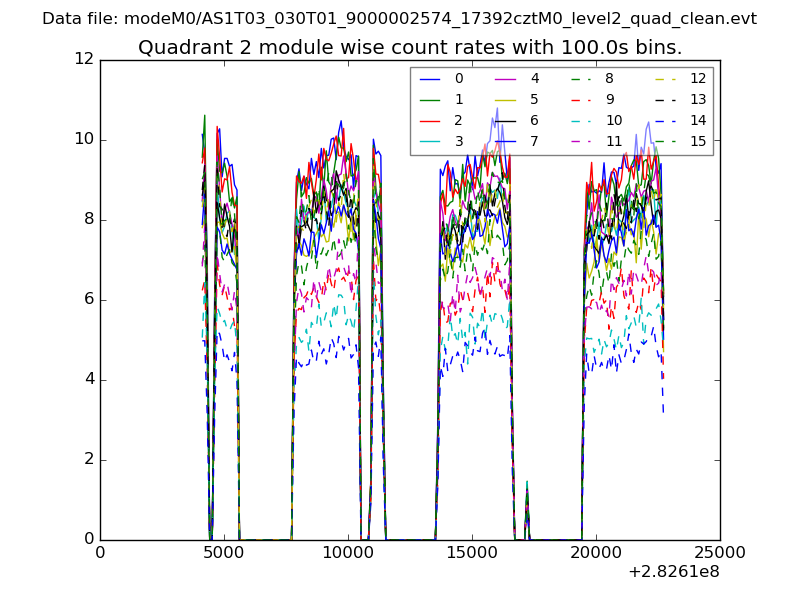
| Module-wise count rates for Quadrant A Data is divided into 100 sec bins |
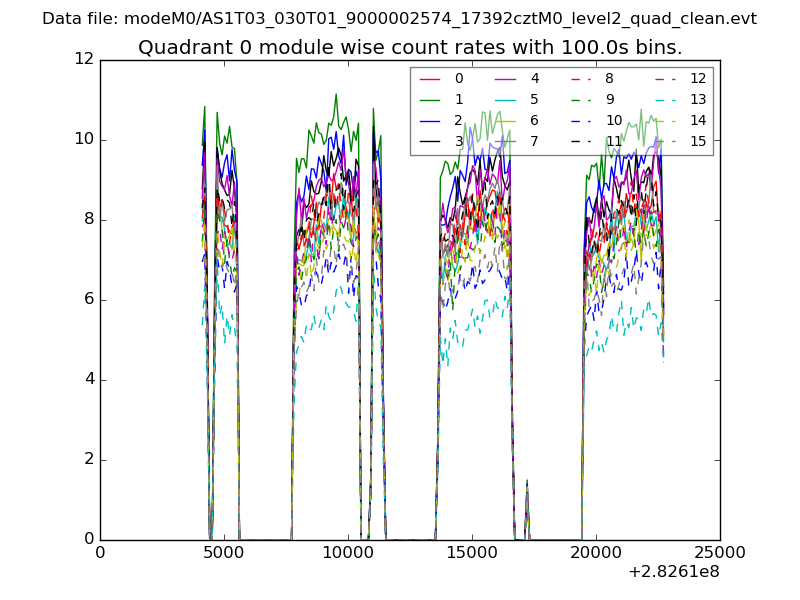 |
 |
| Module-wise count rates for Quadrant B Data is divided into 100 sec bins |
 |
 |
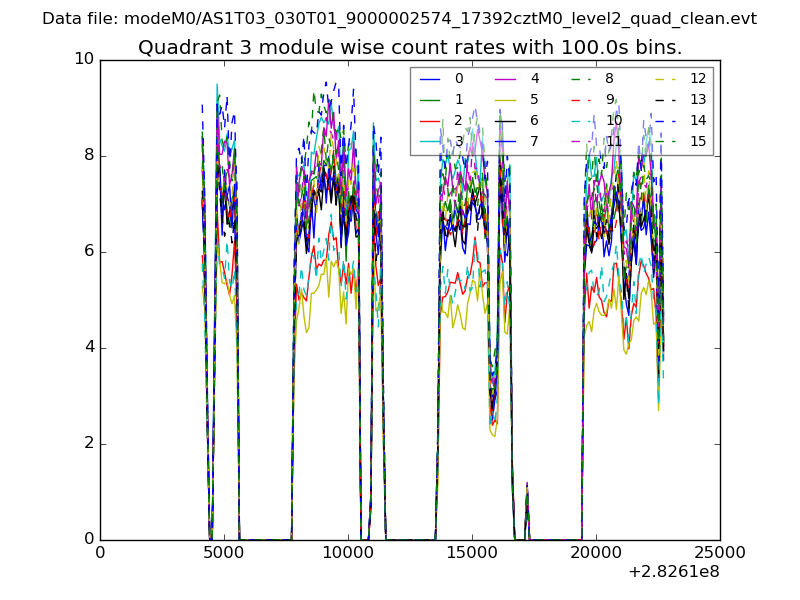
| Module-wise count rates for Quadrant C Data is divided into 100 sec bins |
 |
 |
| Module-wise count rates for Quadrant D Data is divided into 100 sec bins |
 |
 |
| Parameter | Plot |
|---|---|
| CZT HV Monitor |  |
| D_VDD | 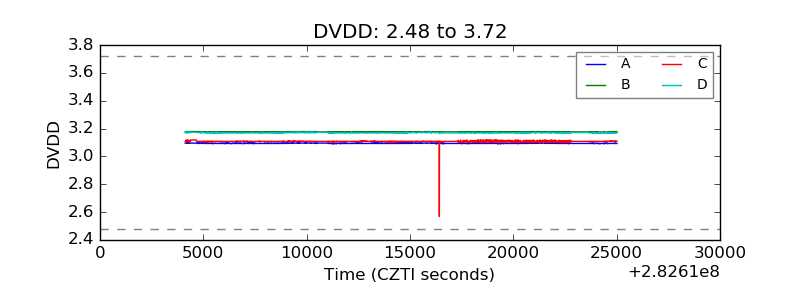 |
| Temperature 1 | 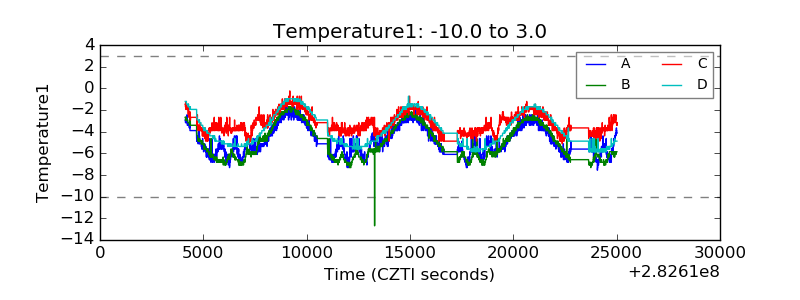 |
| Veto HV Monitor | 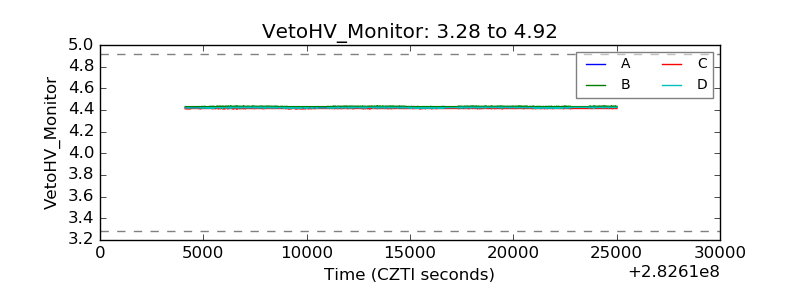 |
| Veto LLD | 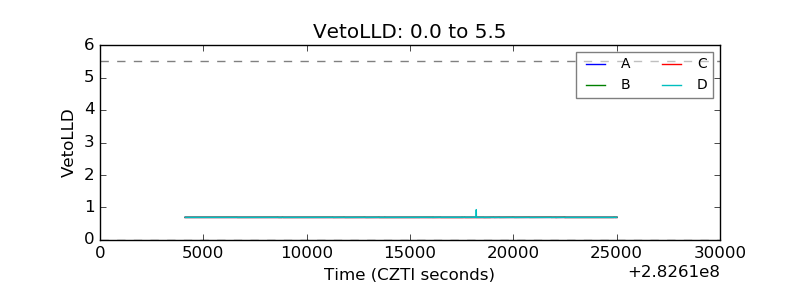 |
| Alpha Counter | 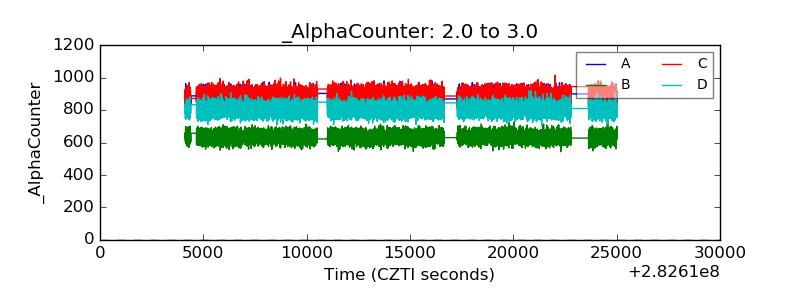 |
| _CPM_Rate | 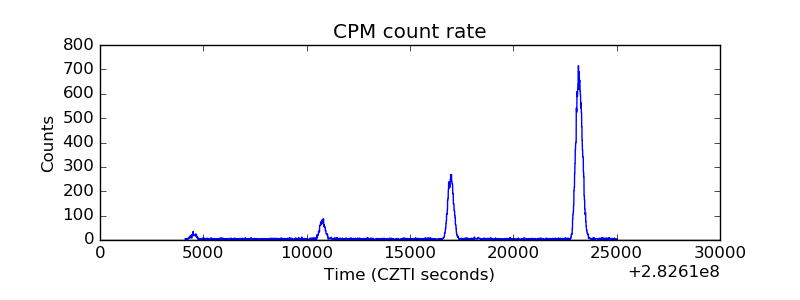 |
| CZT Counter |  |
| +2.5 Volts monitor |  |
| +5 Volts monitor | 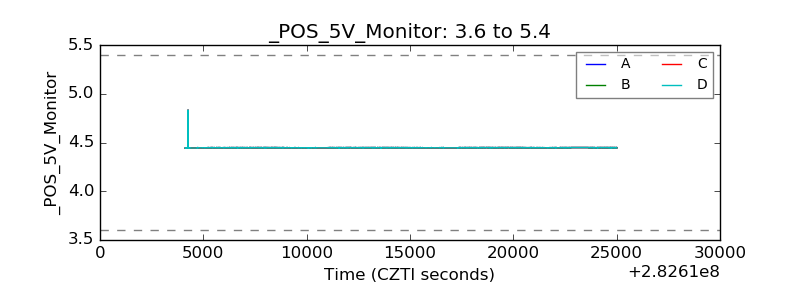 |
| _ROLL_ROT | 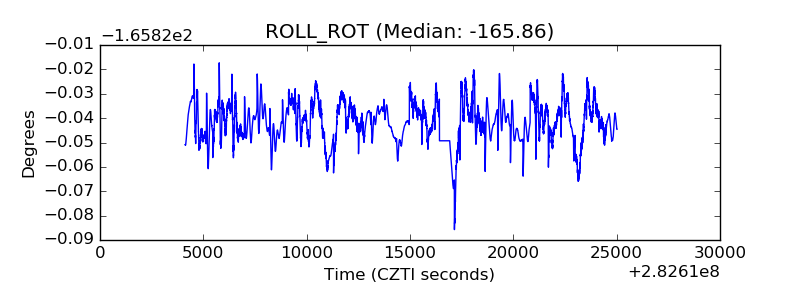 |
| _Roll_DEC | 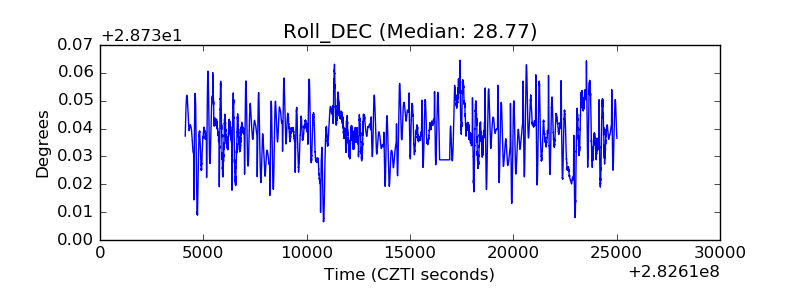 |
| _Roll_RA | 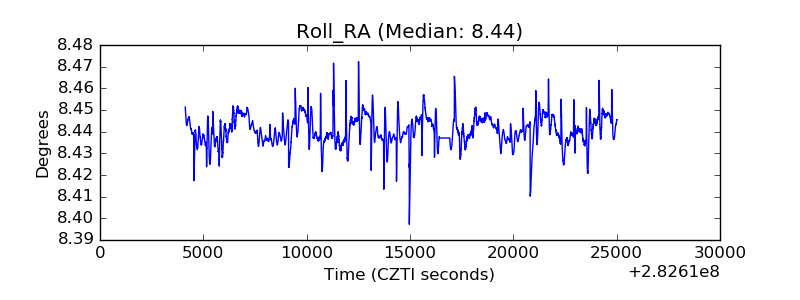 |
| Veto Counter | 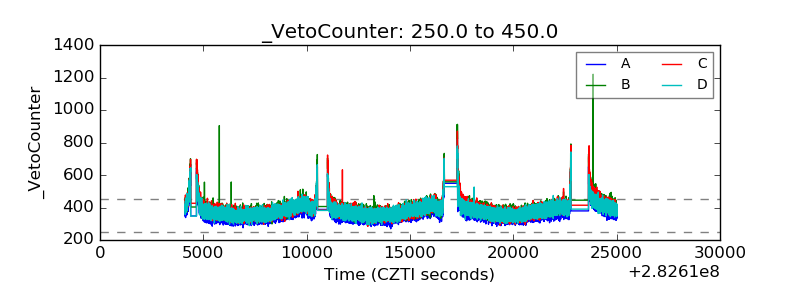 |