| Param | Original file | Final file |
|---|---|---|
| Filename | modeM0/AS1T03_030T01_9000002574_17395cztM0_level2.evt | modeM0/AS1T03_030T01_9000002574_17395cztM0_level2_quad_clean.evt |
| Size (bytes) | 580,360,320 | 82,226,880 |
| Size | 553.5 MB | 78.4 MB |
| Events in quadrant A | 3,242,393 | 532,404 |
| Events in quadrant B | 3,292,730 | 537,712 |
| Events in quadrant C | 3,432,309 | 510,362 |
| Events in quadrant D | 7,170,352 | 457,585 |
| Mode M0 | |||
|---|---|---|---|
| Quadrant | BADHDUFLAG | Total packets | Discarded packets |
| A | 0 | 13691 | 2 |
| B | 0 | 13864 | 2 |
| C | 0 | 14063 | 2 |
| D | 0 | 25737 | 2 |
| Mode SS | |||
|---|---|---|---|
| Quadrant | BADHDUFLAG | Total packets | Discarded packets |
| A | 0 | 132 | 0 |
| B | 0 | 132 | 0 |
| C | 0 | 132 | 0 |
| D | 0 | 132 | 0 |
| Mode M9 | |||
|---|---|---|---|
| Quadrant | BADHDUFLAG | Total packets | Discarded packets |
| A | 0 | 21 | 0 |
| B | 0 | 22 | 0 |
| C | 0 | 22 | 0 |
| D | 0 | 22 | 0 |
| Quadrant | Total seconds | Saturated seconds | Saturation percentage |
|---|---|---|---|
| A | 6476 | 68 | 1.050031% |
| B | 6476 | 78 | 1.204447% |
| C | 6476 | 86 | 1.327980% |
| D | 6476 | 1064 | 16.429895% |
Noise dominated data is calculated using 1-second bins in cleaned event files. If a bin has >2000 counts, and if more than 50% of those come from <1% of pixels, then it is considered to be noise-dominated and hence unusable.
| Quadrant | # 1 sec bins | Bins with >0 counts | Bins with >2000 counts | High rate bins dominated by noise | Noise dominated (total time) | Noise dominated (detector-on time) | Marked lightcurve |
|---|---|---|---|---|---|---|---|
| A | 7596 | 6476 | 0 | 0 | 0.00% | 0.00% | 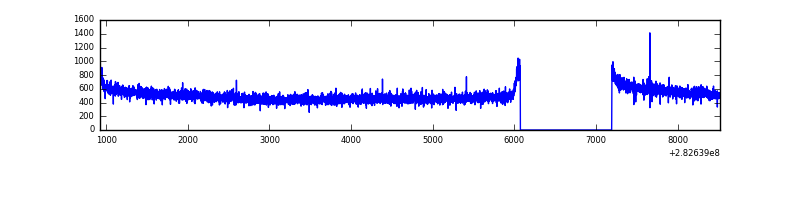 |
| B | 7596 | 6476 | 0 | 0 | 0.00% | 0.00% | 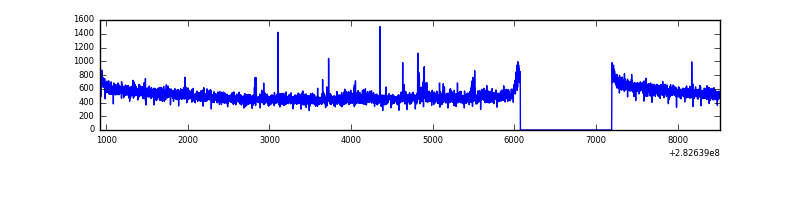 |
| C | 7596 | 6477 | 1 | 1 | 0.01% | 0.02% | 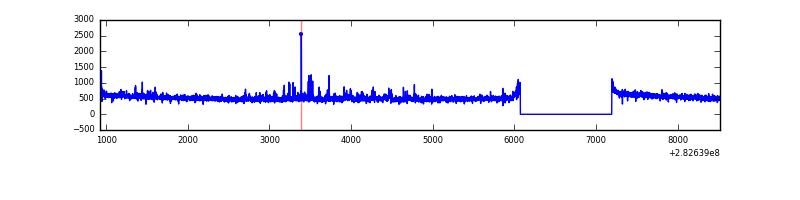 |
| D | 7596 | 6477 | 971 | 971 | 12.78% | 14.99% | 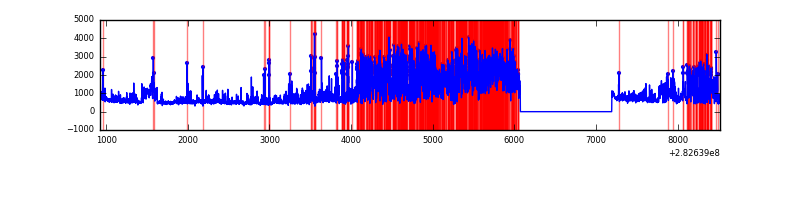 |
Top three noisy pixels from each quadrant. If the there are fewer than three noisy pixels in the level2.evt file, extra rows are filled as -1
| Pixel properties | Quadrant properties | ||||||
|---|---|---|---|---|---|---|---|
| Quadrant | DetID | PixID | Counts | Sigma | Mean | Median | Sigma |
| A | 0 | 226 | 7336 | 38.38 | 842 | 827 | 169.6 |
| A | 0 | 13 | 6839 | 35.45 | 842 | 827 | 169.6 |
| A | 12 | 194 | 6053 | 30.81 | 842 | 827 | 169.6 |
| B | 12 | 111 | 18738 | 112.26 | 835 | 815 | 159.7 |
| B | 11 | 111 | 16714 | 99.58 | 835 | 815 | 159.7 |
| B | 14 | 111 | 14206 | 83.87 | 835 | 815 | 159.7 |
| C | 14 | 238 | 122383 | 662.79 | 791 | 794 | 183.5 |
| C | 14 | 128 | 98702 | 533.7 | 791 | 794 | 183.5 |
| C | 3 | 233 | 74630 | 402.49 | 791 | 794 | 183.5 |
| D | 1 | 52 | 2249002 | 11898.49 | 774 | 751 | 189.0 |
| D | 11 | 176 | 1329383 | 7031.56 | 774 | 751 | 189.0 |
| D | 13 | 232 | 516390 | 2728.93 | 774 | 751 | 189.0 |
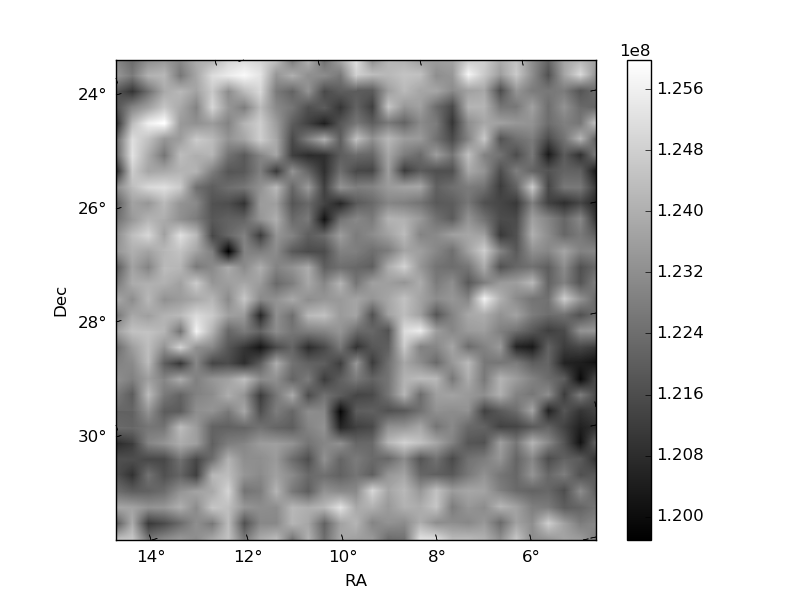
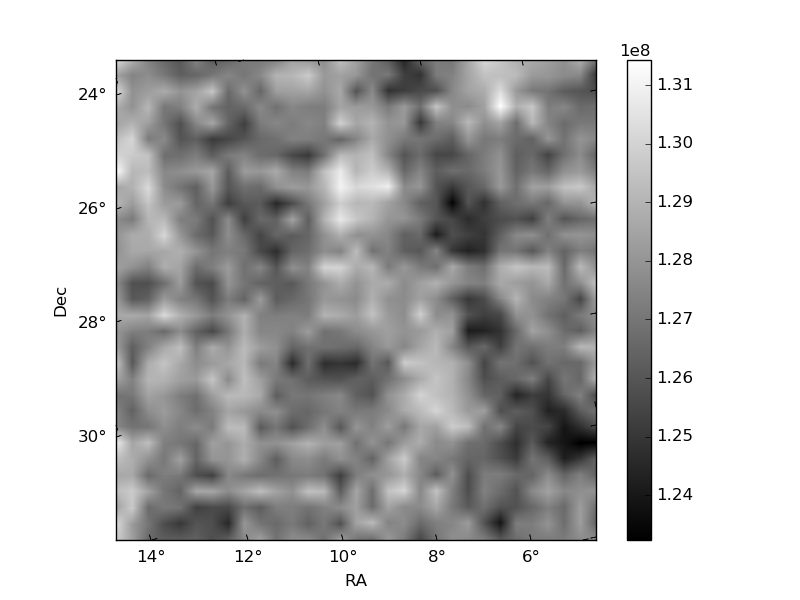
Histogram calculated using DETX and DETY for each event in the final _common_clean file
| Quadrant A | 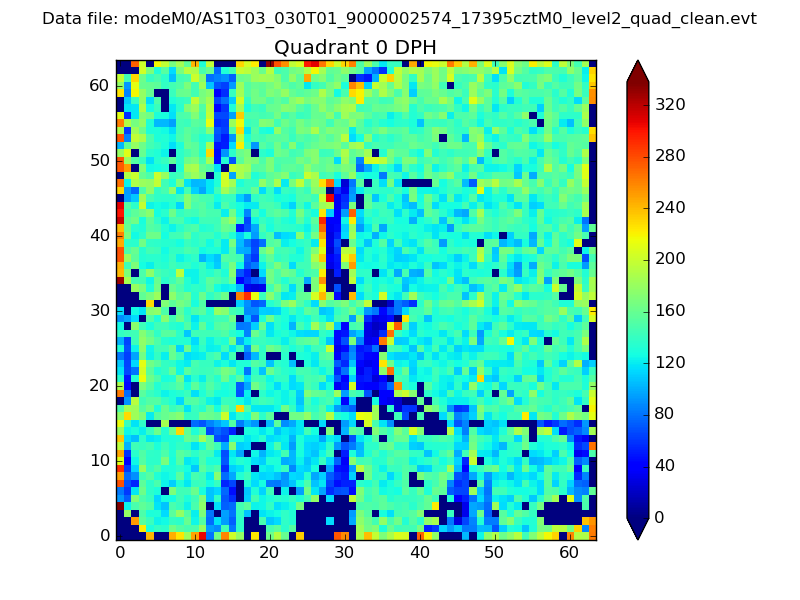 |
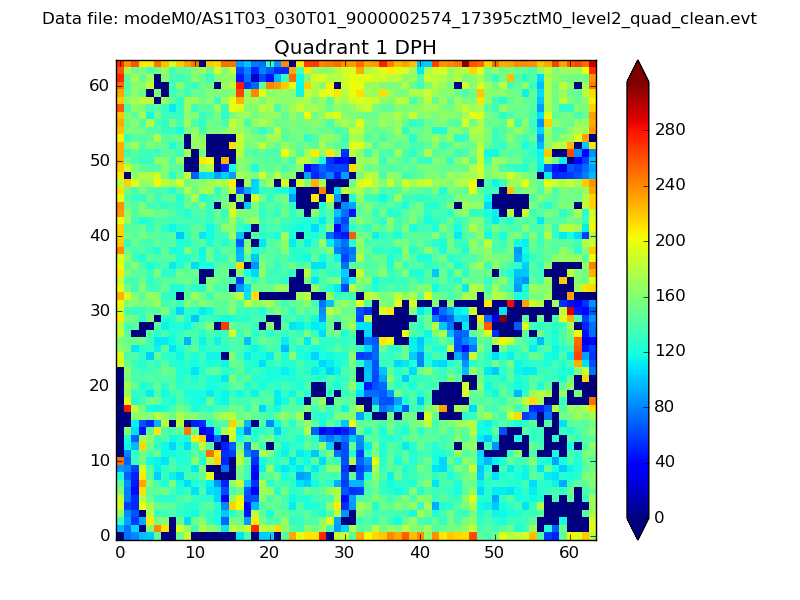 |
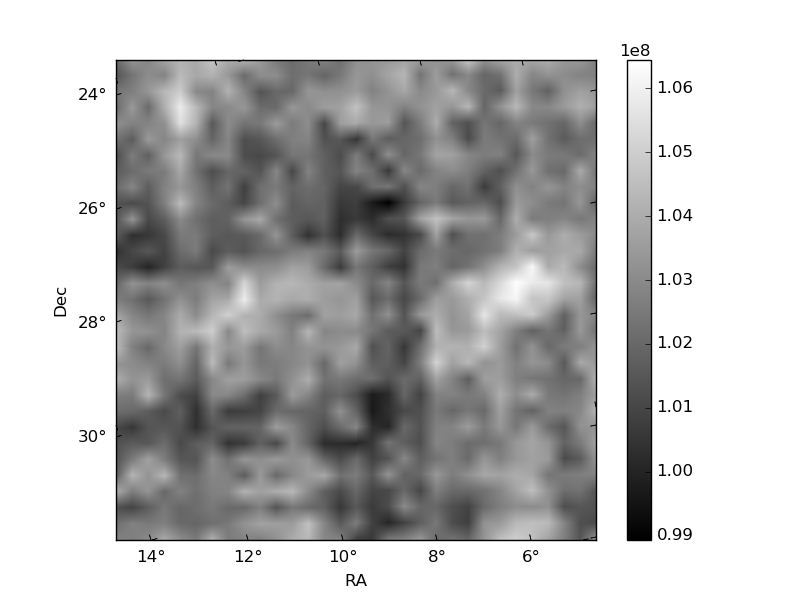
Quadrant B |
|---|---|---|---|
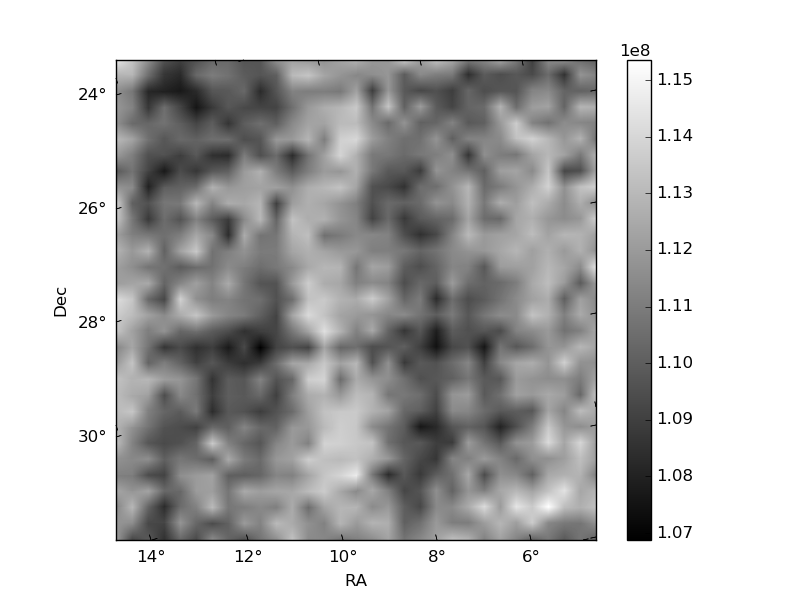
| Quadrant D | 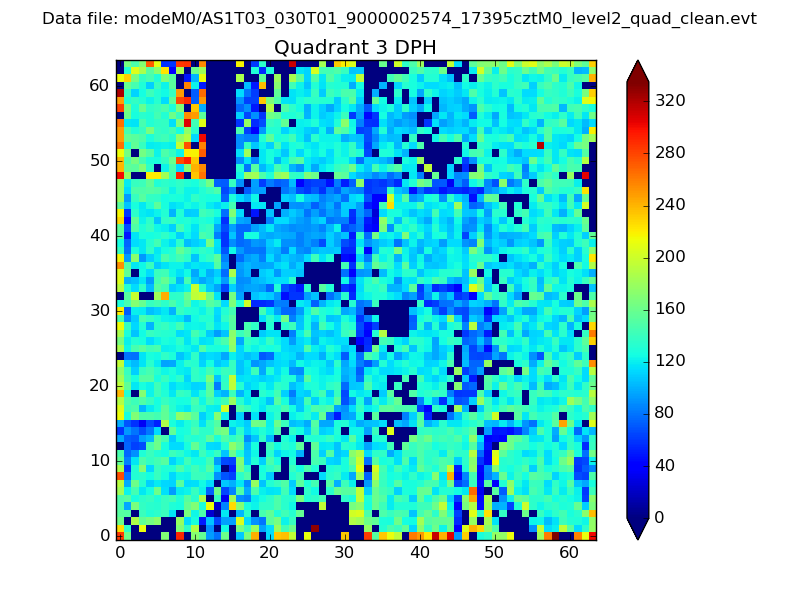 |
 |
Quadrant C |
| Plot type | Count rate plots | Images |
|---|---|---|
| Comparison with Poisson distribution Blue bars denote a histogram of data divided into 1 sec bins. Red curve is a Poisson curve with rate = median count rate of data. |
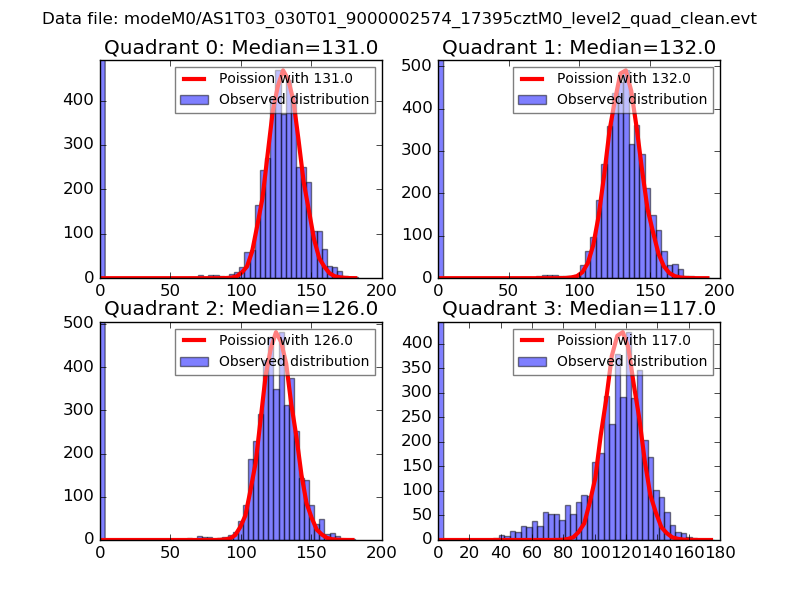 |
 |
| Quadrant-wise count rates Data is divided into 100 sec bins |
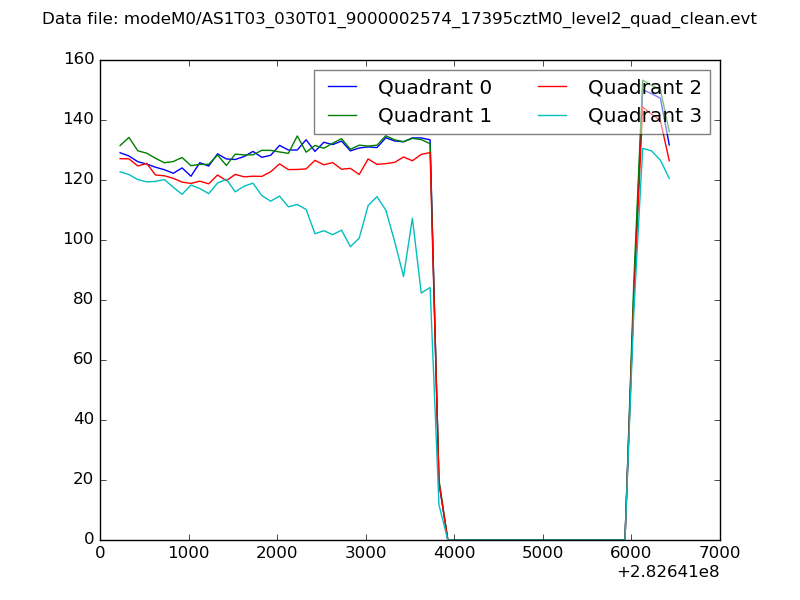 |
|
| Module-wise count rates for Quadrant A Data is divided into 100 sec bins |
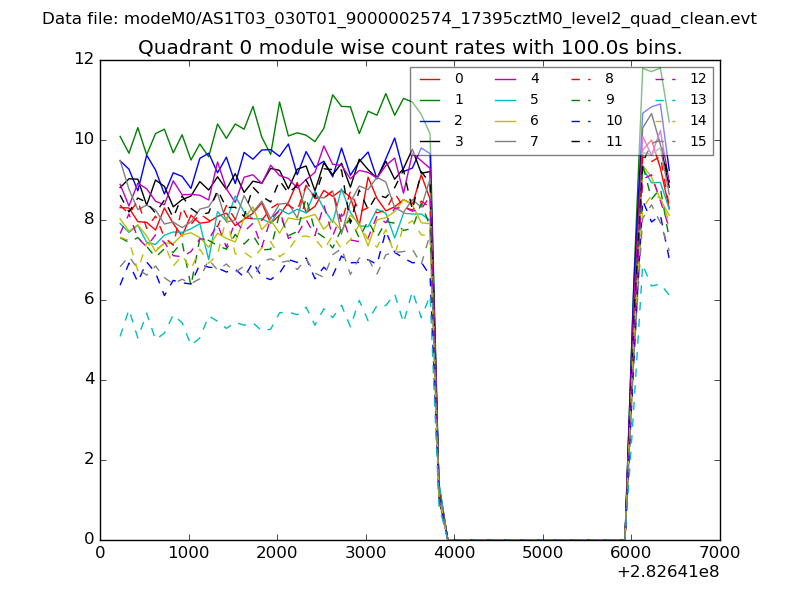 |
 |
| Module-wise count rates for Quadrant B Data is divided into 100 sec bins |
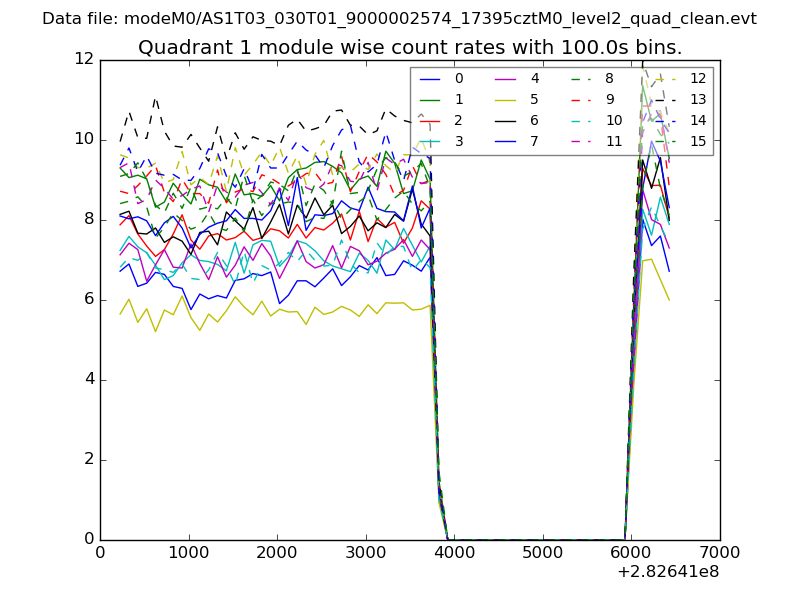 |
 |
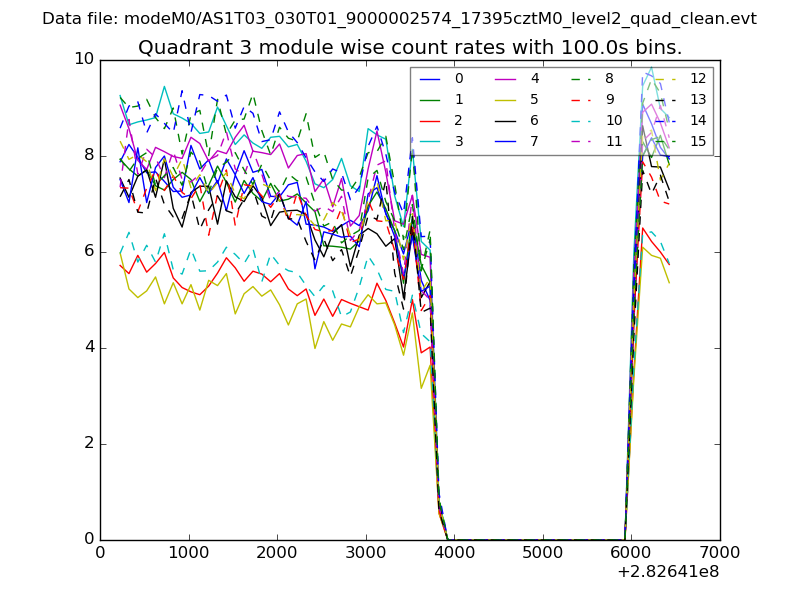
| Module-wise count rates for Quadrant C Data is divided into 100 sec bins |
 |
 |
| Module-wise count rates for Quadrant D Data is divided into 100 sec bins |
 |
 |
| Parameter | Plot |
|---|---|
| CZT HV Monitor | 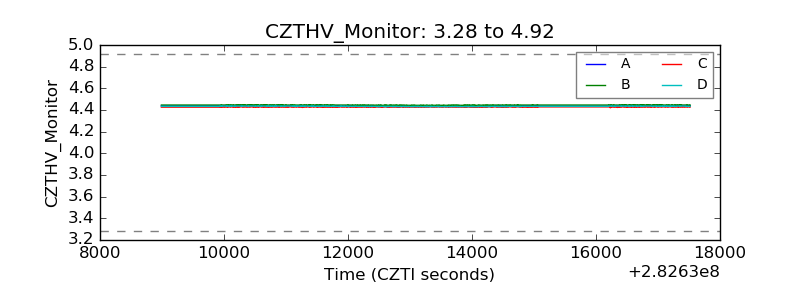 |
| D_VDD | 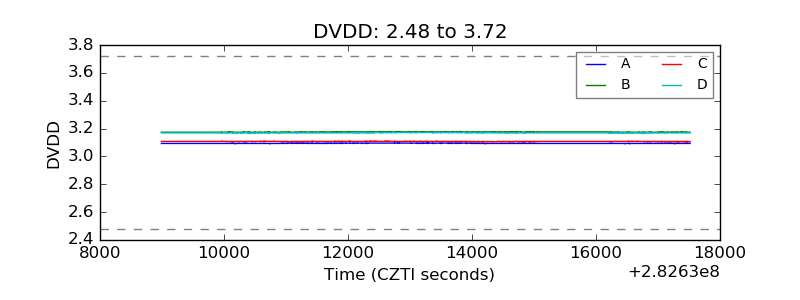 |
| Temperature 1 | 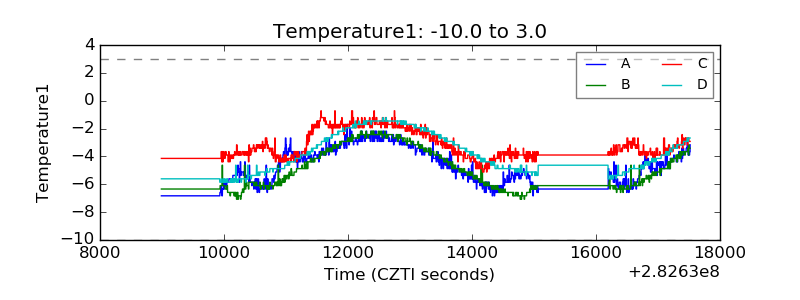 |
| Veto HV Monitor | 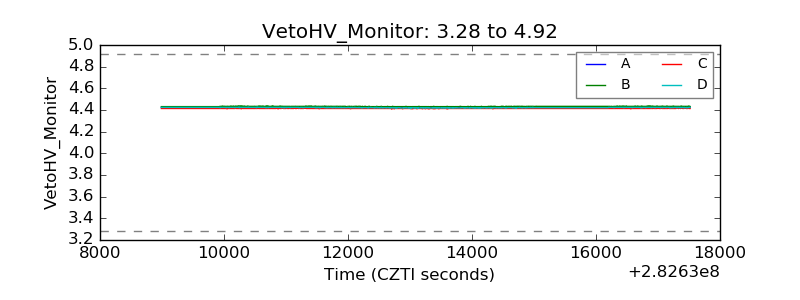 |
| Veto LLD | 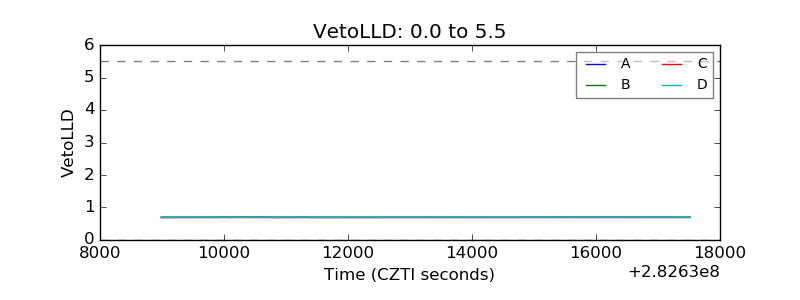 |
| Alpha Counter | 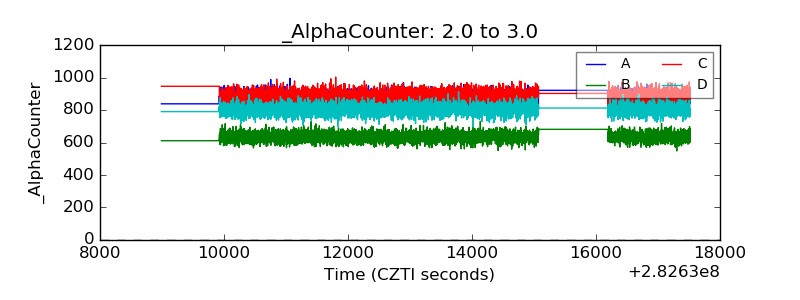 |
| _CPM_Rate | 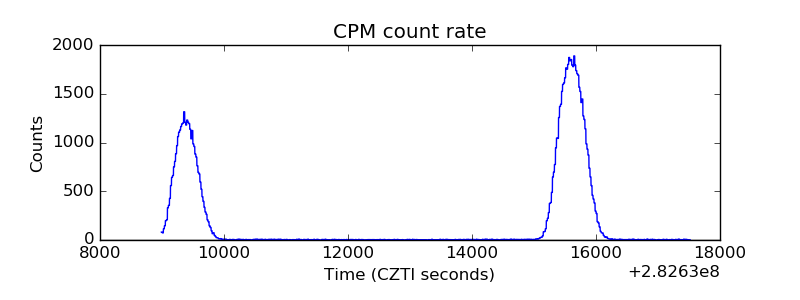 |
| CZT Counter |  |
| +2.5 Volts monitor | 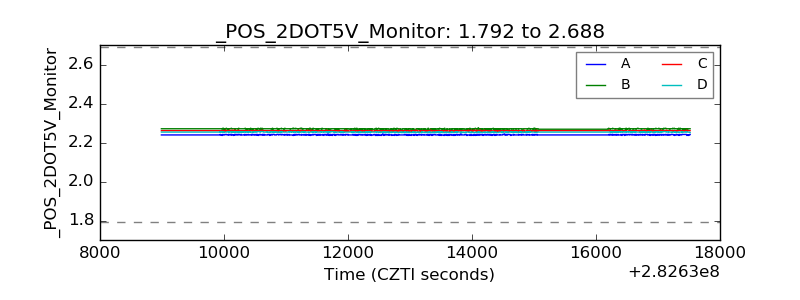 |
| +5 Volts monitor |  |
| _ROLL_ROT | 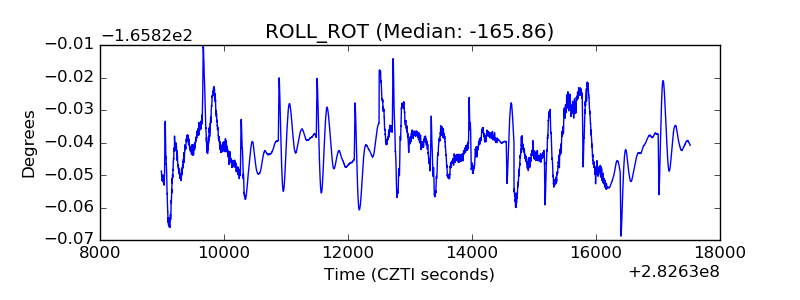 |
| _Roll_DEC | 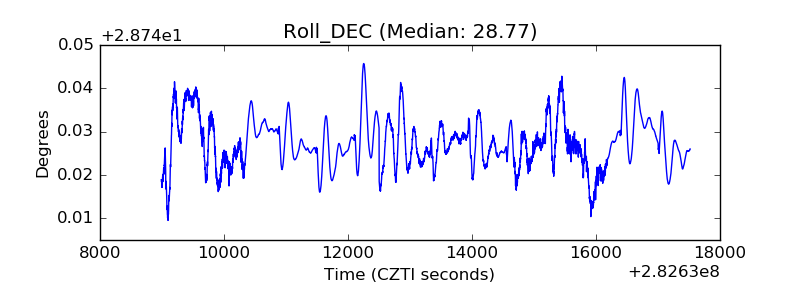 |
| _Roll_RA | 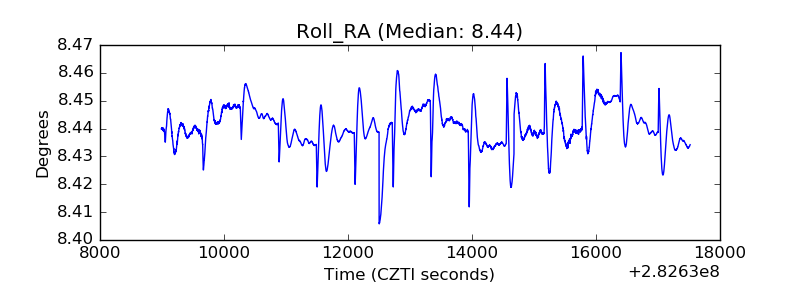 |
| Veto Counter | 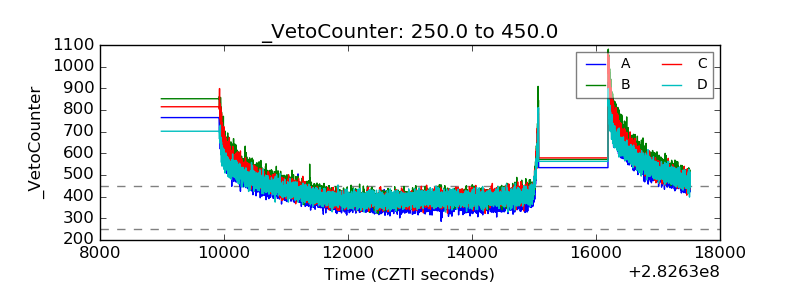 |