| Param | Original file | Final file |
|---|---|---|
| Filename | modeM0/AS1T03_030T01_9000002574_17397cztM0_level2.evt | modeM0/AS1T03_030T01_9000002574_17397cztM0_level2_quad_clean.evt |
| Size (bytes) | 507,096,000 | 110,695,680 |
| Size | 483.6 MB | 105.6 MB |
| Events in quadrant A | 3,348,095 | 757,682 |
| Events in quadrant B | 3,505,362 | 759,841 |
| Events in quadrant C | 3,422,042 | 704,440 |
| Events in quadrant D | 4,659,863 | 696,236 |
| Mode M0 | |||
|---|---|---|---|
| Quadrant | BADHDUFLAG | Total packets | Discarded packets |
| A | 0 | 13933 | 2 |
| B | 0 | 14369 | 2 |
| C | 0 | 13917 | 2 |
| D | 0 | 18090 | 2 |
| Mode SS | |||
|---|---|---|---|
| Quadrant | BADHDUFLAG | Total packets | Discarded packets |
| A | 0 | 126 | 0 |
| B | 0 | 126 | 0 |
| C | 0 | 126 | 0 |
| D | 0 | 126 | 0 |
| Mode M9 | |||
|---|---|---|---|
| Quadrant | BADHDUFLAG | Total packets | Discarded packets |
| A | 0 | 23 | 0 |
| B | 0 | 24 | 0 |
| C | 0 | 24 | 0 |
| D | 0 | 24 | 0 |
| Quadrant | Total seconds | Saturated seconds | Saturation percentage |
|---|---|---|---|
| A | 6227 | 107 | 1.718323% |
| B | 6227 | 129 | 2.071624% |
| C | 6227 | 128 | 2.055564% |
| D | 6227 | 167 | 2.681869% |
Noise dominated data is calculated using 1-second bins in cleaned event files. If a bin has >2000 counts, and if more than 50% of those come from <1% of pixels, then it is considered to be noise-dominated and hence unusable.
| Quadrant | # 1 sec bins | Bins with >0 counts | Bins with >2000 counts | High rate bins dominated by noise | Noise dominated (total time) | Noise dominated (detector-on time) | Marked lightcurve |
|---|---|---|---|---|---|---|---|
| A | 7517 | 6227 | 0 | 0 | 0.00% | 0.00% | 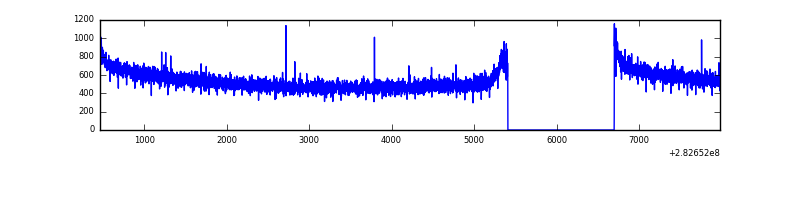 |
| B | 7517 | 6227 | 21 | 21 | 0.28% | 0.34% | 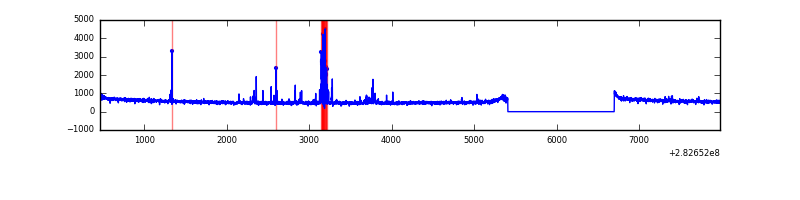 |
| C | 7517 | 6227 | 0 | 0 | 0.00% | 0.00% | 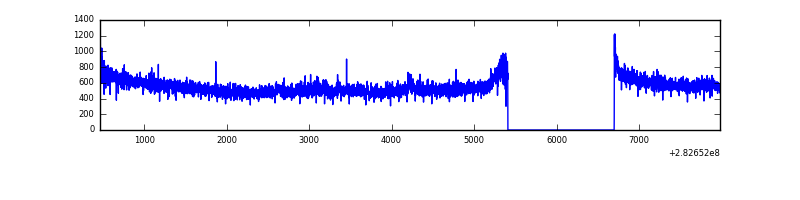 |
| D | 7517 | 6227 | 72 | 72 | 0.96% | 1.16% | 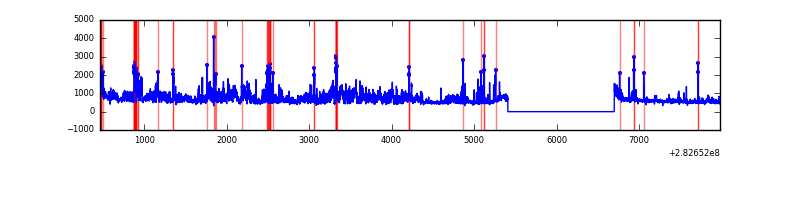 |
Top three noisy pixels from each quadrant. If the there are fewer than three noisy pixels in the level2.evt file, extra rows are filled as -1
| Pixel properties | Quadrant properties | ||||||
|---|---|---|---|---|---|---|---|
| Quadrant | DetID | PixID | Counts | Sigma | Mean | Median | Sigma |
| A | 0 | 226 | 7868 | 40.85 | 870 | 855 | 171.7 |
| A | 12 | 194 | 6346 | 31.98 | 870 | 855 | 171.7 |
| A | 3 | 137 | 5807 | 28.84 | 870 | 855 | 171.7 |
| B | 7 | 220 | 85737 | 530.07 | 857 | 838 | 160.2 |
| B | 0 | 197 | 18553 | 110.6 | 857 | 838 | 160.2 |
| B | 12 | 111 | 18046 | 107.44 | 857 | 838 | 160.2 |
| C | 3 | 233 | 129965 | 698.36 | 804 | 810 | 184.9 |
| C | 14 | 238 | 128381 | 689.8 | 804 | 810 | 184.9 |
| C | 5 | 218 | 28763 | 151.15 | 804 | 810 | 184.9 |
| D | 1 | 52 | 1153443 | 5754.03 | 831 | 810 | 200.3 |
| D | 13 | 232 | 158950 | 789.45 | 831 | 810 | 200.3 |
| D | 11 | 176 | 89895 | 444.72 | 831 | 810 | 200.3 |
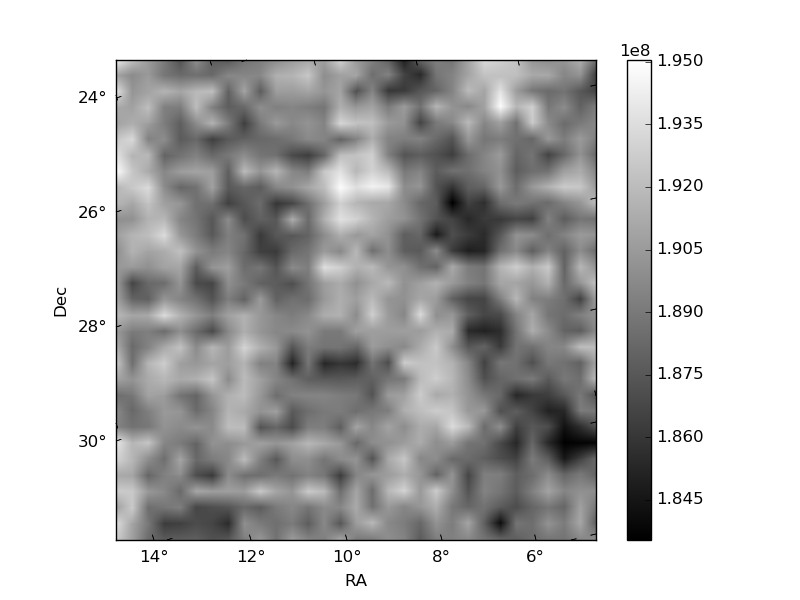
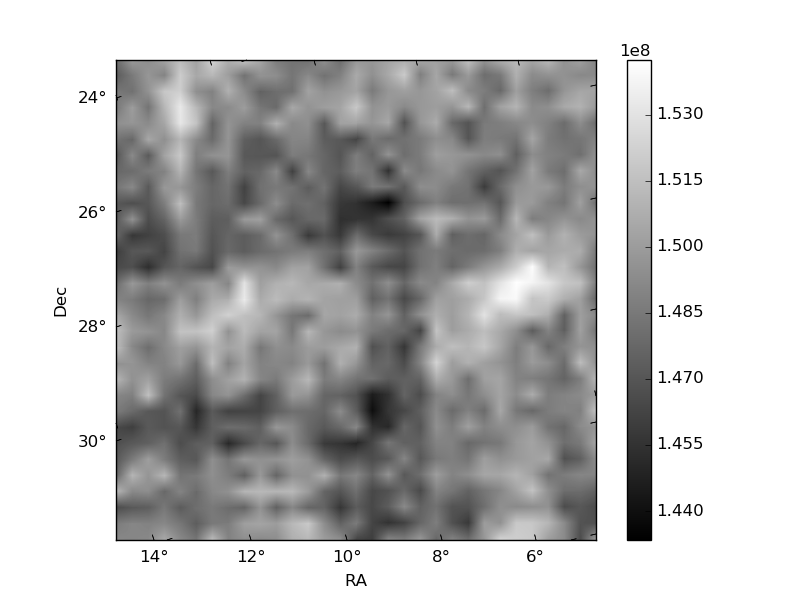
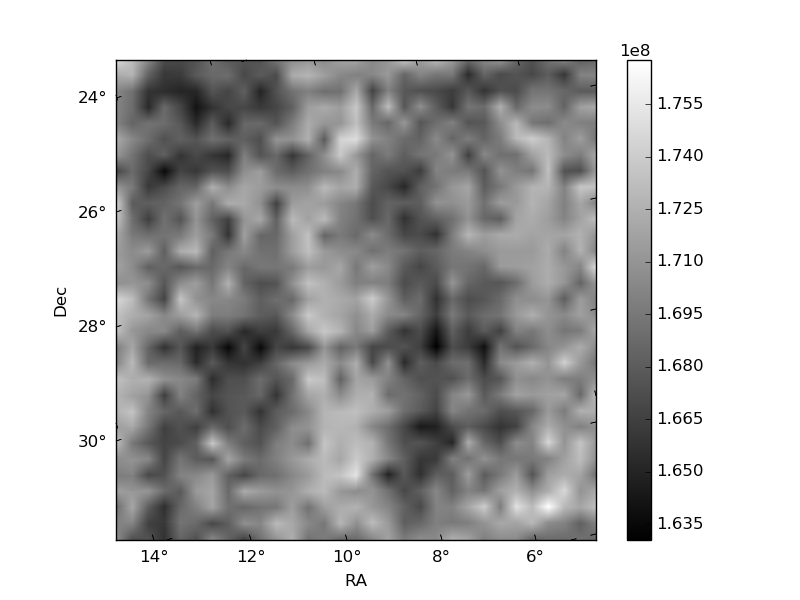
Histogram calculated using DETX and DETY for each event in the final _common_clean file
| Quadrant A | 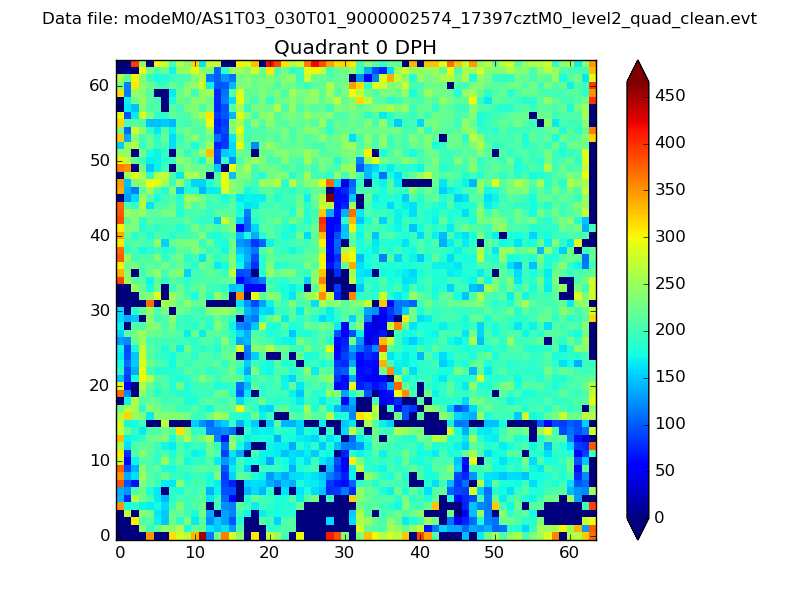 |
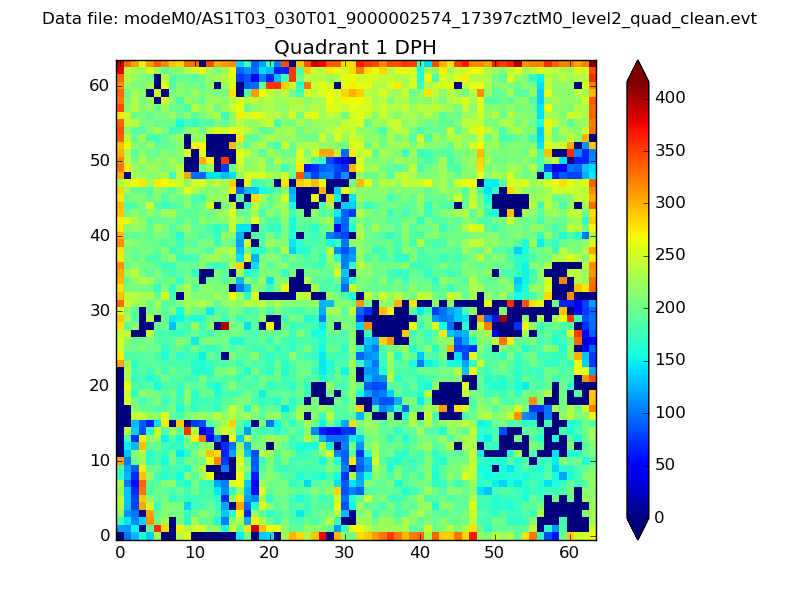 |
Quadrant B |
|---|---|---|---|
| Quadrant D | 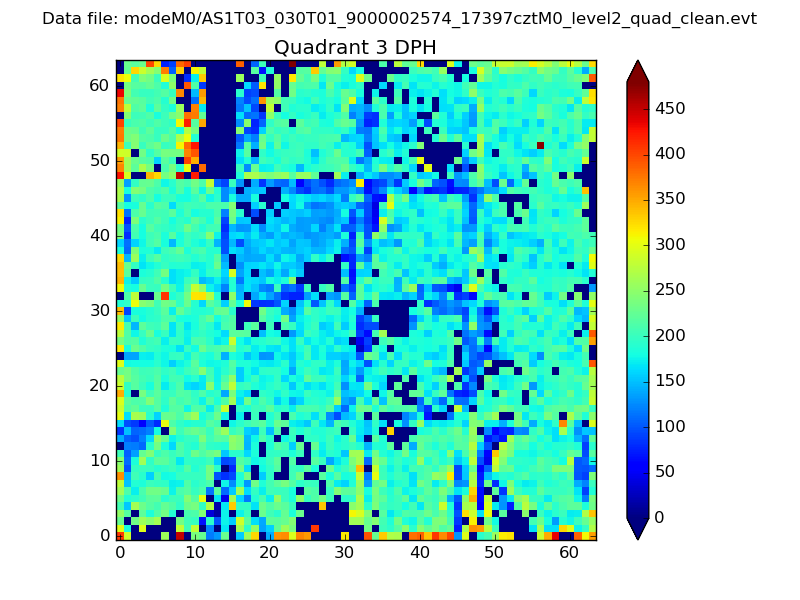 |
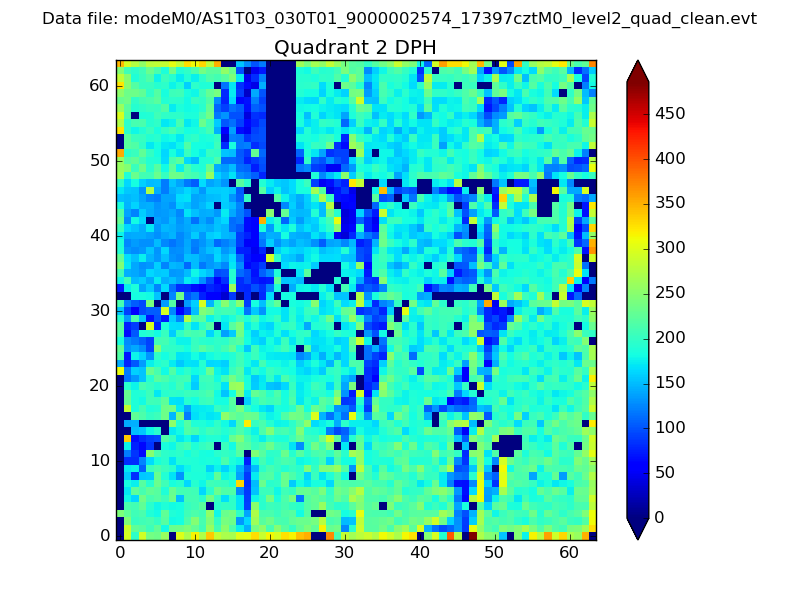 |
Quadrant C |
| Plot type | Count rate plots | Images |
|---|---|---|
| Comparison with Poisson distribution Blue bars denote a histogram of data divided into 1 sec bins. Red curve is a Poisson curve with rate = median count rate of data. |
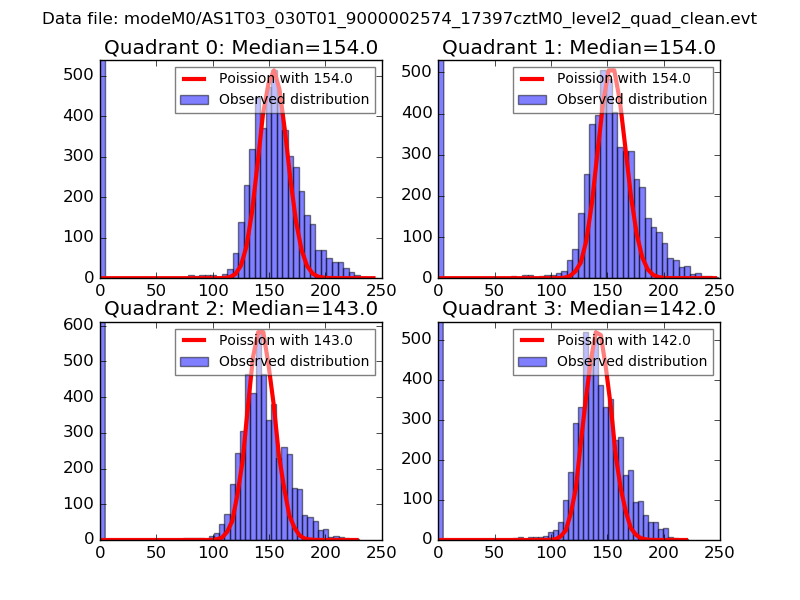 |
 |
| Quadrant-wise count rates Data is divided into 100 sec bins |
 |
|
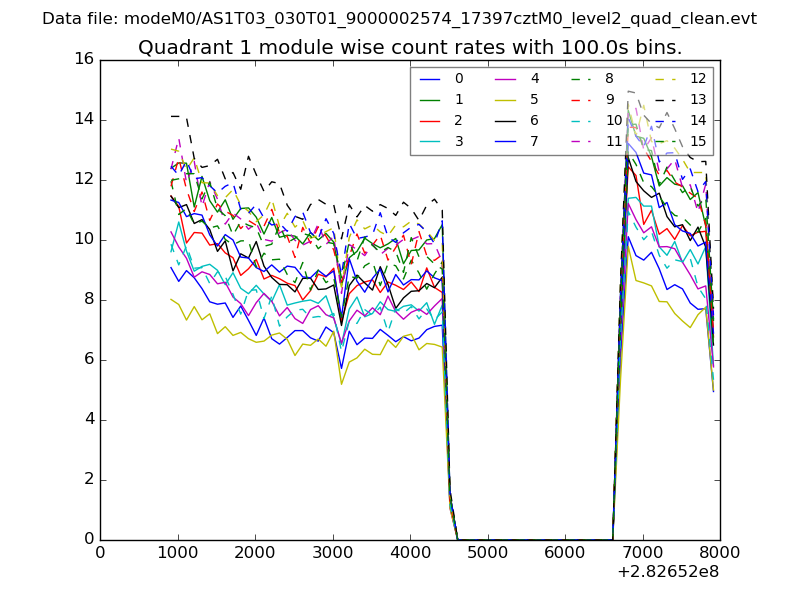
| Module-wise count rates for Quadrant A Data is divided into 100 sec bins |
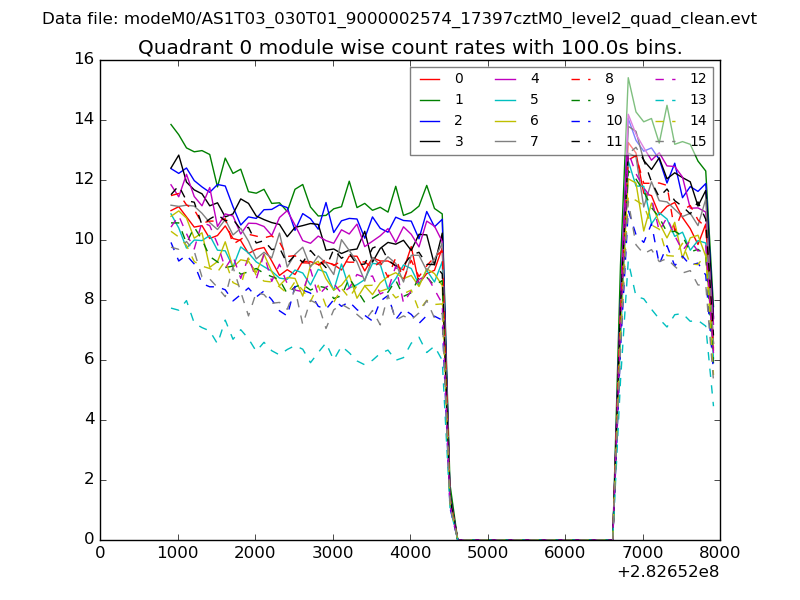 |
 |
| Module-wise count rates for Quadrant B Data is divided into 100 sec bins |
 |
 |
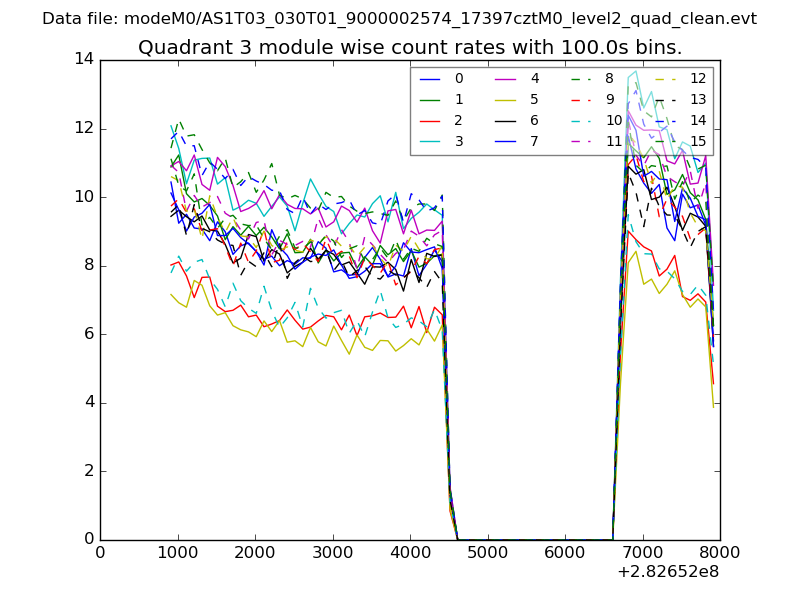
| Module-wise count rates for Quadrant C Data is divided into 100 sec bins |
 |
 |
| Module-wise count rates for Quadrant D Data is divided into 100 sec bins |
 |
 |
| Parameter | Plot |
|---|---|
| CZT HV Monitor | 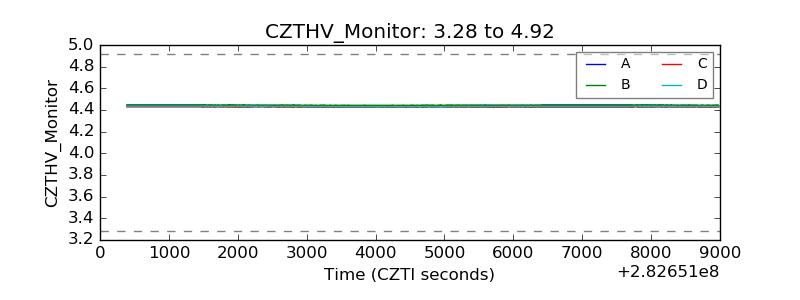 |
| D_VDD | 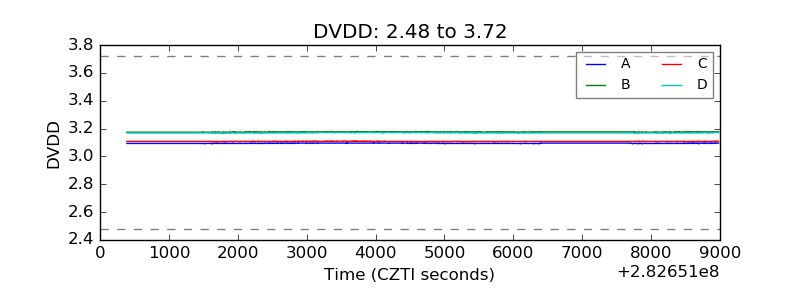 |
| Temperature 1 |  |
| Veto HV Monitor | 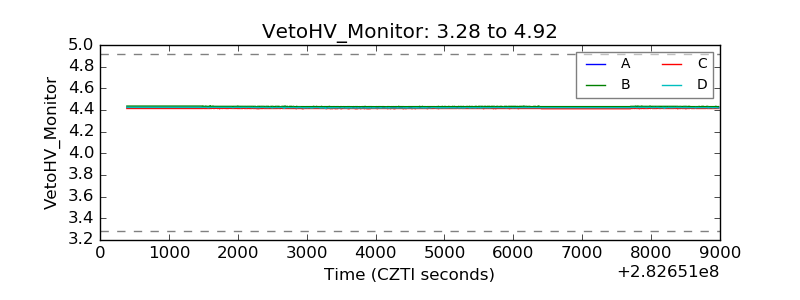 |
| Veto LLD | 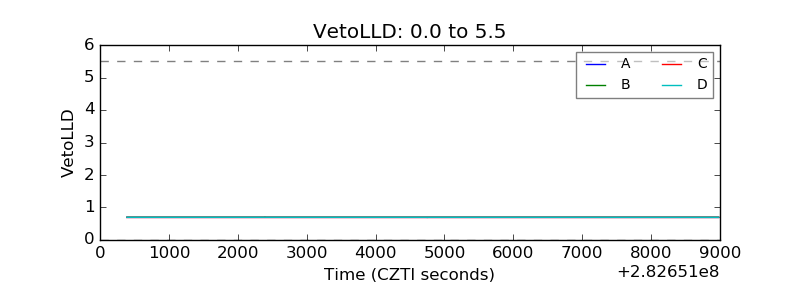 |
| Alpha Counter | 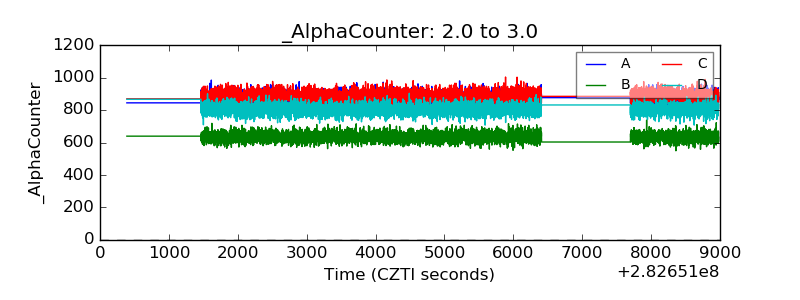 |
| _CPM_Rate | 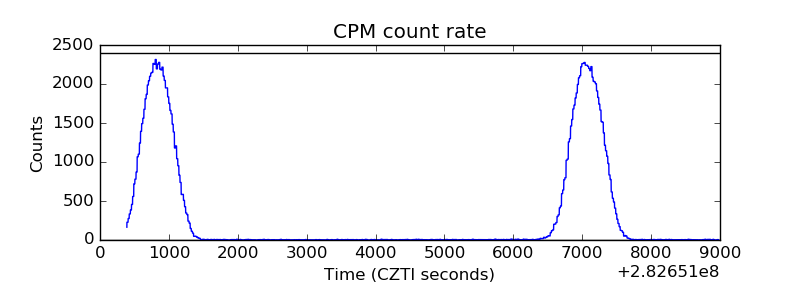 |
| CZT Counter | 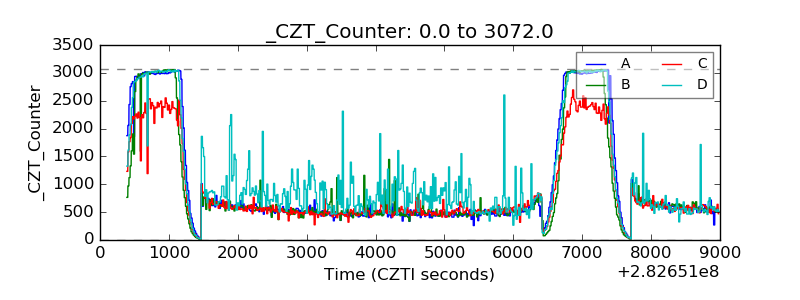 |
| +2.5 Volts monitor |  |
| +5 Volts monitor |  |
| _ROLL_ROT |  |
| _Roll_DEC | 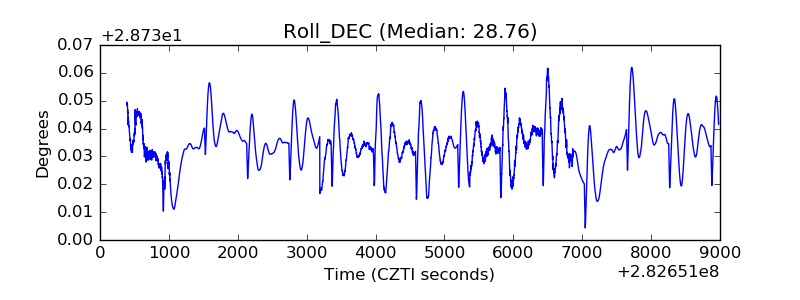 |
| _Roll_RA | 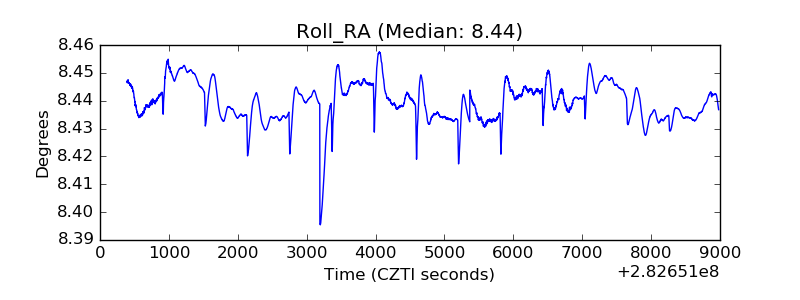 |
| Veto Counter | 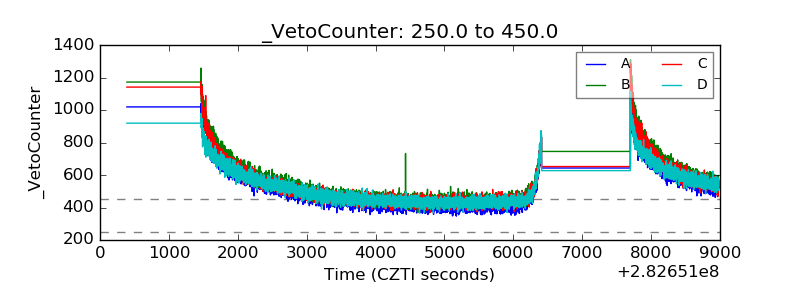 |