| Param | Original file | Final file |
|---|---|---|
| Filename | modeM0/AS1T03_030T01_9000002574_17398cztM0_level2.evt | modeM0/AS1T03_030T01_9000002574_17398cztM0_level2_quad_clean.evt |
| Size (bytes) | 531,048,960 | 114,926,400 |
| Size | 506.4 MB | 109.6 MB |
| Events in quadrant A | 3,343,092 | 795,296 |
| Events in quadrant B | 3,426,774 | 797,654 |
| Events in quadrant C | 3,468,504 | 734,338 |
| Events in quadrant D | 5,420,950 | 717,541 |
| Mode M0 | |||
|---|---|---|---|
| Quadrant | BADHDUFLAG | Total packets | Discarded packets |
| A | 0 | 13839 | 3 |
| B | 0 | 14069 | 2 |
| C | 0 | 13951 | 2 |
| D | 0 | 20315 | 2 |
| Mode SS | |||
|---|---|---|---|
| Quadrant | BADHDUFLAG | Total packets | Discarded packets |
| A | 0 | 126 | 0 |
| B | 0 | 126 | 0 |
| C | 0 | 126 | 0 |
| D | 0 | 126 | 0 |
| Mode M9 | |||
|---|---|---|---|
| Quadrant | BADHDUFLAG | Total packets | Discarded packets |
| A | 0 | 14 | 0 |
| B | 0 | 15 | 0 |
| C | 0 | 15 | 0 |
| D | 0 | 15 | 0 |
| Quadrant | Total seconds | Saturated seconds | Saturation percentage |
|---|---|---|---|
| A | 6251 | 124 | 1.983683% |
| B | 6251 | 125 | 1.999680% |
| C | 6251 | 128 | 2.047672% |
| D | 6251 | 372 | 5.951048% |
Noise dominated data is calculated using 1-second bins in cleaned event files. If a bin has >2000 counts, and if more than 50% of those come from <1% of pixels, then it is considered to be noise-dominated and hence unusable.
| Quadrant | # 1 sec bins | Bins with >0 counts | Bins with >2000 counts | High rate bins dominated by noise | Noise dominated (total time) | Noise dominated (detector-on time) | Marked lightcurve |
|---|---|---|---|---|---|---|---|
| A | 7571 | 6252 | 0 | 0 | 0.00% | 0.00% | 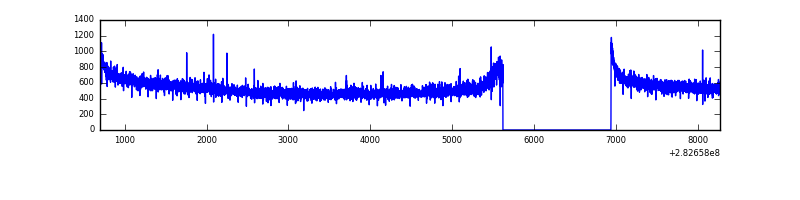 |
| B | 7571 | 6252 | 4 | 4 | 0.05% | 0.06% | 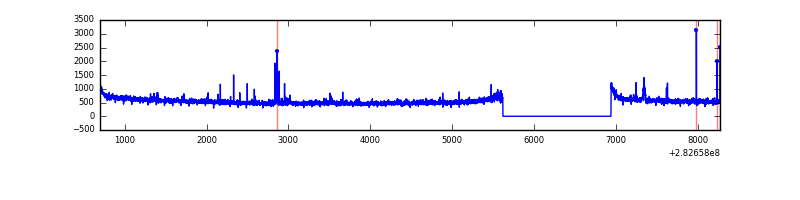 |
| C | 7571 | 6252 | 0 | 0 | 0.00% | 0.00% | 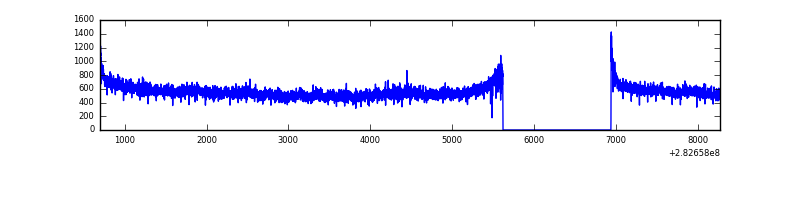 |
| D | 7571 | 6252 | 296 | 296 | 3.91% | 4.73% | 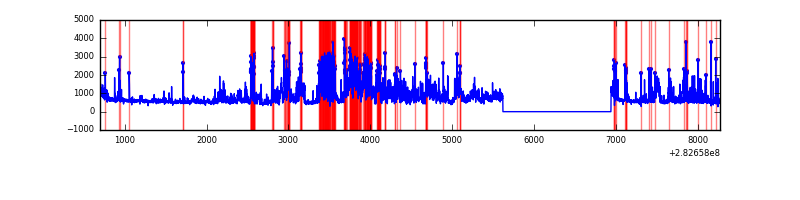 |
Top three noisy pixels from each quadrant. If the there are fewer than three noisy pixels in the level2.evt file, extra rows are filled as -1
| Pixel properties | Quadrant properties | ||||||
|---|---|---|---|---|---|---|---|
| Quadrant | DetID | PixID | Counts | Sigma | Mean | Median | Sigma |
| A | 0 | 226 | 7929 | 41.36 | 869 | 853 | 171.1 |
| A | 12 | 194 | 6467 | 32.82 | 869 | 853 | 171.1 |
| A | 3 | 137 | 5757 | 28.67 | 869 | 853 | 171.1 |
| B | 7 | 220 | 24141 | 145.28 | 855 | 834 | 160.4 |
| B | 0 | 230 | 18449 | 109.8 | 855 | 834 | 160.4 |
| B | 12 | 111 | 17691 | 105.07 | 855 | 834 | 160.4 |
| C | 3 | 233 | 151443 | 818.39 | 803 | 812 | 184.1 |
| C | 14 | 238 | 129463 | 698.97 | 803 | 812 | 184.1 |
| C | 5 | 218 | 54456 | 291.45 | 803 | 812 | 184.1 |
| D | 11 | 176 | 1031302 | 5179.32 | 823 | 802 | 199.0 |
| D | 1 | 52 | 684582 | 3436.7 | 823 | 802 | 199.0 |
| D | 13 | 232 | 434033 | 2177.43 | 823 | 802 | 199.0 |
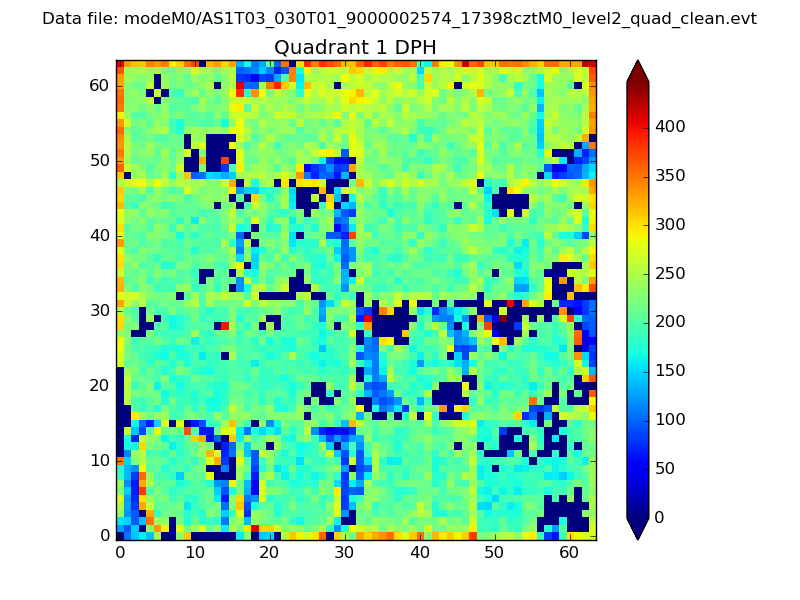
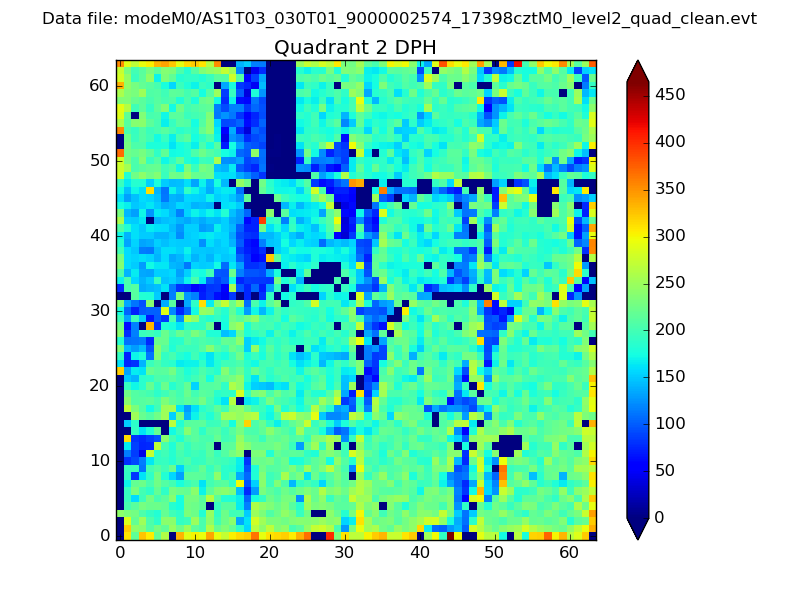
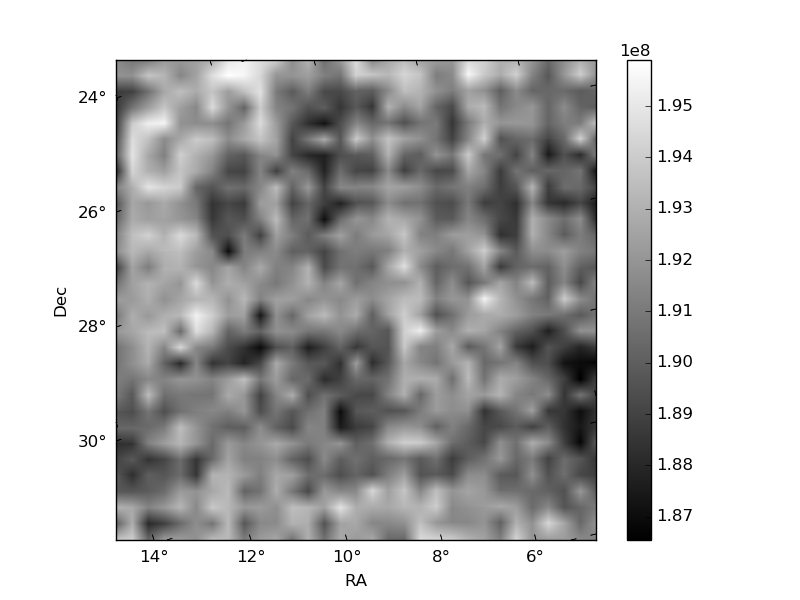
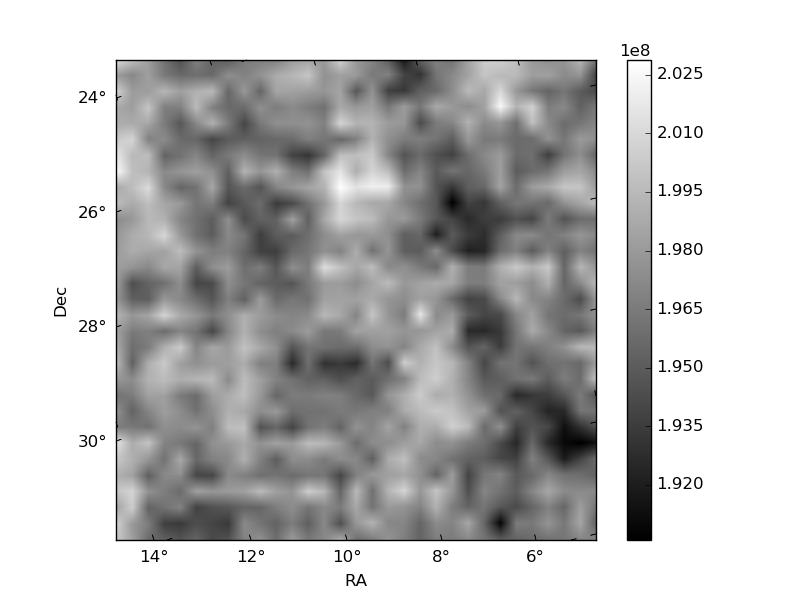
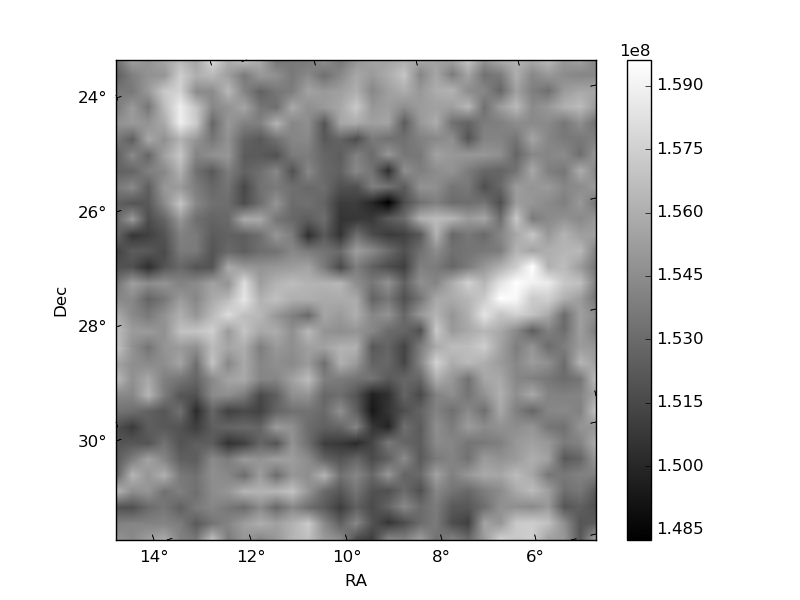
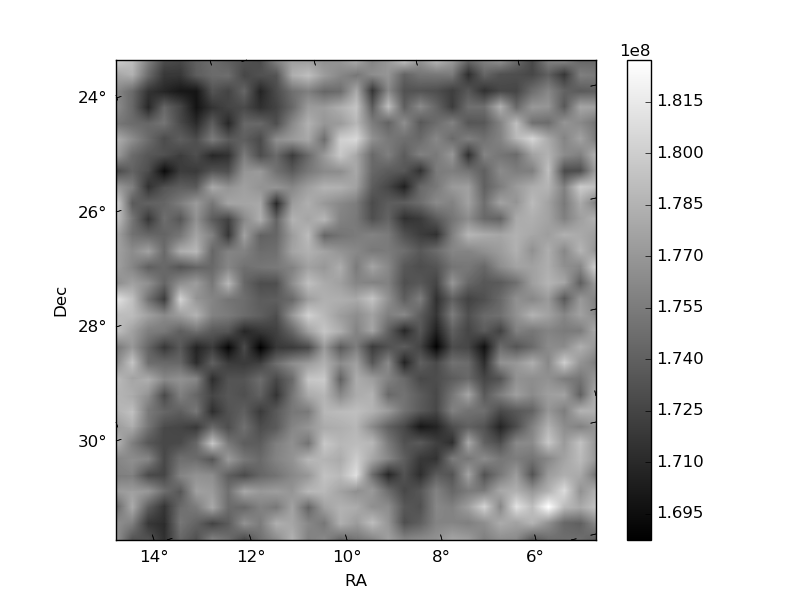
Histogram calculated using DETX and DETY for each event in the final _common_clean file
| Quadrant A |  |
 |
Quadrant B |
|---|---|---|---|
| Quadrant D |  |
 |
Quadrant C |
| Plot type | Count rate plots | Images |
|---|---|---|
| Comparison with Poisson distribution Blue bars denote a histogram of data divided into 1 sec bins. Red curve is a Poisson curve with rate = median count rate of data. |
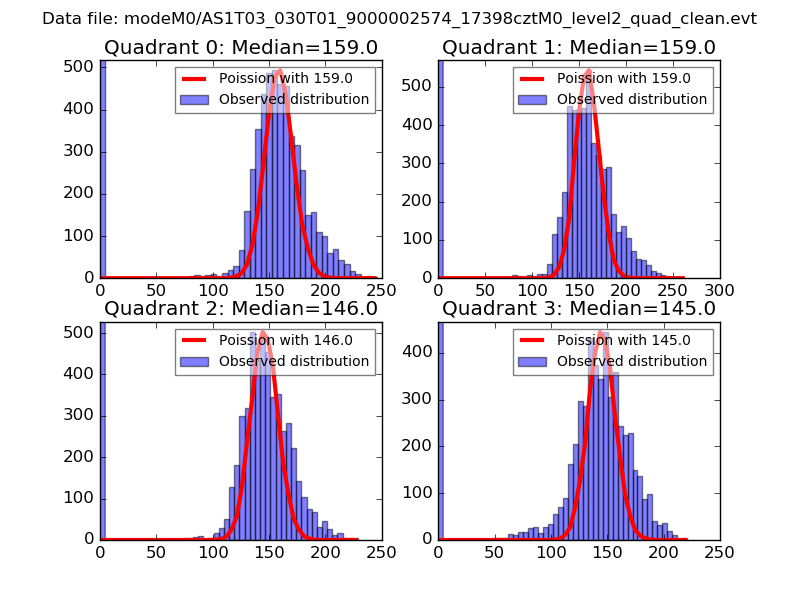 |
 |
| Quadrant-wise count rates Data is divided into 100 sec bins |
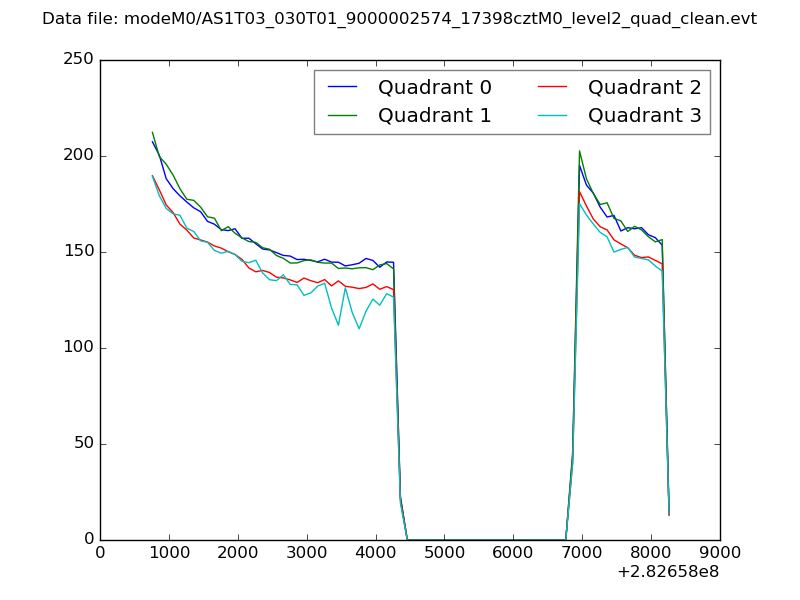 |
|
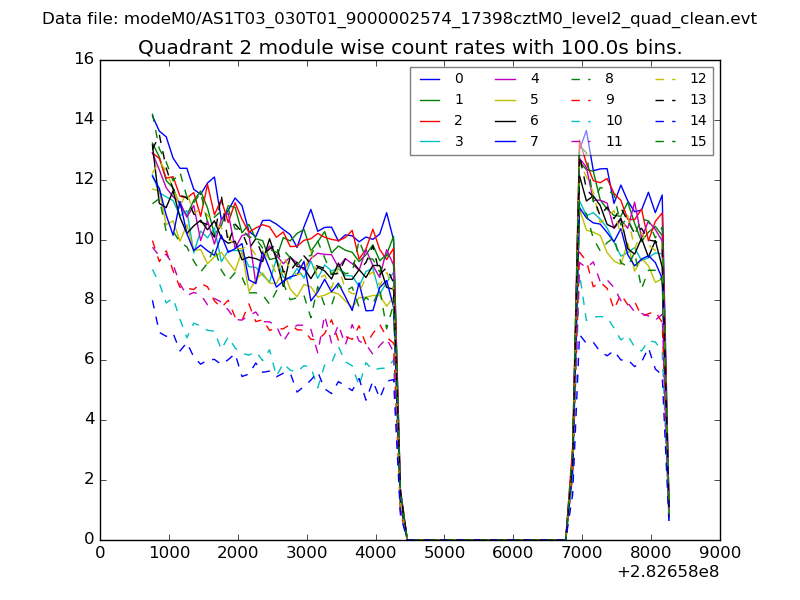
| Module-wise count rates for Quadrant A Data is divided into 100 sec bins |
 |
 |
| Module-wise count rates for Quadrant B Data is divided into 100 sec bins |
 |
 |
| Module-wise count rates for Quadrant C Data is divided into 100 sec bins |
 |
 |
| Module-wise count rates for Quadrant D Data is divided into 100 sec bins |
 |
 |
| Parameter | Plot |
|---|---|
| CZT HV Monitor | 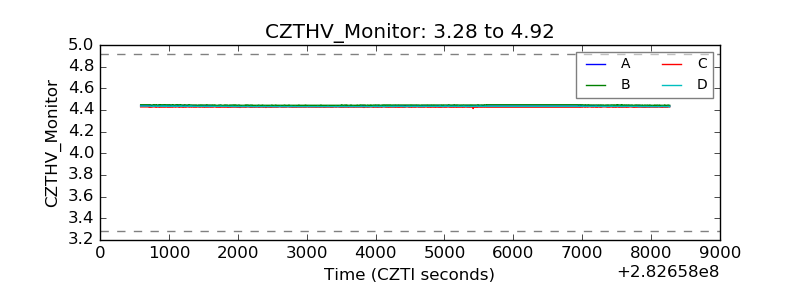 |
| D_VDD | 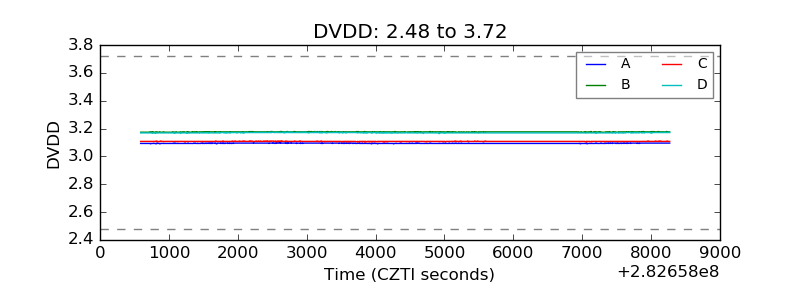 |
| Temperature 1 | 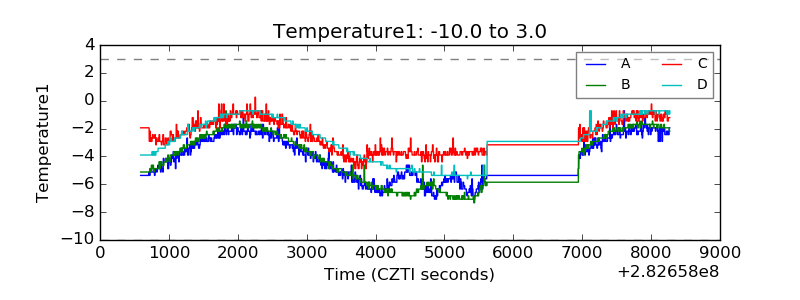 |
| Veto HV Monitor | 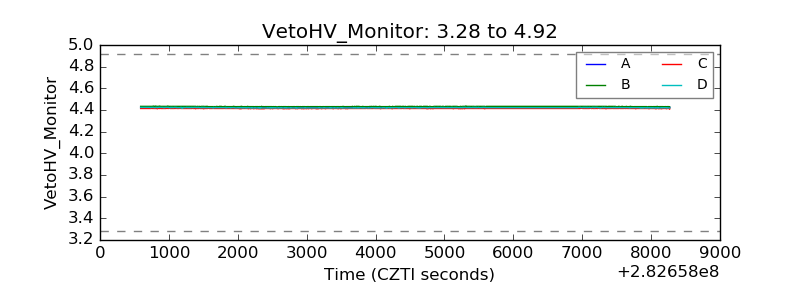 |
| Veto LLD | 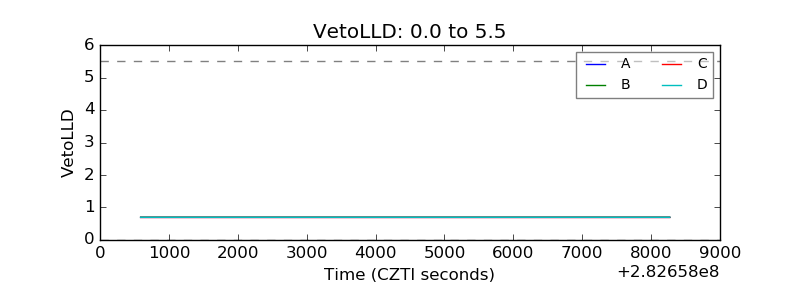 |
| Alpha Counter | 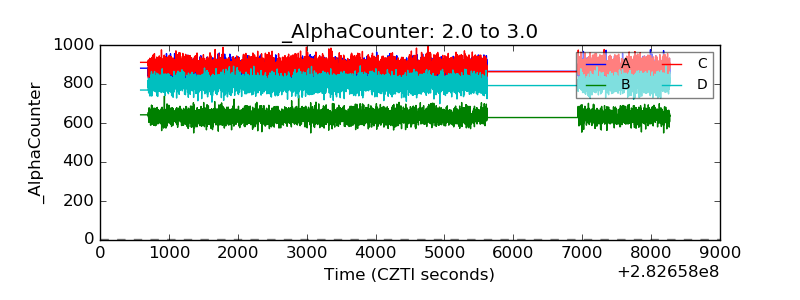 |
| _CPM_Rate | 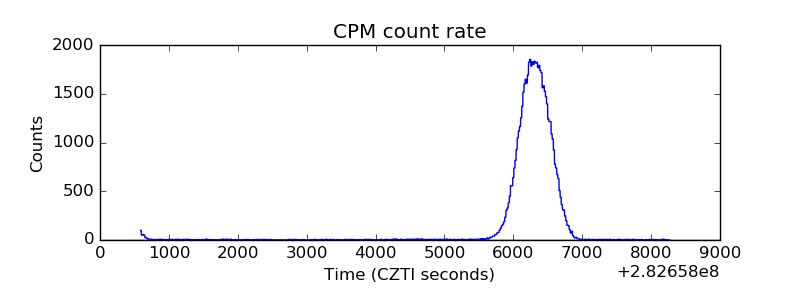 |
| CZT Counter | 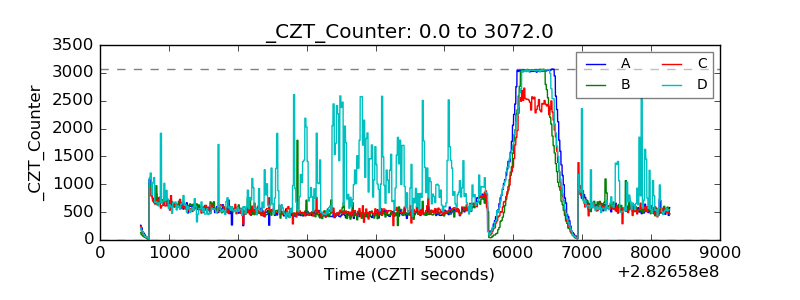 |
| +2.5 Volts monitor |  |
| +5 Volts monitor |  |
| _ROLL_ROT | 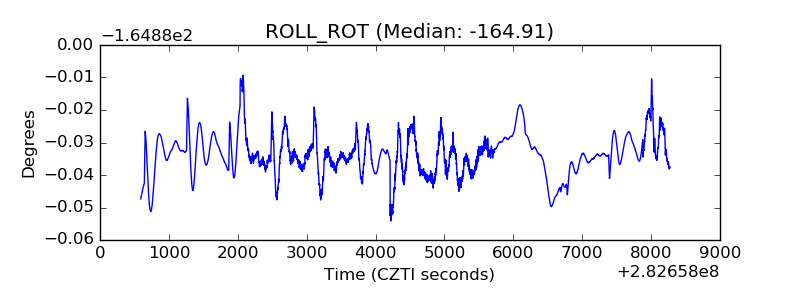 |
| _Roll_DEC | 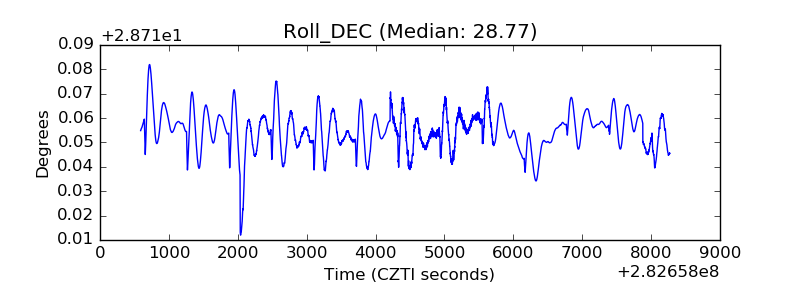 |
| _Roll_RA | 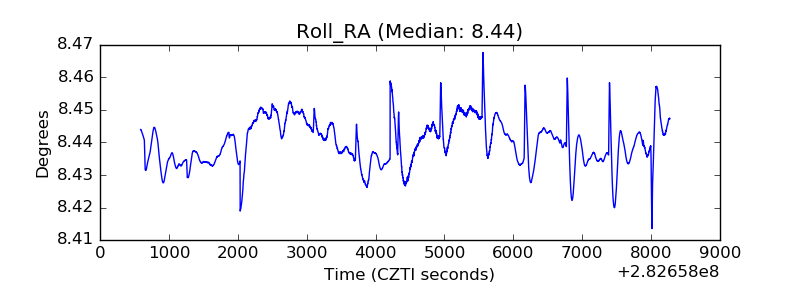 |
| Veto Counter | 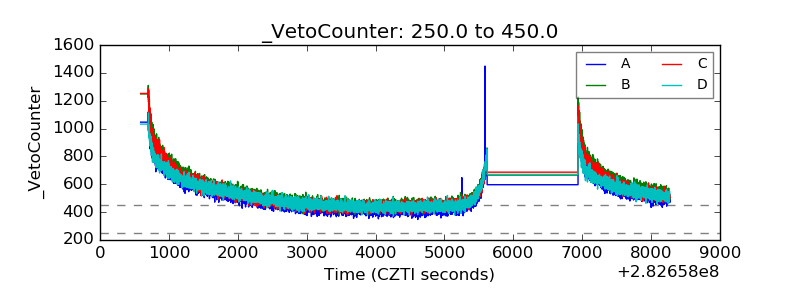 |