| Param | Original file | Final file |
|---|---|---|
| Filename | modeM0/AS1T03_030T01_9000002574cztM0_level2.evt | modeM0/AS1T03_030T01_9000002574cztM0_level2_quad_clean.evt |
| Size (bytes) | 521,887,680 | 103,590,720 |
| Size | 497.7 MB | 98.8 MB |
| Events in quadrant A | 3,299,375 | 695,022 |
| Events in quadrant B | 3,422,689 | 695,894 |
| Events in quadrant C | 3,990,082 | 652,549 |
| Events in quadrant D | 4,685,893 | 644,763 |
| Mode M0 | |||
|---|---|---|---|
| Quadrant | BADHDUFLAG | Total packets | Discarded packets |
| A | 0 | 13748 | 2 |
| B | 0 | 14085 | 2 |
| C | 0 | 15958 | 2 |
| D | 0 | 18085 | 2 |
| Mode SS | |||
|---|---|---|---|
| Quadrant | BADHDUFLAG | Total packets | Discarded packets |
| A | 0 | 132 | 0 |
| B | 0 | 131 | 0 |
| C | 0 | 130 | 0 |
| D | 0 | 130 | 0 |
| Mode M9 | |||
|---|---|---|---|
| Quadrant | BADHDUFLAG | Total packets | Discarded packets |
| A | 0 | 13 | 0 |
| B | 0 | 13 | 0 |
| C | 0 | 13 | 0 |
| D | 0 | 13 | 0 |
| Quadrant | Total seconds | Saturated seconds | Saturation percentage |
|---|---|---|---|
| A | 6441 | 105 | 1.630182% |
| B | 6442 | 121 | 1.878299% |
| C | 6441 | 144 | 2.235678% |
| D | 6441 | 299 | 4.642136% |
Noise dominated data is calculated using 1-second bins in cleaned event files. If a bin has >2000 counts, and if more than 50% of those come from <1% of pixels, then it is considered to be noise-dominated and hence unusable.
| Quadrant | # 1 sec bins | Bins with >0 counts | Bins with >2000 counts | High rate bins dominated by noise | Noise dominated (total time) | Noise dominated (detector-on time) | Marked lightcurve |
|---|---|---|---|---|---|---|---|
| A | 7721 | 6442 | 0 | 0 | 0.00% | 0.00% | 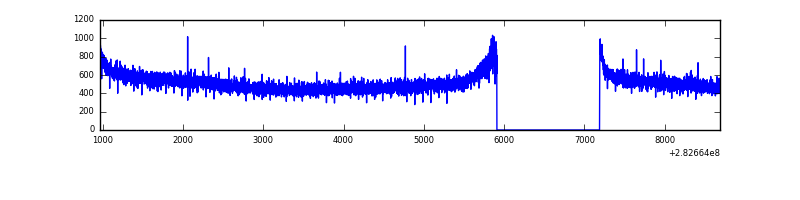 |
| B | 7722 | 6443 | 7 | 7 | 0.09% | 0.11% | 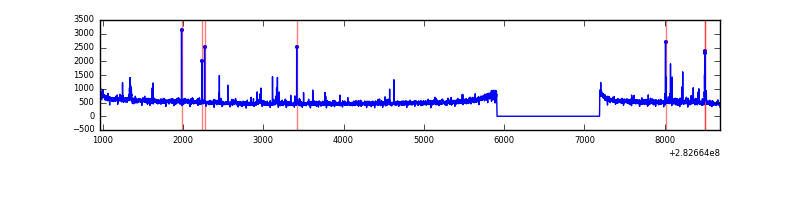 |
| C | 7721 | 6442 | 0 | 0 | 0.00% | 0.00% | 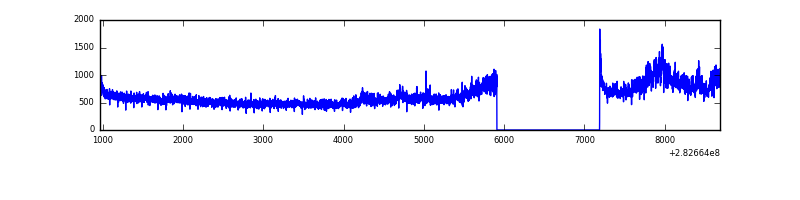 |
| D | 7721 | 6442 | 197 | 197 | 2.55% | 3.06% | 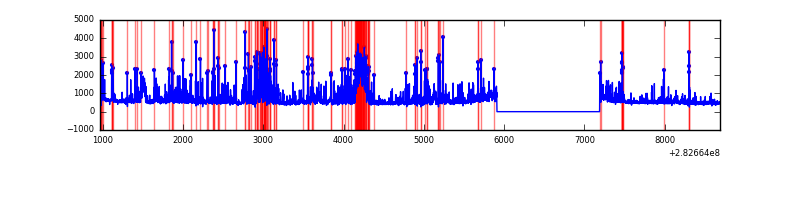 |
Top three noisy pixels from each quadrant. If the there are fewer than three noisy pixels in the level2.evt file, extra rows are filled as -1
| Pixel properties | Quadrant properties | ||||||
|---|---|---|---|---|---|---|---|
| Quadrant | DetID | PixID | Counts | Sigma | Mean | Median | Sigma |
| A | 0 | 226 | 7502 | 38.74 | 858 | 842 | 171.9 |
| A | 12 | 194 | 6509 | 32.96 | 858 | 842 | 171.9 |
| A | 3 | 137 | 5811 | 28.9 | 858 | 842 | 171.9 |
| B | 7 | 220 | 35048 | 212.61 | 847 | 826 | 161.0 |
| B | 0 | 197 | 25817 | 155.26 | 847 | 826 | 161.0 |
| B | 12 | 111 | 17478 | 103.46 | 847 | 826 | 161.0 |
| C | 3 | 233 | 682156 | 3705.79 | 802 | 809 | 183.9 |
| C | 14 | 238 | 126500 | 683.62 | 802 | 809 | 183.9 |
| C | 5 | 218 | 54071 | 289.69 | 802 | 809 | 183.9 |
| D | 13 | 232 | 516676 | 2623.14 | 817 | 795 | 196.7 |
| D | 1 | 52 | 512086 | 2599.81 | 817 | 795 | 196.7 |
| D | 11 | 176 | 252184 | 1278.26 | 817 | 795 | 196.7 |
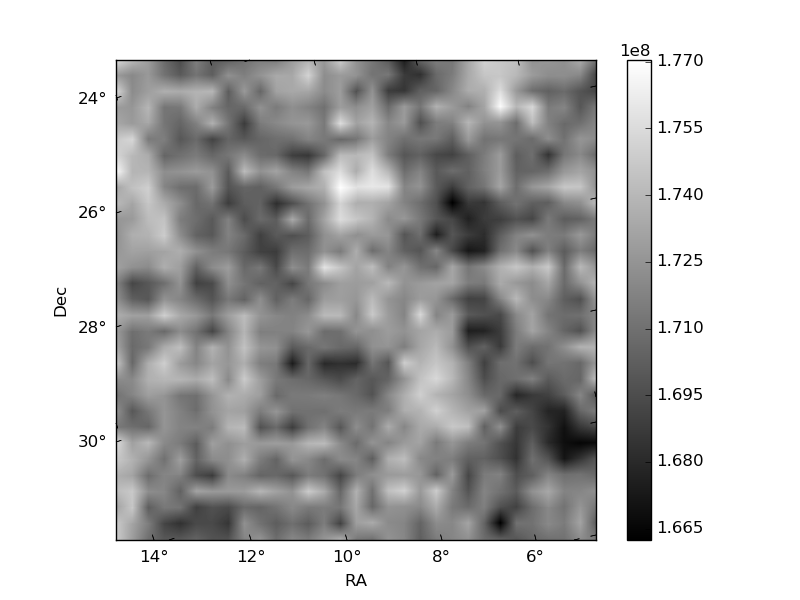
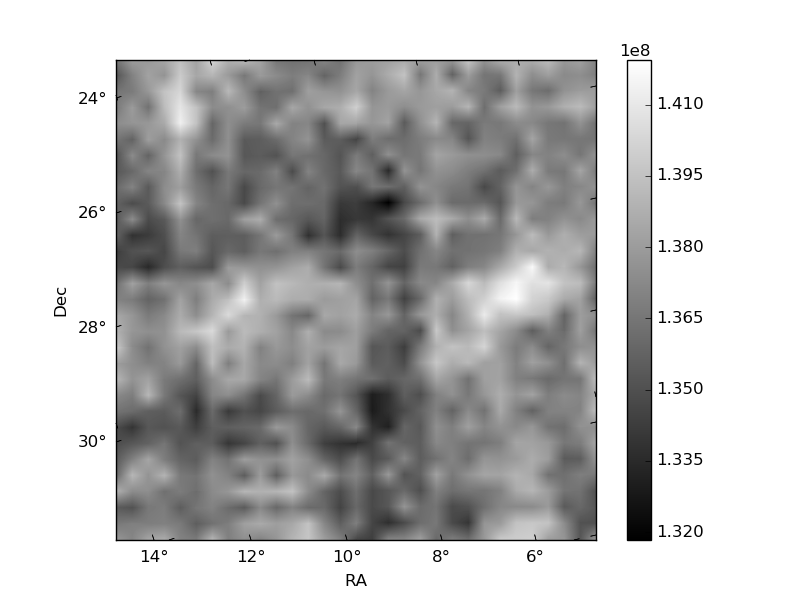
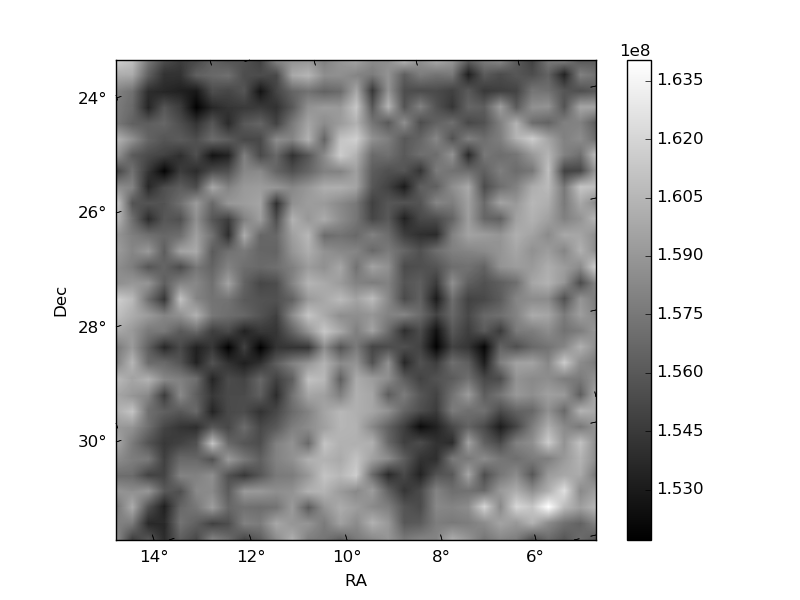
Histogram calculated using DETX and DETY for each event in the final _common_clean file
| Quadrant A | 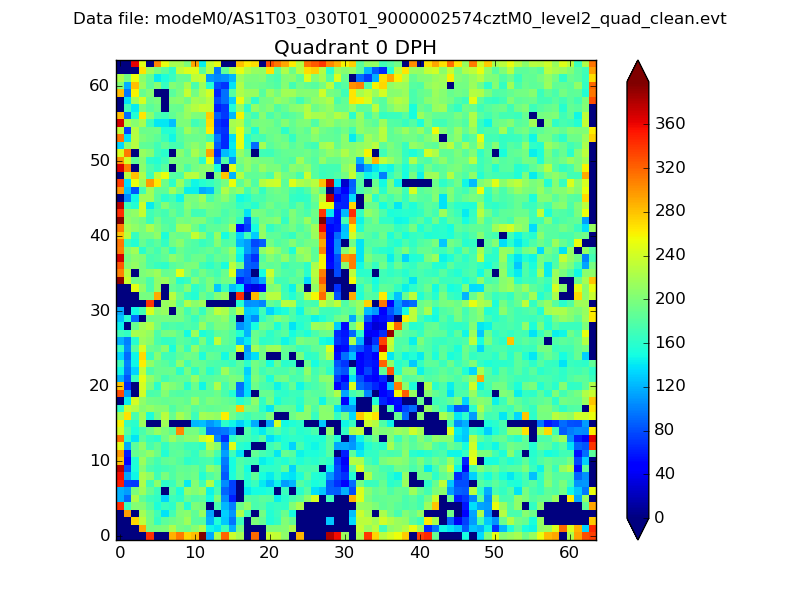 |
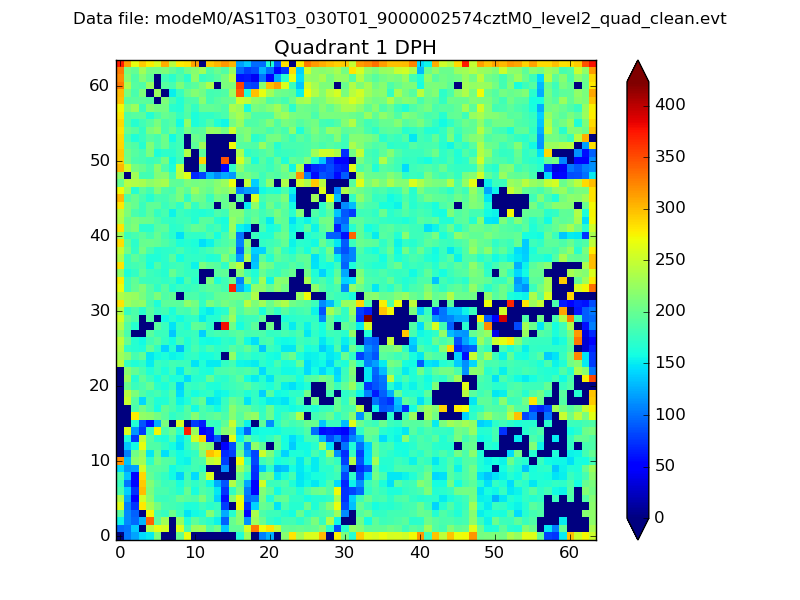 |
Quadrant B |
|---|---|---|---|
| Quadrant D | 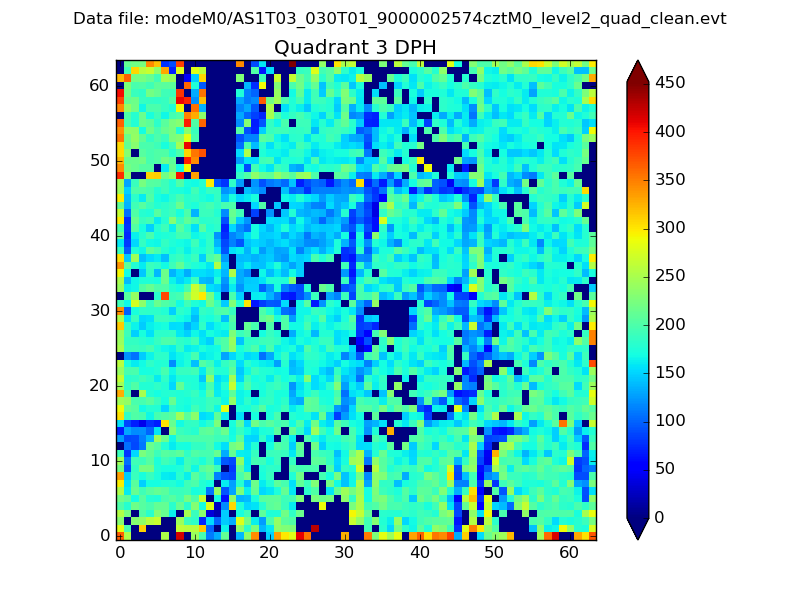 |
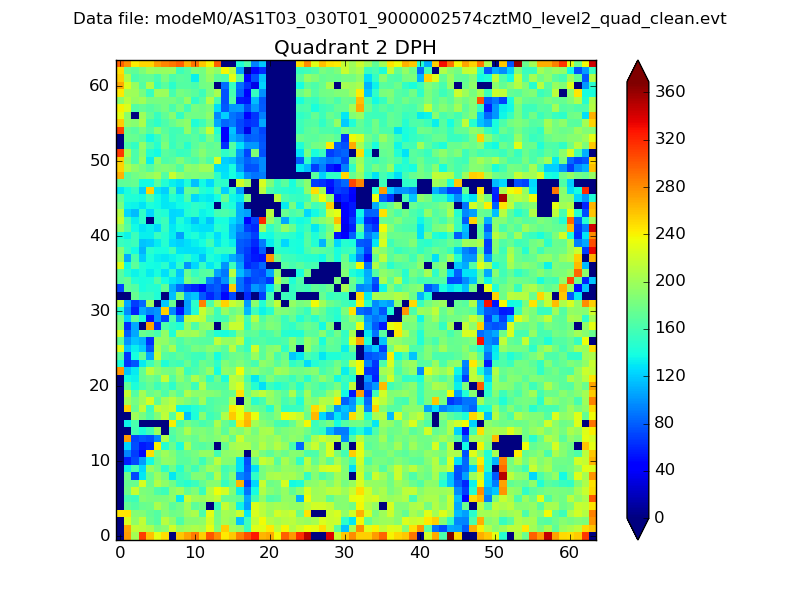 |
Quadrant C |
| Plot type | Count rate plots | Images |
|---|---|---|
| Comparison with Poisson distribution Blue bars denote a histogram of data divided into 1 sec bins. Red curve is a Poisson curve with rate = median count rate of data. |
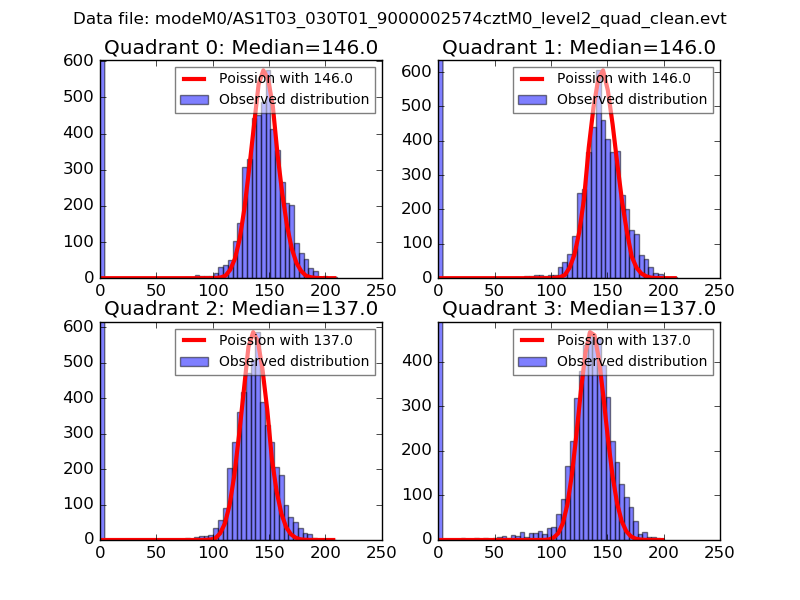 |
 |
| Quadrant-wise count rates Data is divided into 100 sec bins |
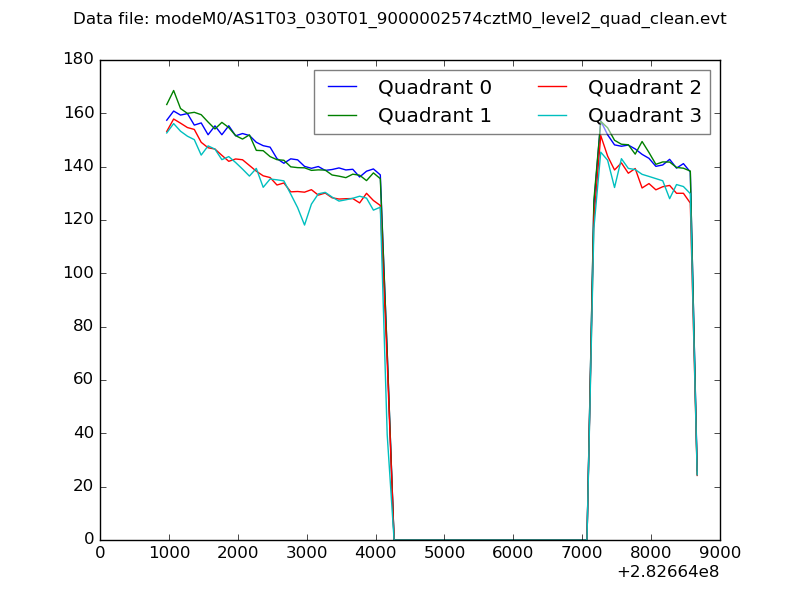 |
|
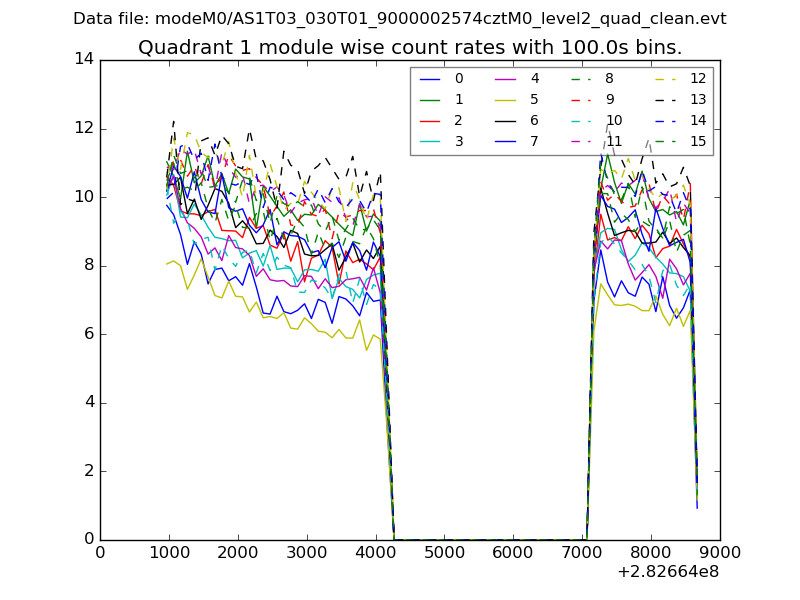
| Module-wise count rates for Quadrant A Data is divided into 100 sec bins |
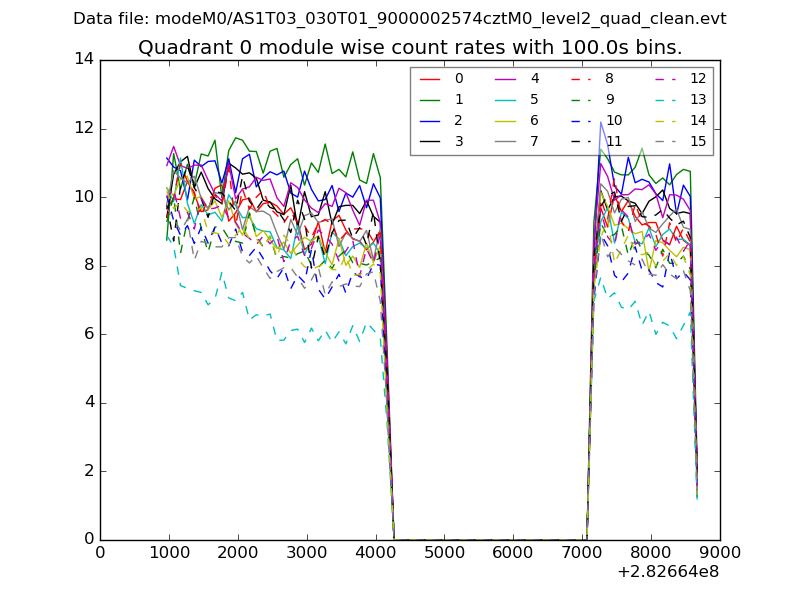 |
 |
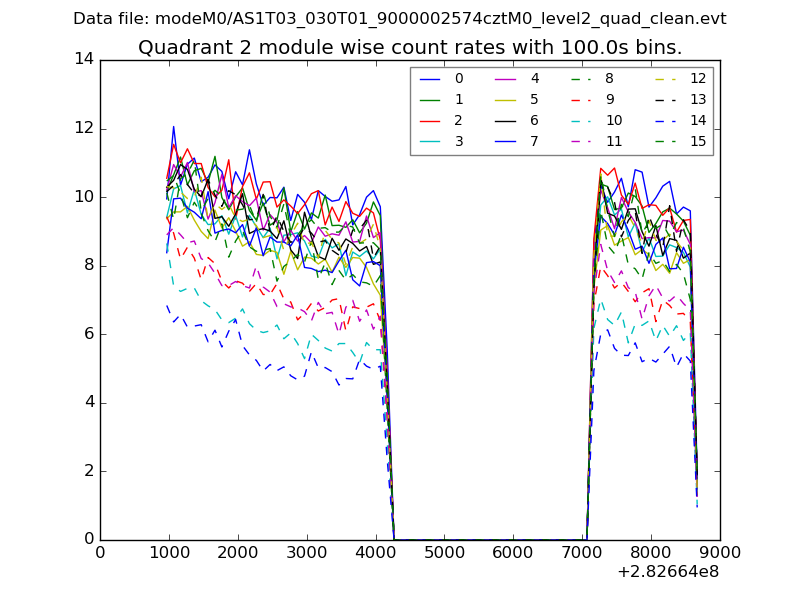
| Module-wise count rates for Quadrant B Data is divided into 100 sec bins |
 |
 |
| Module-wise count rates for Quadrant C Data is divided into 100 sec bins |
 |
 |
| Module-wise count rates for Quadrant D Data is divided into 100 sec bins |
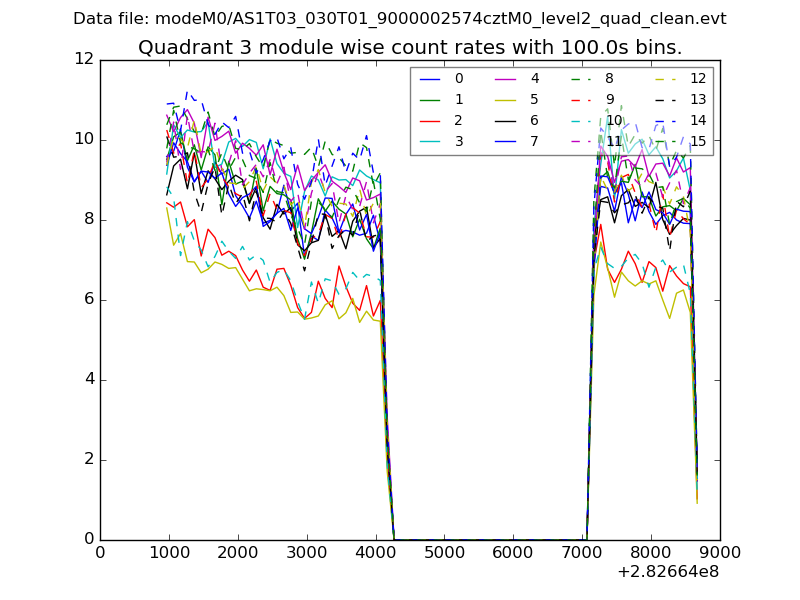 |
 |
| Parameter | Plot |
|---|---|
| CZT HV Monitor | 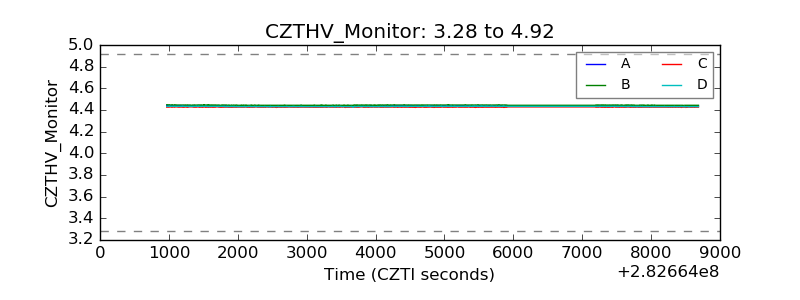 |
| D_VDD | 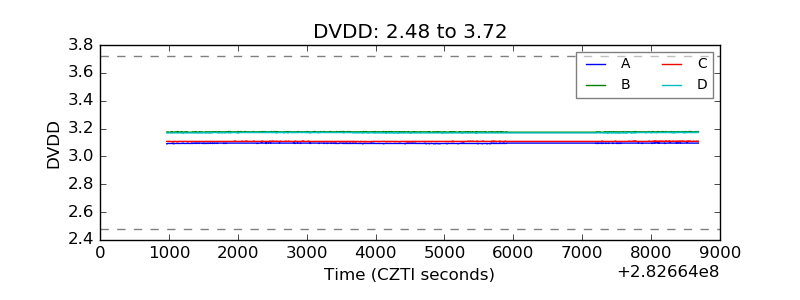 |
| Temperature 1 | 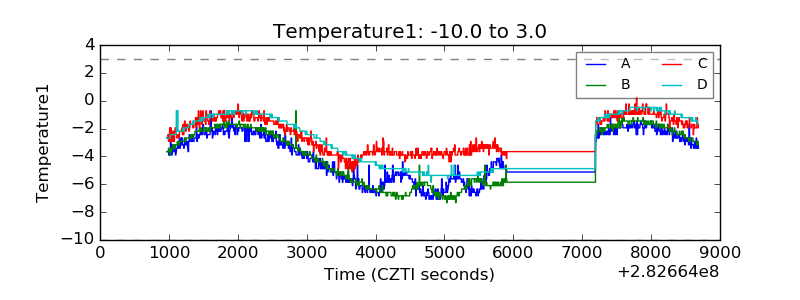 |
| Veto HV Monitor | 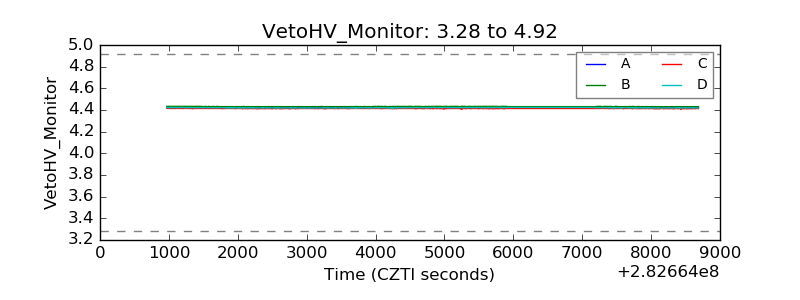 |
| Veto LLD | 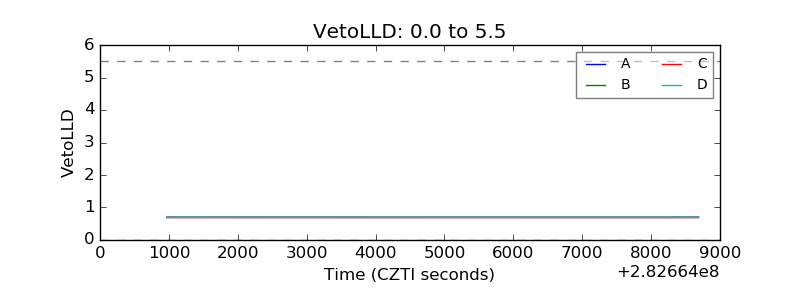 |
| Alpha Counter | 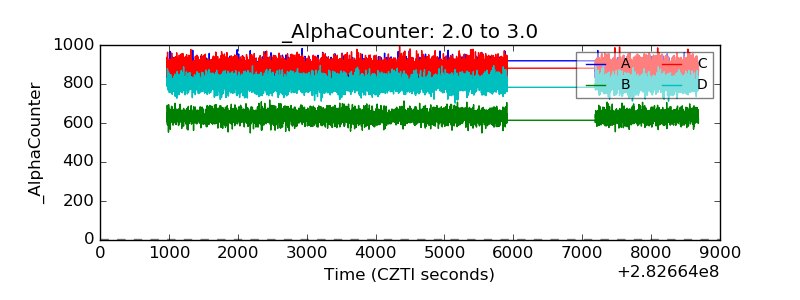 |
| _CPM_Rate | 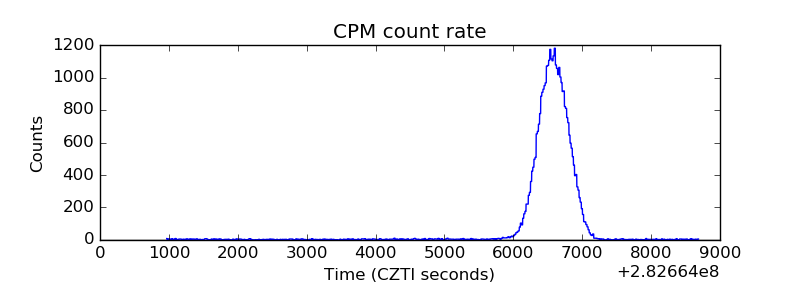 |
| CZT Counter |  |
| +2.5 Volts monitor |  |
| +5 Volts monitor |  |
| _ROLL_ROT | 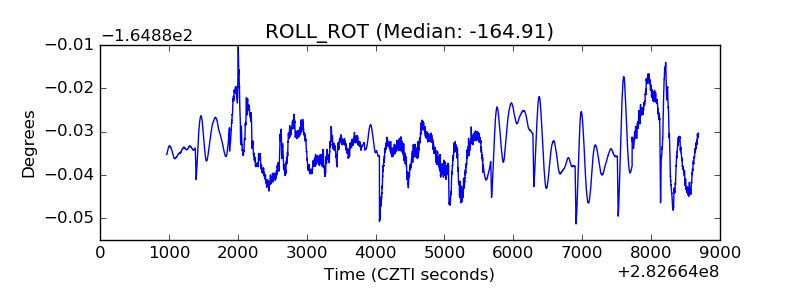 |
| _Roll_DEC | 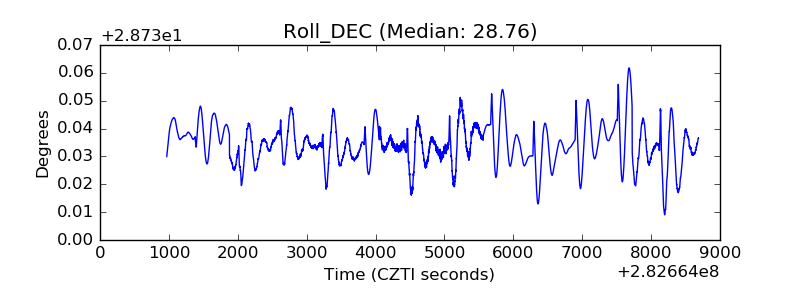 |
| _Roll_RA | 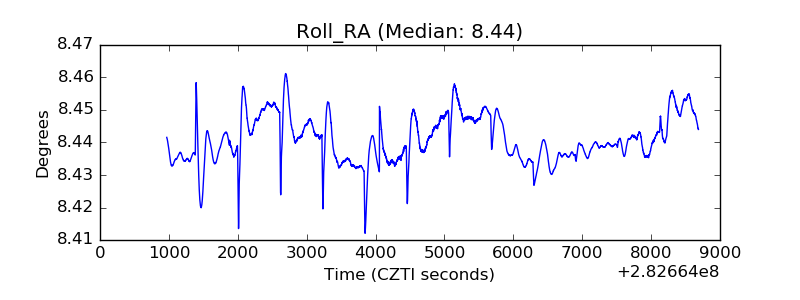 |
| Veto Counter | 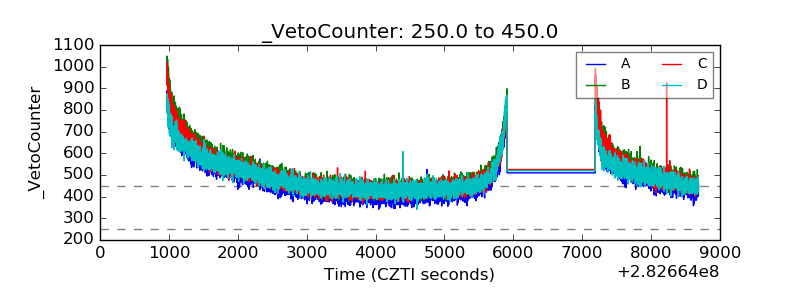 |