| Param | Original file | Final file |
|---|---|---|
| Filename | modeM0/AS1T03_030T01_9000002574_17400cztM0_level2.evt | modeM0/AS1T03_030T01_9000002574_17400cztM0_level2_quad_clean.evt |
| Size (bytes) | 559,572,480 | 90,973,440 |
| Size | 533.6 MB | 86.8 MB |
| Events in quadrant A | 3,185,797 | 605,477 |
| Events in quadrant B | 3,427,336 | 602,590 |
| Events in quadrant C | 4,274,646 | 566,167 |
| Events in quadrant D | 5,615,111 | 523,917 |
| Mode M0 | |||
|---|---|---|---|
| Quadrant | BADHDUFLAG | Total packets | Discarded packets |
| A | 0 | 13619 | 2 |
| B | 0 | 14227 | 2 |
| C | 0 | 17053 | 2 |
| D | 0 | 21002 | 2 |
| Mode SS | |||
|---|---|---|---|
| Quadrant | BADHDUFLAG | Total packets | Discarded packets |
| A | 0 | 134 | 0 |
| B | 0 | 134 | 0 |
| C | 0 | 134 | 0 |
| D | 0 | 134 | 0 |
| Mode M9 | |||
|---|---|---|---|
| Quadrant | BADHDUFLAG | Total packets | Discarded packets |
| A | 0 | 11 | 0 |
| B | 0 | 11 | 0 |
| C | 0 | 11 | 0 |
| D | 0 | 11 | 0 |
| Quadrant | Total seconds | Saturated seconds | Saturation percentage |
|---|---|---|---|
| A | 6542 | 66 | 1.008866% |
| B | 6543 | 114 | 1.742320% |
| C | 6542 | 136 | 2.078875% |
| D | 6542 | 850 | 12.992969% |
Noise dominated data is calculated using 1-second bins in cleaned event files. If a bin has >2000 counts, and if more than 50% of those come from <1% of pixels, then it is considered to be noise-dominated and hence unusable.
| Quadrant | # 1 sec bins | Bins with >0 counts | Bins with >2000 counts | High rate bins dominated by noise | Noise dominated (total time) | Noise dominated (detector-on time) | Marked lightcurve |
|---|---|---|---|---|---|---|---|
| A | 7627 | 6543 | 0 | 0 | 0.00% | 0.00% | 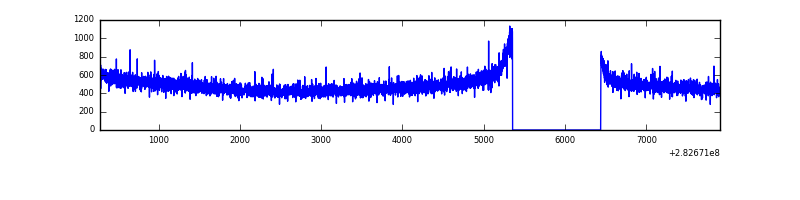 |
| B | 7628 | 6544 | 27 | 27 | 0.35% | 0.41% | 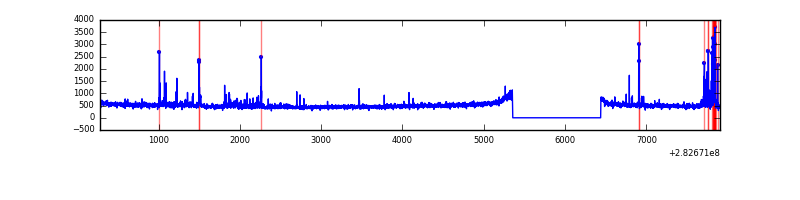 |
| C | 7627 | 6543 | 0 | 0 | 0.00% | 0.00% | 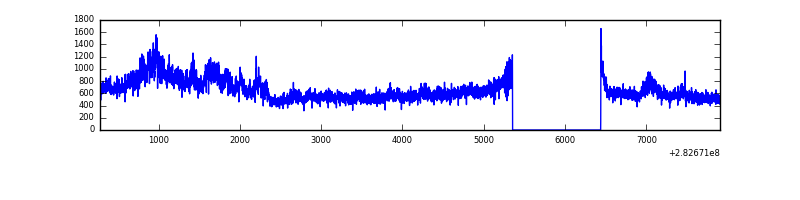 |
| D | 7626 | 6542 | 728 | 728 | 9.55% | 11.13% | 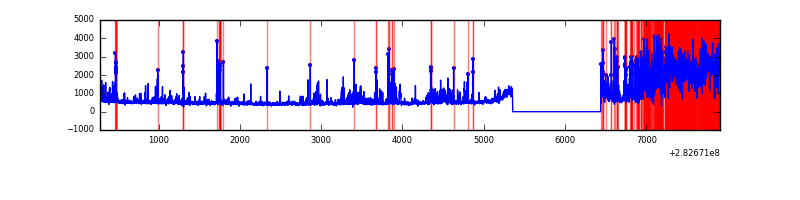 |
Top three noisy pixels from each quadrant. If the there are fewer than three noisy pixels in the level2.evt file, extra rows are filled as -1
| Pixel properties | Quadrant properties | ||||||
|---|---|---|---|---|---|---|---|
| Quadrant | DetID | PixID | Counts | Sigma | Mean | Median | Sigma |
| A | 0 | 226 | 7056 | 37.33 | 829 | 812 | 167.3 |
| A | 12 | 194 | 6168 | 32.02 | 829 | 812 | 167.3 |
| A | 3 | 137 | 5911 | 30.49 | 829 | 812 | 167.3 |
| B | 0 | 197 | 98210 | 619.64 | 822 | 801 | 157.2 |
| B | 7 | 220 | 66261 | 416.4 | 822 | 801 | 157.2 |
| B | 0 | 189 | 28597 | 176.82 | 822 | 801 | 157.2 |
| C | 3 | 233 | 1027731 | 5618.63 | 785 | 793 | 182.8 |
| C | 14 | 238 | 120969 | 657.51 | 785 | 793 | 182.8 |
| C | 5 | 218 | 64717 | 349.74 | 785 | 793 | 182.8 |
| D | 11 | 176 | 2004596 | 10696.37 | 771 | 751 | 187.3 |
| D | 13 | 232 | 458504 | 2443.45 | 771 | 751 | 187.3 |
| D | 13 | 189 | 113976 | 604.39 | 771 | 751 | 187.3 |
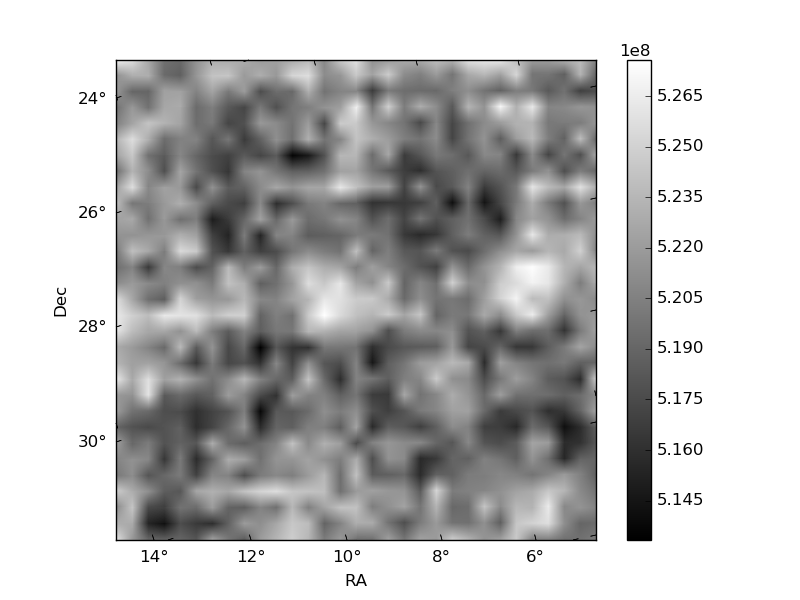
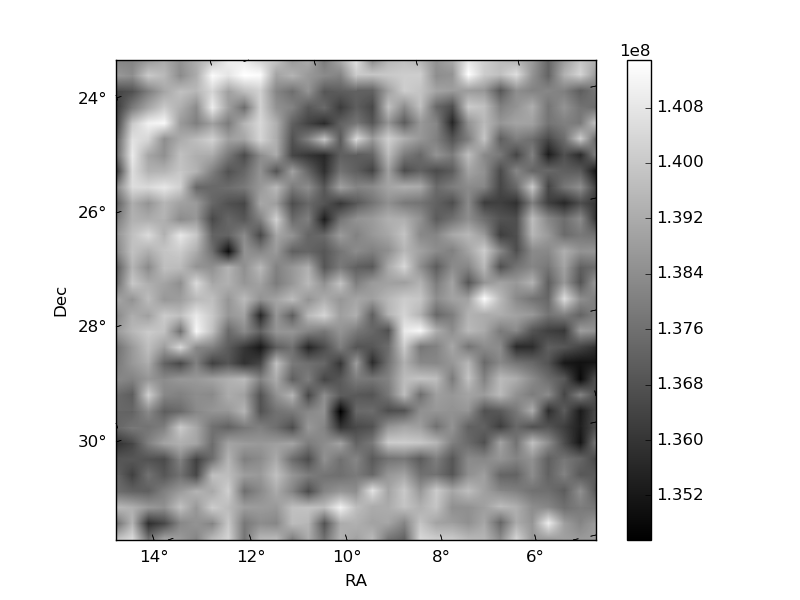
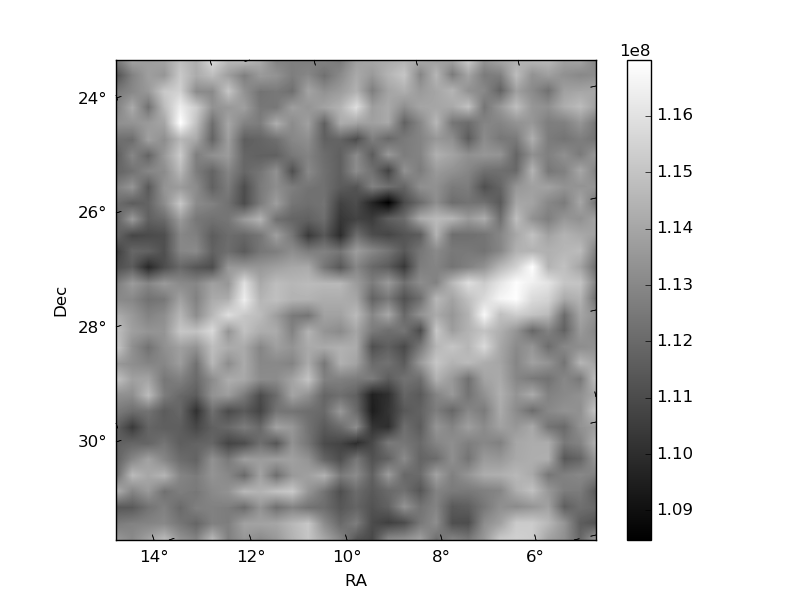
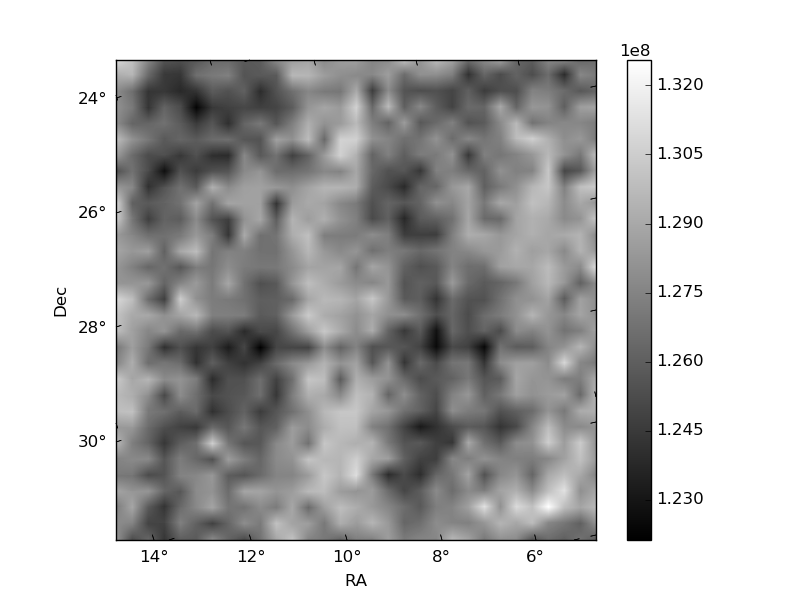
Histogram calculated using DETX and DETY for each event in the final _common_clean file
| Quadrant A | 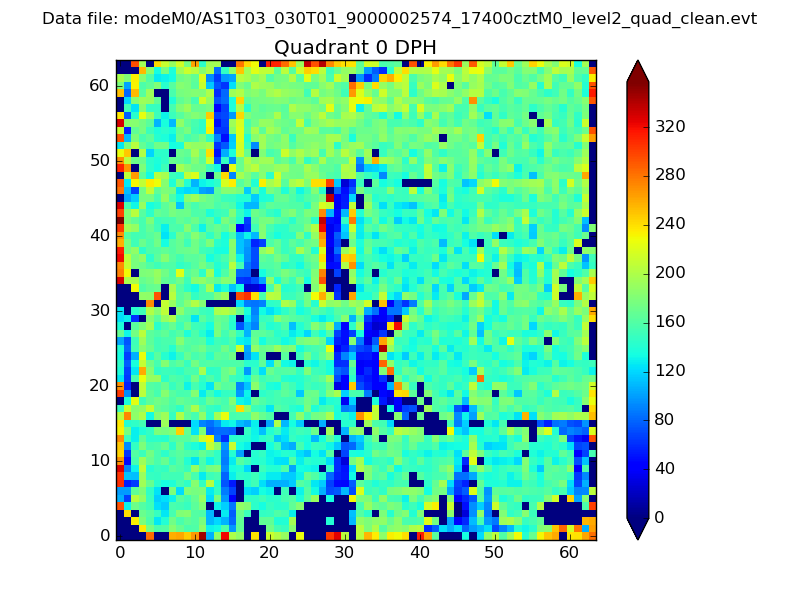 |
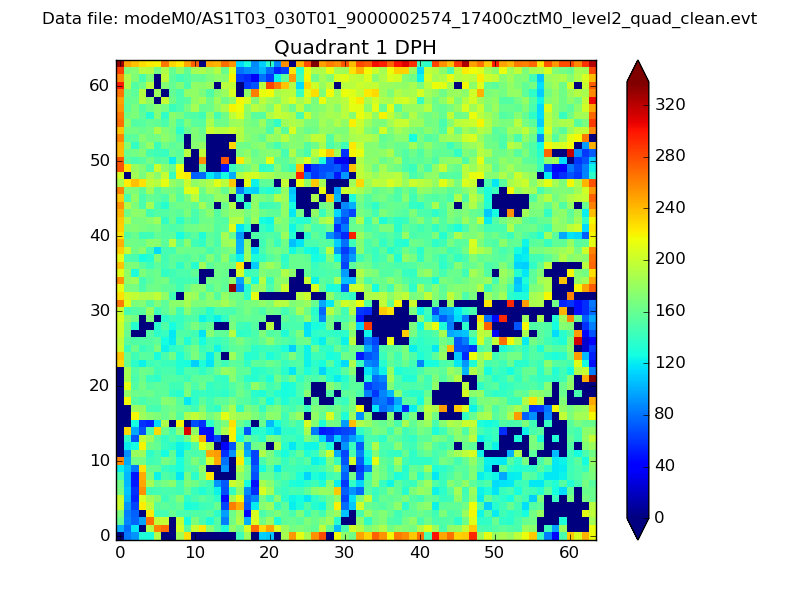 |
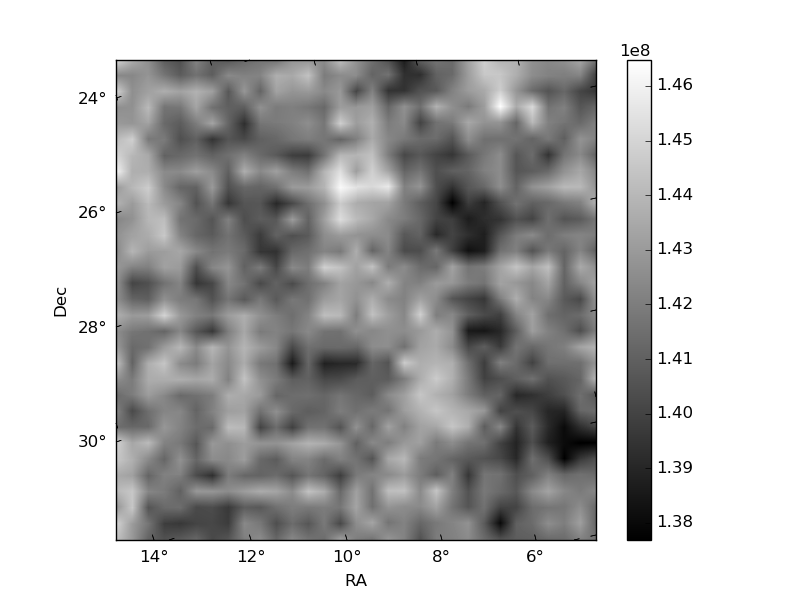
Quadrant B |
|---|---|---|---|
| Quadrant D | 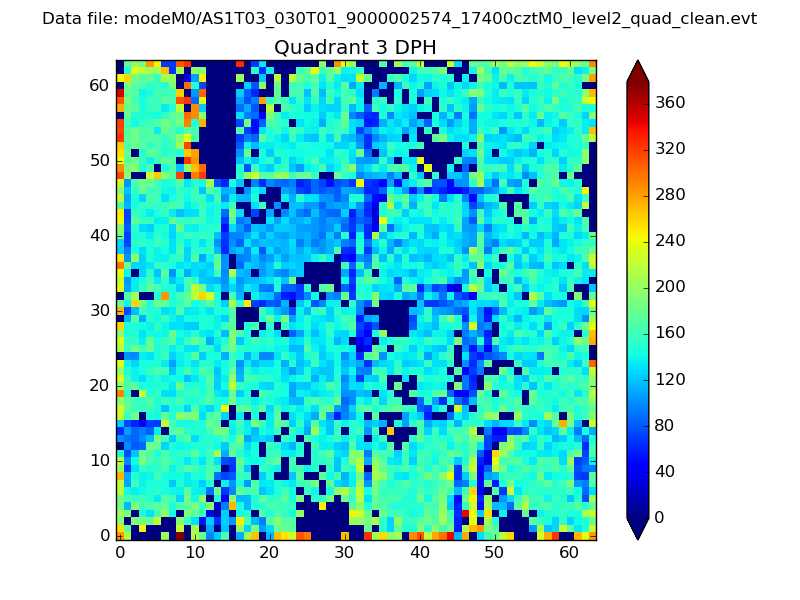 |
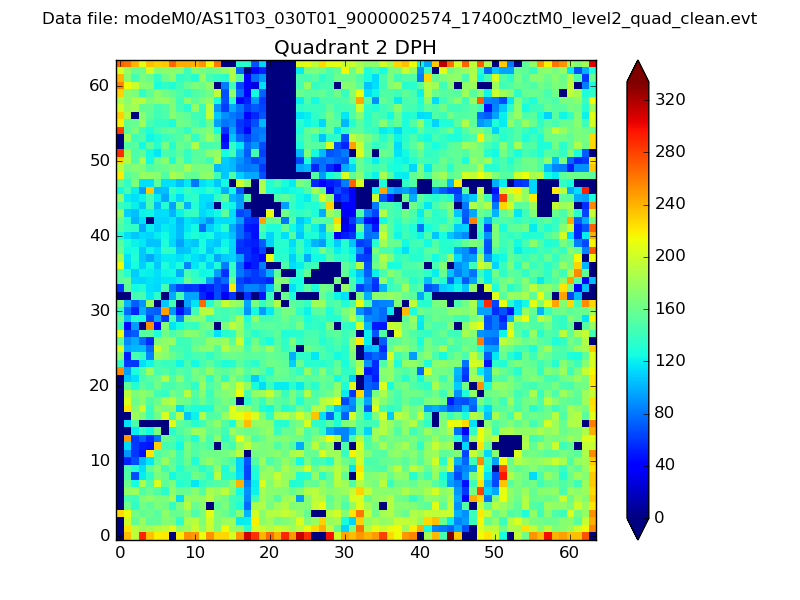 |
Quadrant C |
| Plot type | Count rate plots | Images |
|---|---|---|
| Comparison with Poisson distribution Blue bars denote a histogram of data divided into 1 sec bins. Red curve is a Poisson curve with rate = median count rate of data. |
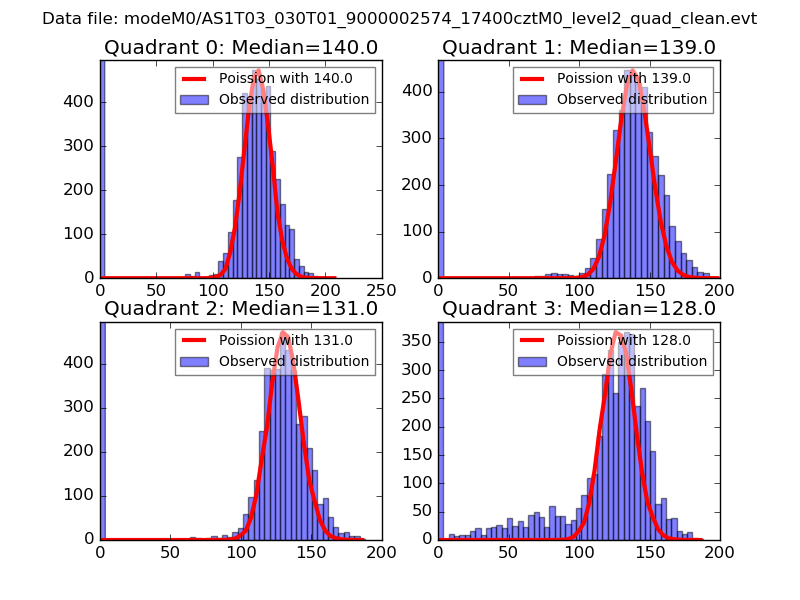 |
 |
| Quadrant-wise count rates Data is divided into 100 sec bins |
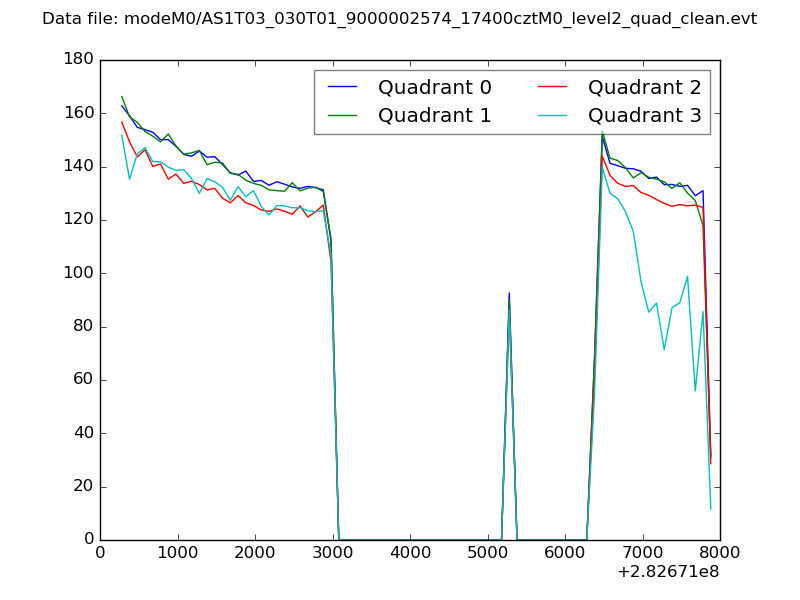 |
|
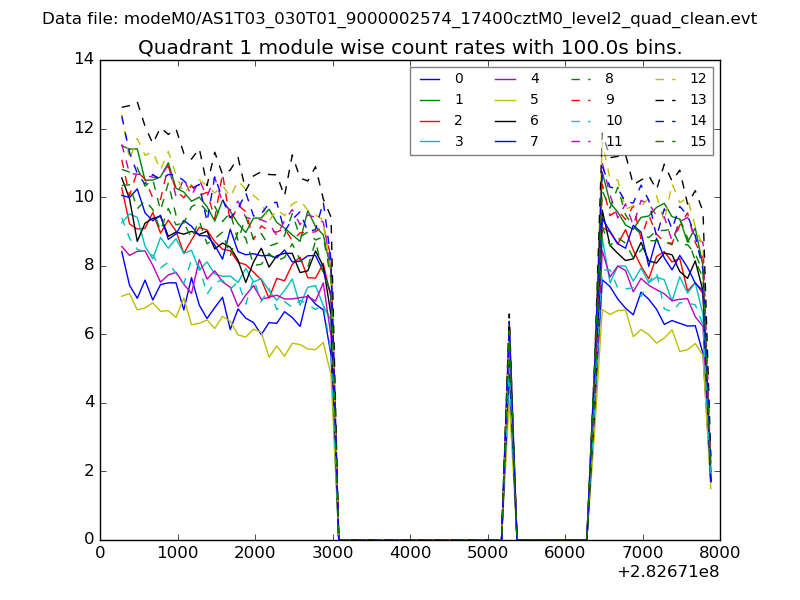
| Module-wise count rates for Quadrant A Data is divided into 100 sec bins |
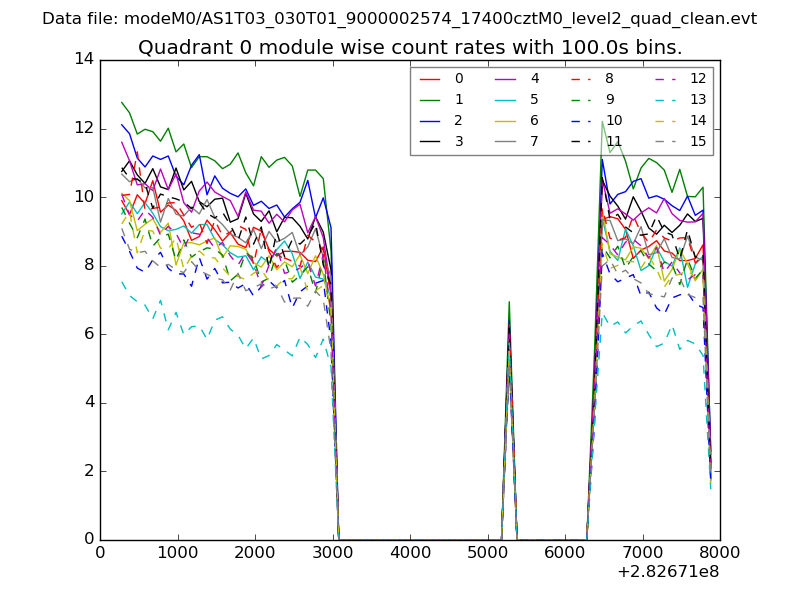 |
 |
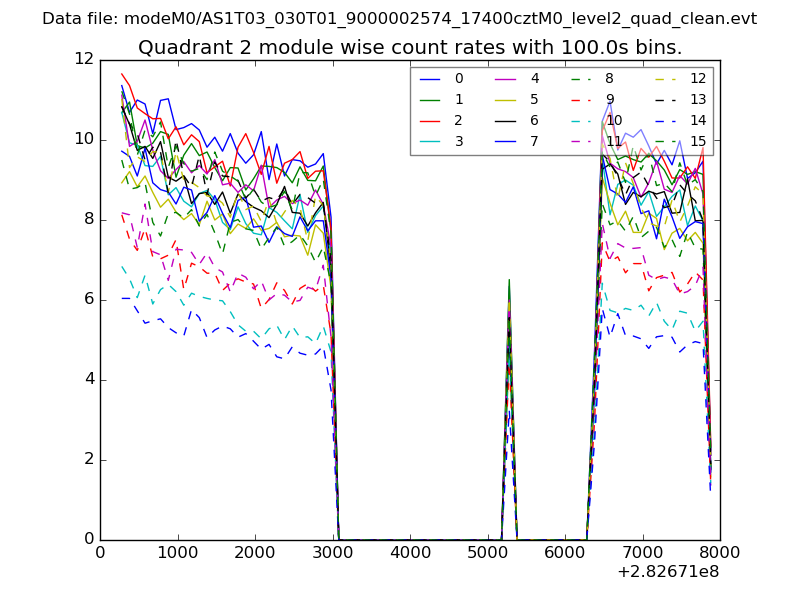
| Module-wise count rates for Quadrant B Data is divided into 100 sec bins |
 |
 |
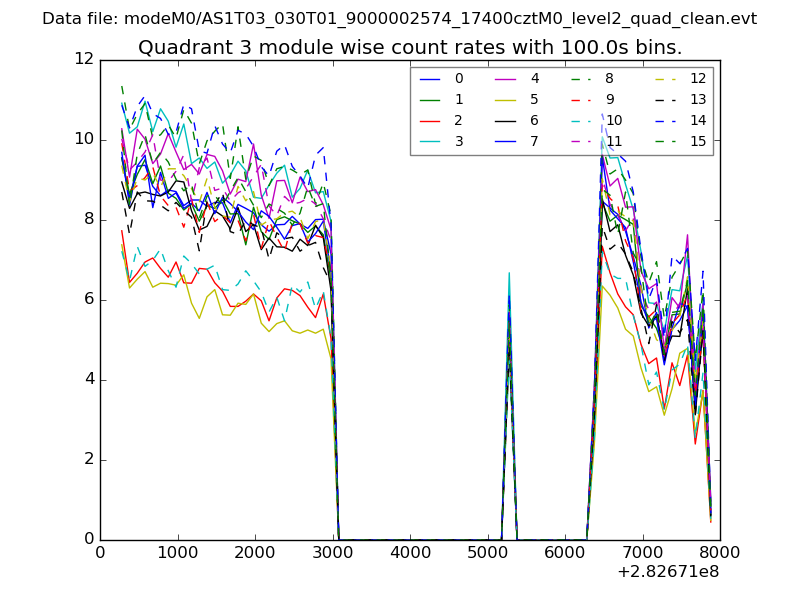
| Module-wise count rates for Quadrant C Data is divided into 100 sec bins |
 |
 |
| Module-wise count rates for Quadrant D Data is divided into 100 sec bins |
 |
 |
| Parameter | Plot |
|---|---|
| CZT HV Monitor | 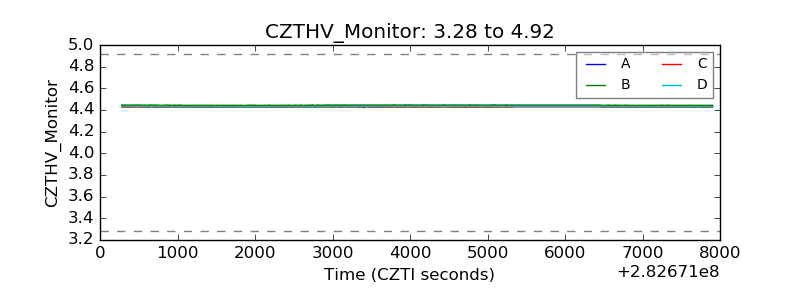 |
| D_VDD | 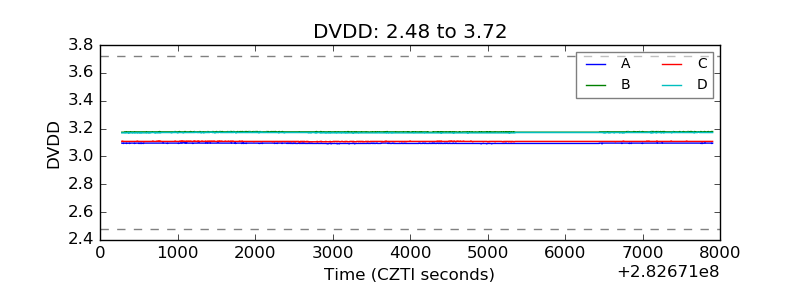 |
| Temperature 1 | 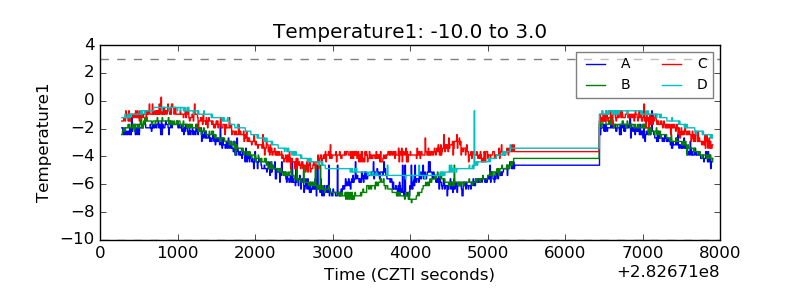 |
| Veto HV Monitor | 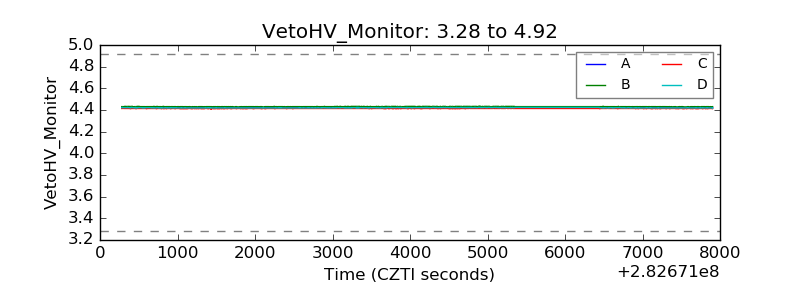 |
| Veto LLD | 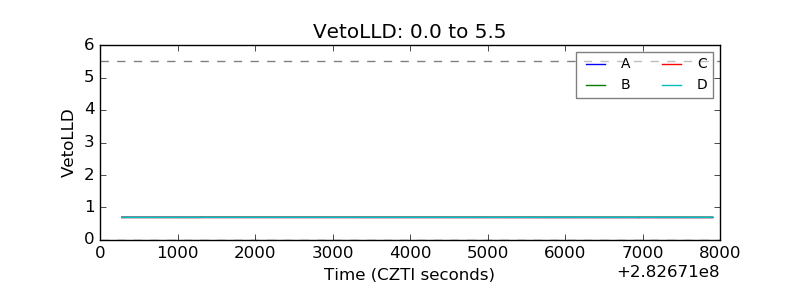 |
| Alpha Counter | 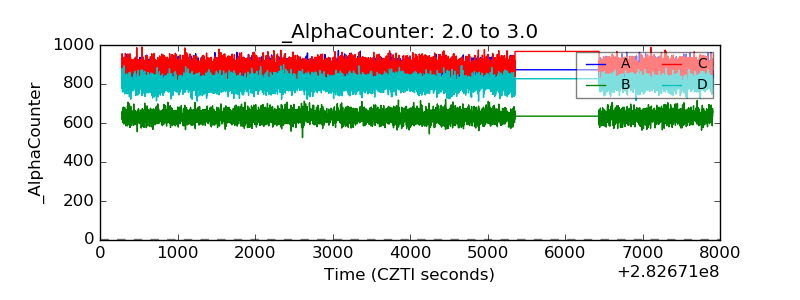 |
| _CPM_Rate | 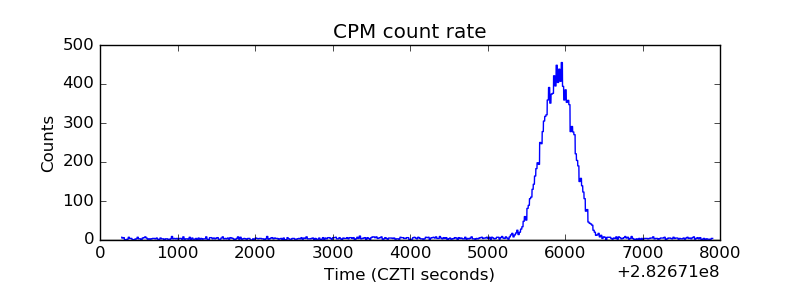 |
| CZT Counter | 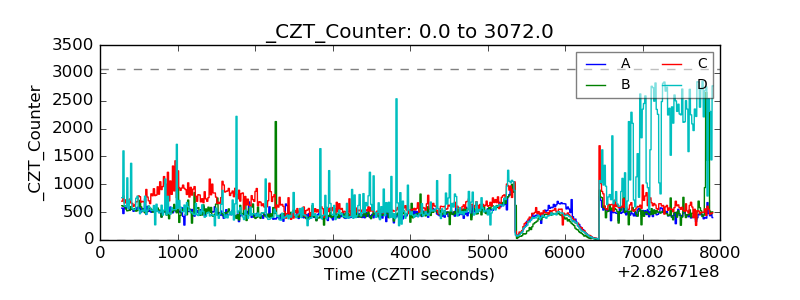 |
| +2.5 Volts monitor |  |
| +5 Volts monitor |  |
| _ROLL_ROT | 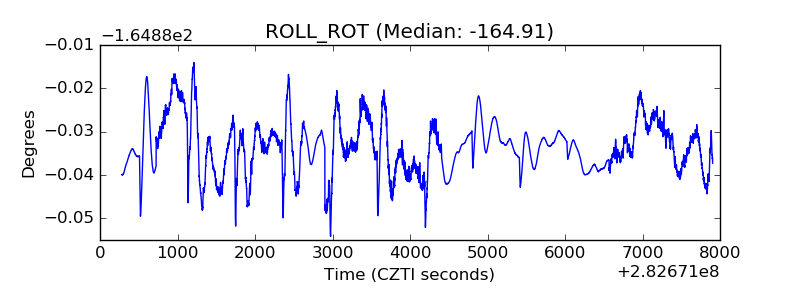 |
| _Roll_DEC | 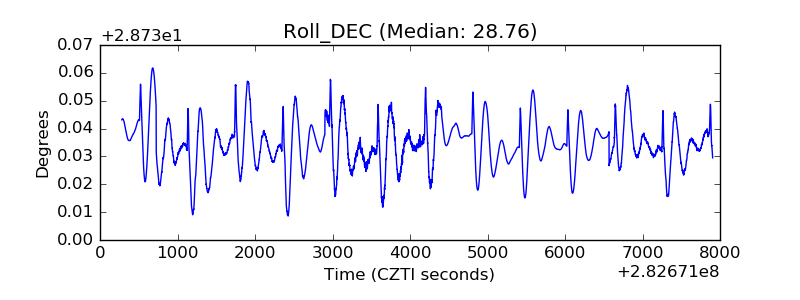 |
| _Roll_RA | 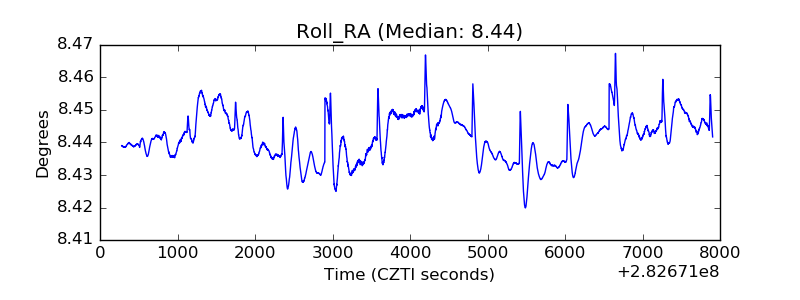 |
| Veto Counter | 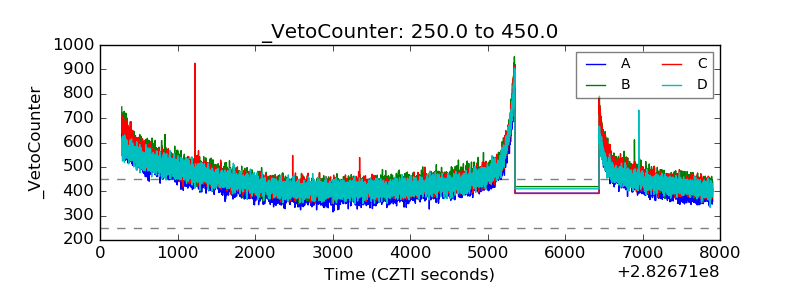 |