| Param | Original file | Final file |
|---|---|---|
| Filename | modeM0/AS1T03_030T01_9000002574_17401cztM0_level2.evt | modeM0/AS1T03_030T01_9000002574_17401cztM0_level2_quad_clean.evt |
| Size (bytes) | 606,994,560 | 90,288,000 |
| Size | 578.9 MB | 86.1 MB |
| Events in quadrant A | 3,212,893 | 608,110 |
| Events in quadrant B | 3,504,122 | 605,882 |
| Events in quadrant C | 3,675,198 | 577,887 |
| Events in quadrant D | 7,529,327 | 467,321 |
| Mode M0 | |||
|---|---|---|---|
| Quadrant | BADHDUFLAG | Total packets | Discarded packets |
| A | 0 | 14004 | 1 |
| B | 0 | 14720 | 1 |
| C | 0 | 14894 | 1 |
| D | 0 | 27097 | 1 |
| Mode SS | |||
|---|---|---|---|
| Quadrant | BADHDUFLAG | Total packets | Discarded packets |
| A | 0 | 138 | 0 |
| B | 0 | 138 | 0 |
| C | 0 | 138 | 0 |
| D | 0 | 138 | 0 |
| Mode M9 | |||
|---|---|---|---|
| Quadrant | BADHDUFLAG | Total packets | Discarded packets |
| A | 0 | 7 | 0 |
| B | 0 | 7 | 0 |
| C | 0 | 7 | 0 |
| D | 0 | 7 | 0 |
| Quadrant | Total seconds | Saturated seconds | Saturation percentage |
|---|---|---|---|
| A | 6807 | 23 | 0.337887% |
| B | 6807 | 68 | 0.998972% |
| C | 6807 | 54 | 0.793301% |
| D | 6808 | 1557 | 22.870153% |
Noise dominated data is calculated using 1-second bins in cleaned event files. If a bin has >2000 counts, and if more than 50% of those come from <1% of pixels, then it is considered to be noise-dominated and hence unusable.
| Quadrant | # 1 sec bins | Bins with >0 counts | Bins with >2000 counts | High rate bins dominated by noise | Noise dominated (total time) | Noise dominated (detector-on time) | Marked lightcurve |
|---|---|---|---|---|---|---|---|
| A | 7537 | 6808 | 1 | 1 | 0.01% | 0.01% | 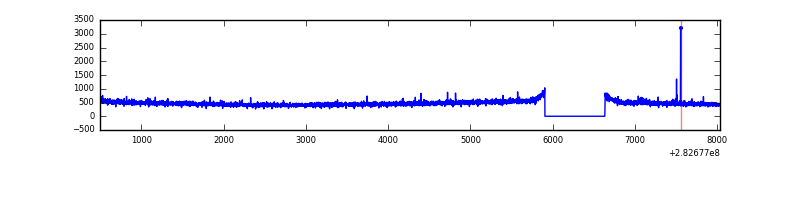 |
| B | 7537 | 6808 | 28 | 28 | 0.37% | 0.41% | 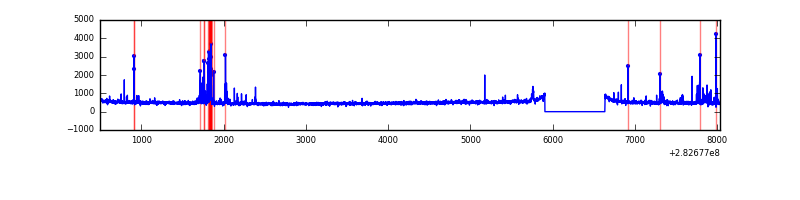 |
| C | 7537 | 6808 | 0 | 0 | 0.00% | 0.00% | 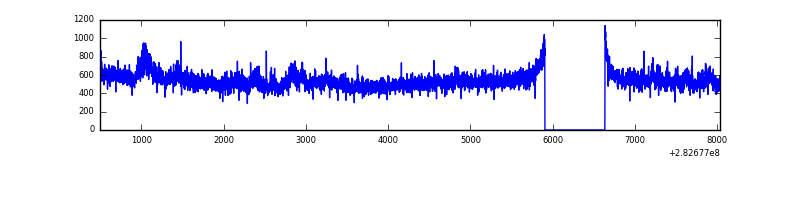 |
| D | 7538 | 6809 | 1259 | 1259 | 16.70% | 18.49% | 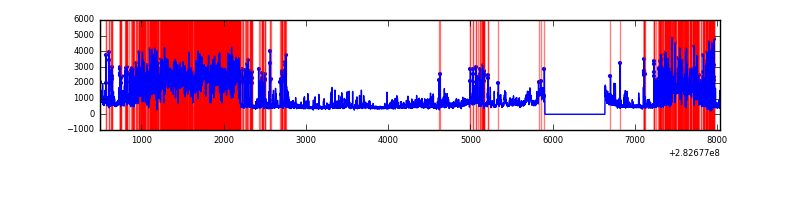 |
Top three noisy pixels from each quadrant. If the there are fewer than three noisy pixels in the level2.evt file, extra rows are filled as -1
| Pixel properties | Quadrant properties | ||||||
|---|---|---|---|---|---|---|---|
| Quadrant | DetID | PixID | Counts | Sigma | Mean | Median | Sigma |
| A | 4 | 2 | 18101 | 102.68 | 831 | 813 | 168.4 |
| A | 0 | 226 | 7397 | 39.11 | 831 | 813 | 168.4 |
| A | 12 | 194 | 6216 | 32.09 | 831 | 813 | 168.4 |
| B | 0 | 197 | 131869 | 821.73 | 827 | 807 | 159.5 |
| B | 7 | 220 | 43482 | 267.56 | 827 | 807 | 159.5 |
| B | 15 | 35 | 33381 | 204.23 | 827 | 807 | 159.5 |
| C | 3 | 233 | 372936 | 2004.46 | 791 | 798 | 185.7 |
| C | 14 | 238 | 121427 | 649.75 | 791 | 798 | 185.7 |
| C | 5 | 218 | 94269 | 503.47 | 791 | 798 | 185.7 |
| D | 11 | 176 | 3002457 | 16933.28 | 723 | 703 | 177.3 |
| D | 1 | 52 | 1058044 | 5964.6 | 723 | 703 | 177.3 |
| D | 13 | 232 | 482176 | 2716.05 | 723 | 703 | 177.3 |
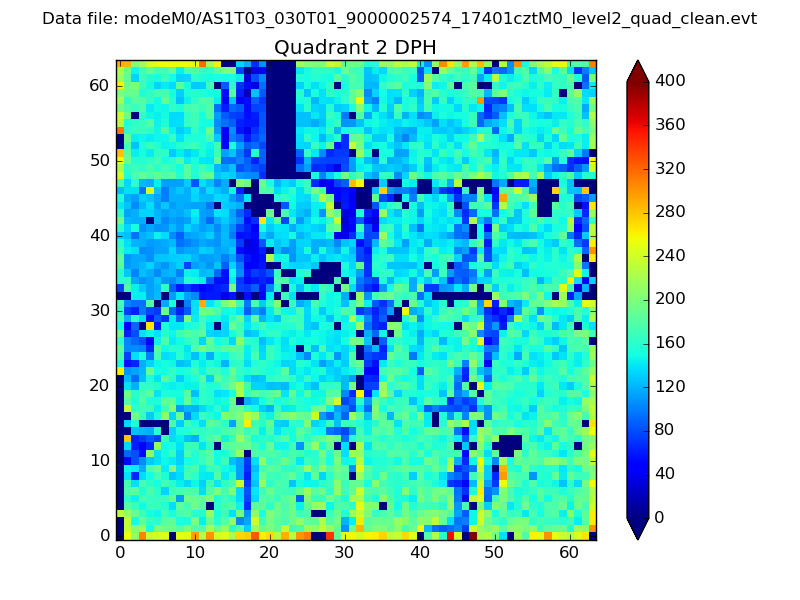
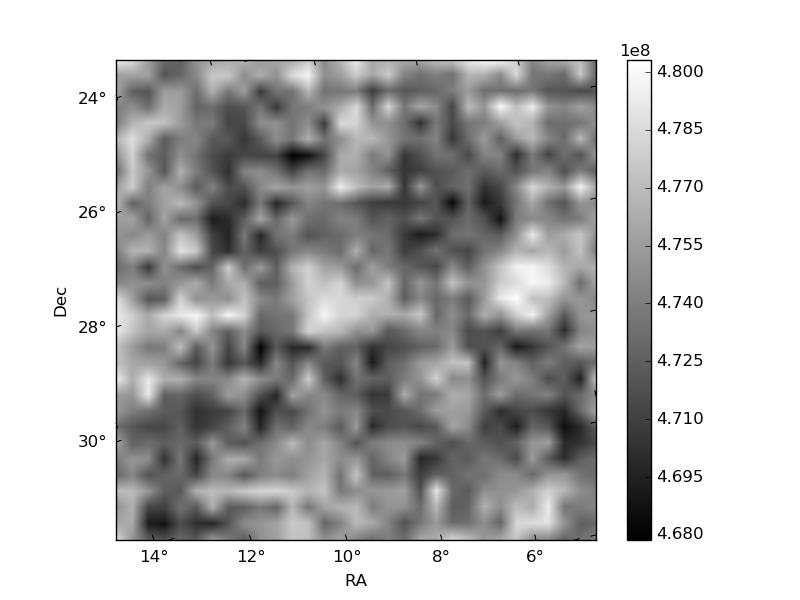
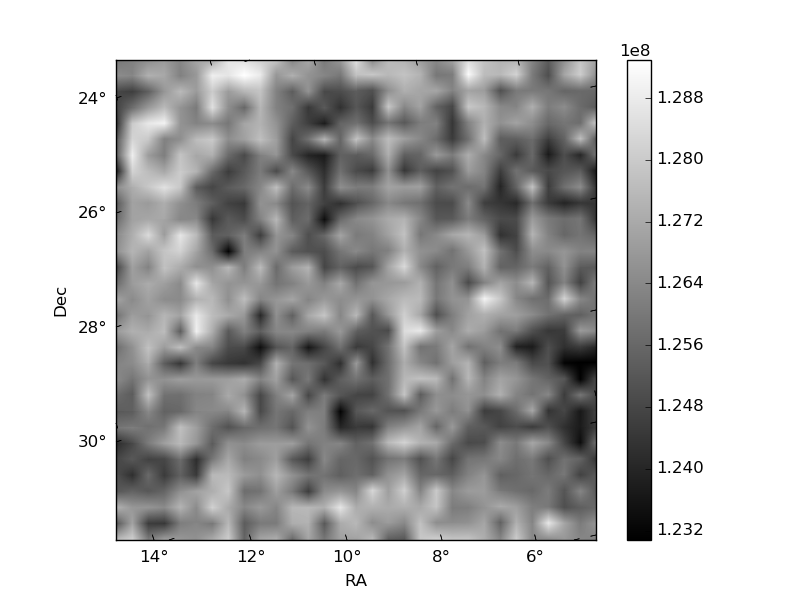
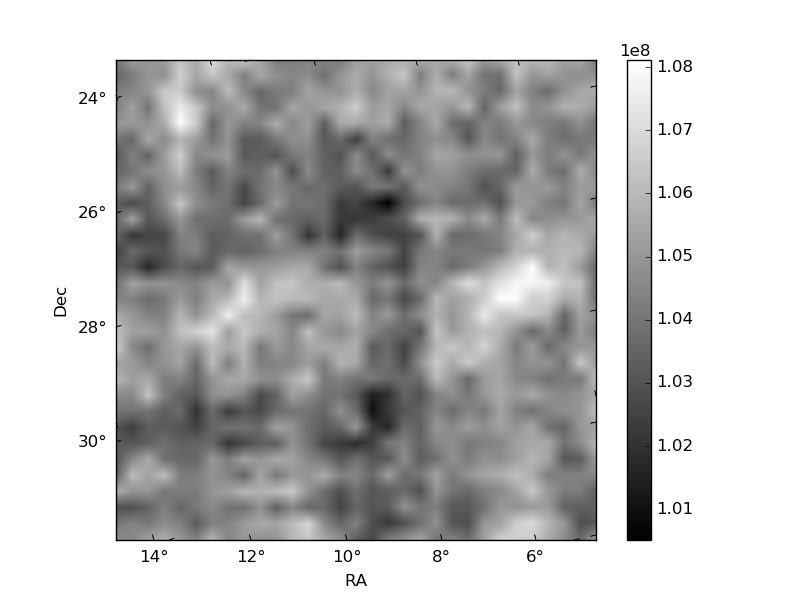
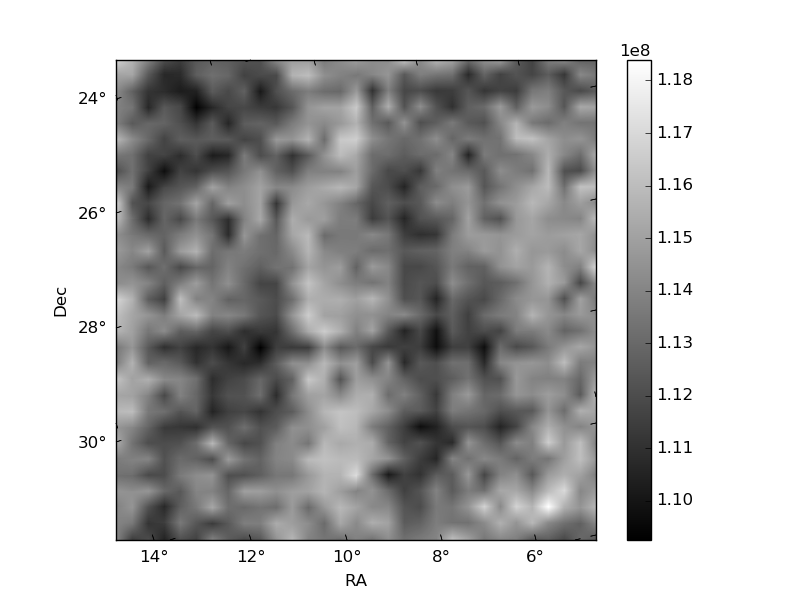
Histogram calculated using DETX and DETY for each event in the final _common_clean file
| Quadrant A | 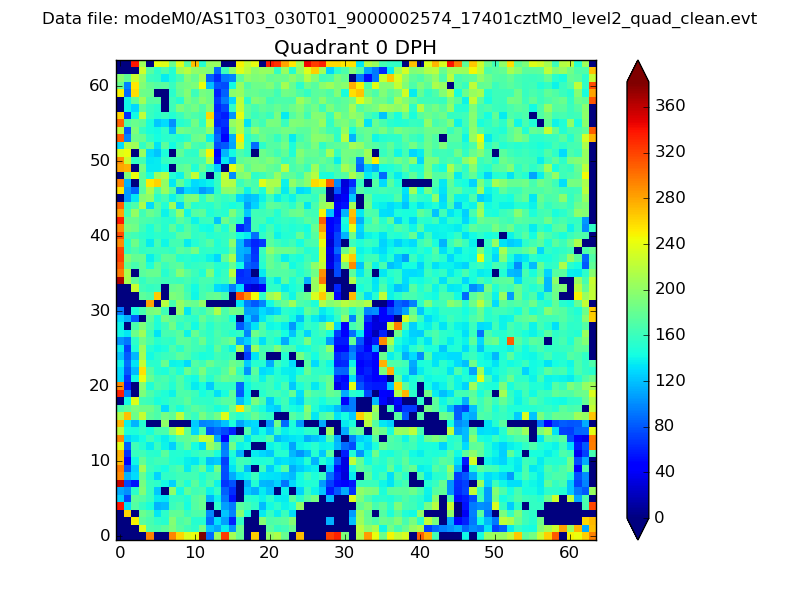 |
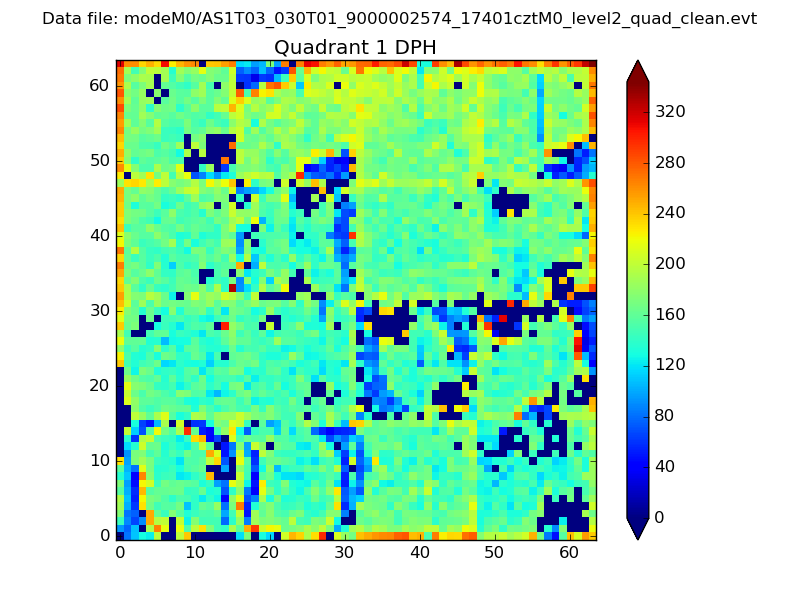 |
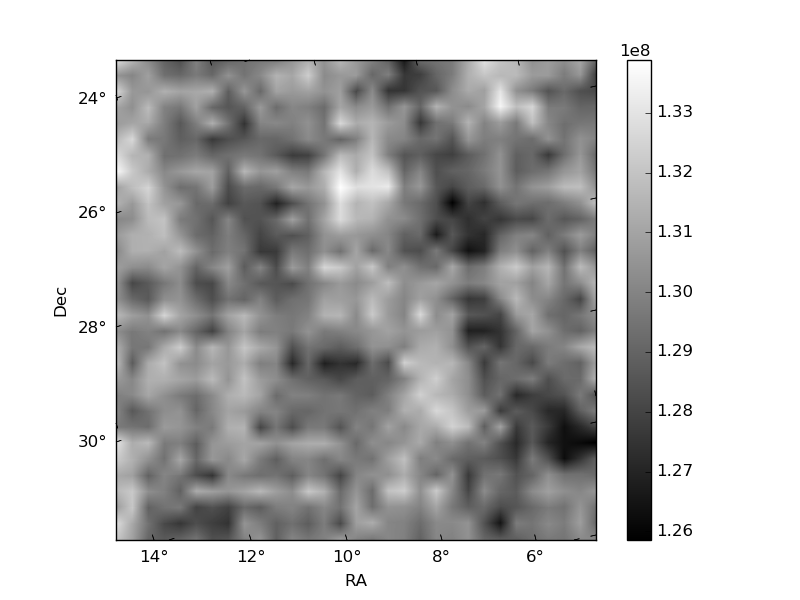
Quadrant B |
|---|---|---|---|
| Quadrant D | 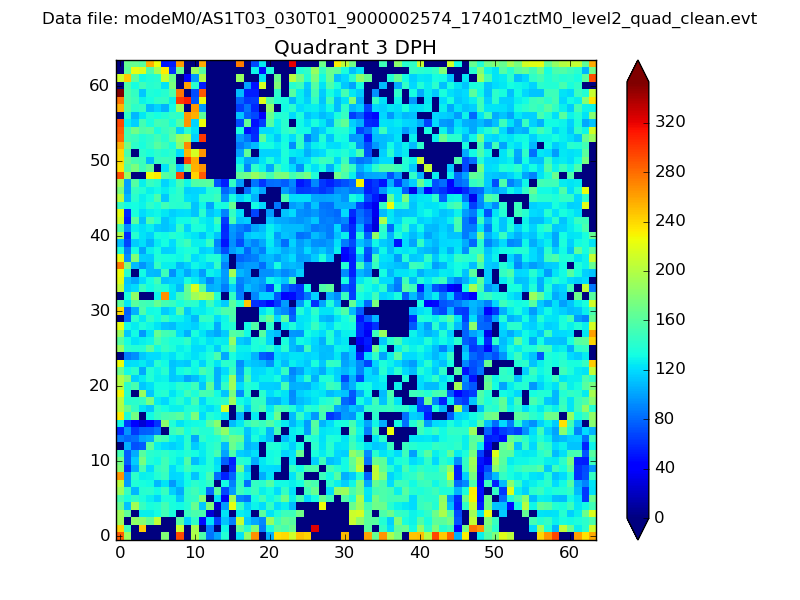 |
 |
Quadrant C |
| Plot type | Count rate plots | Images |
|---|---|---|
| Comparison with Poisson distribution Blue bars denote a histogram of data divided into 1 sec bins. Red curve is a Poisson curve with rate = median count rate of data. |
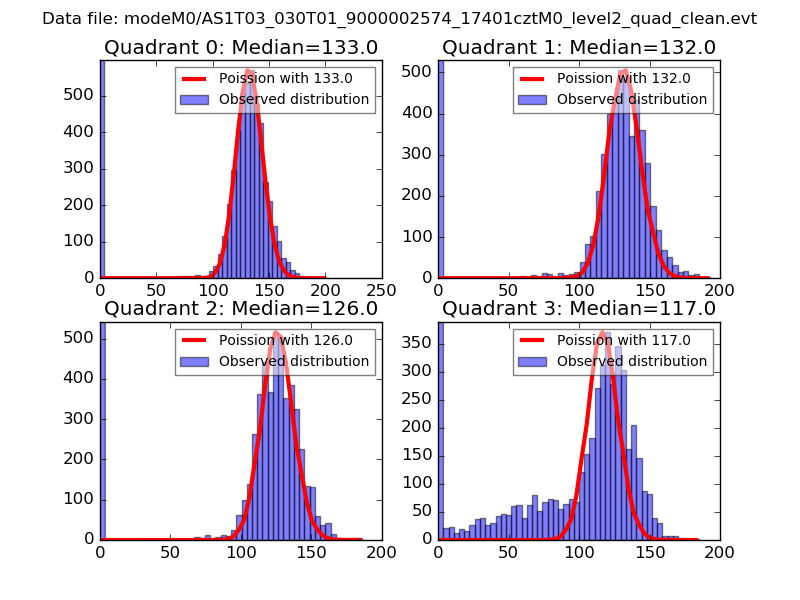 |
 |
| Quadrant-wise count rates Data is divided into 100 sec bins |
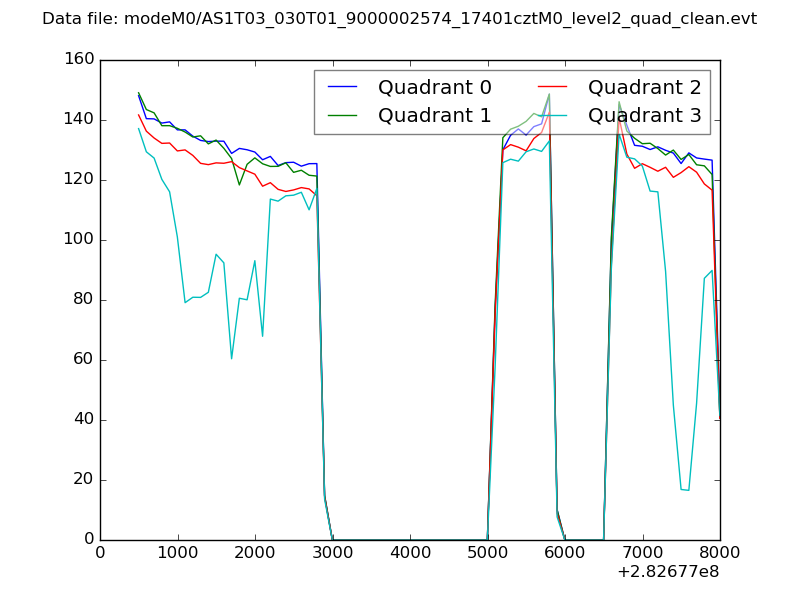 |
|
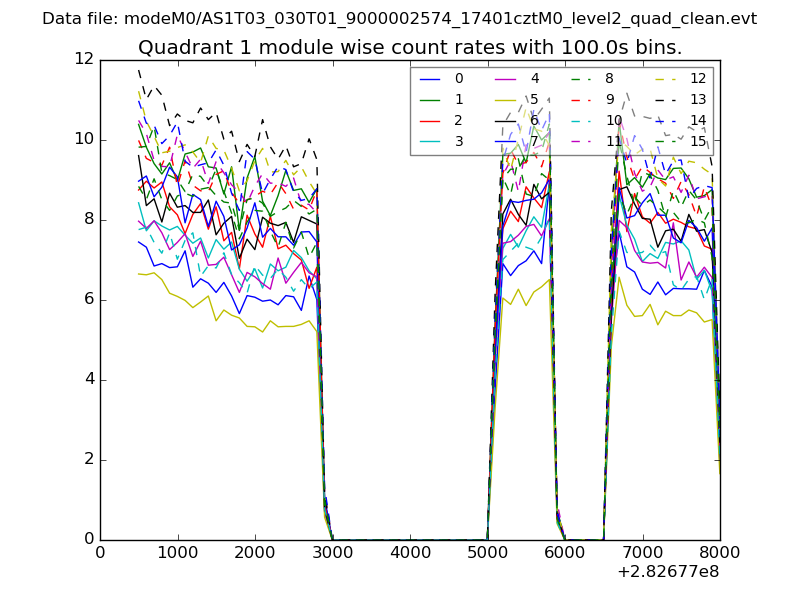
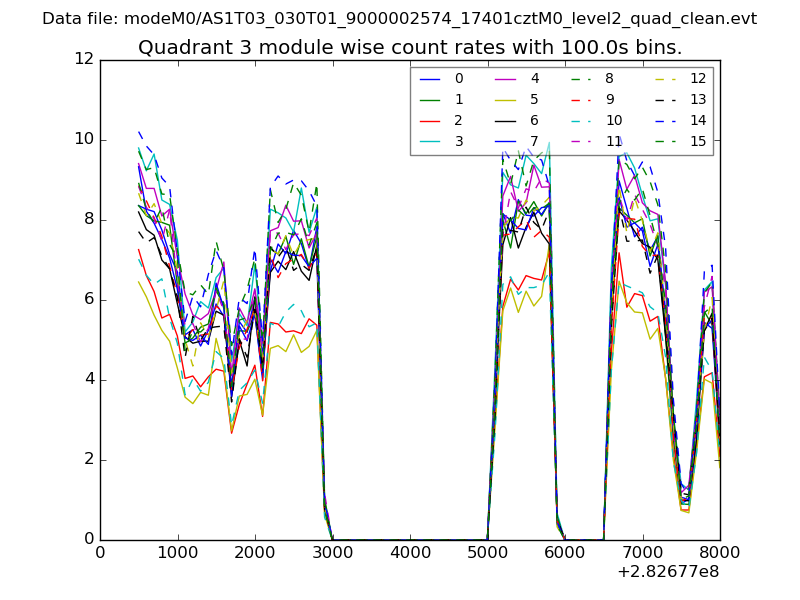
| Module-wise count rates for Quadrant A Data is divided into 100 sec bins |
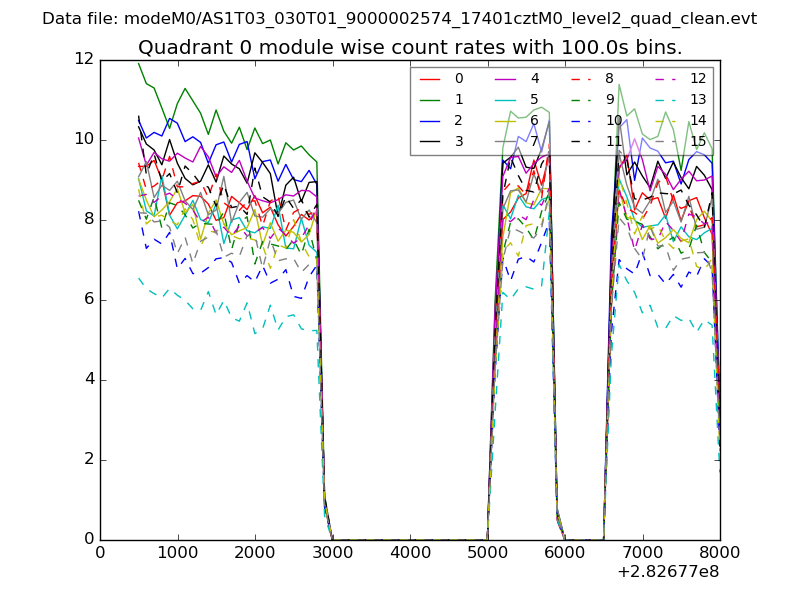 |
 |
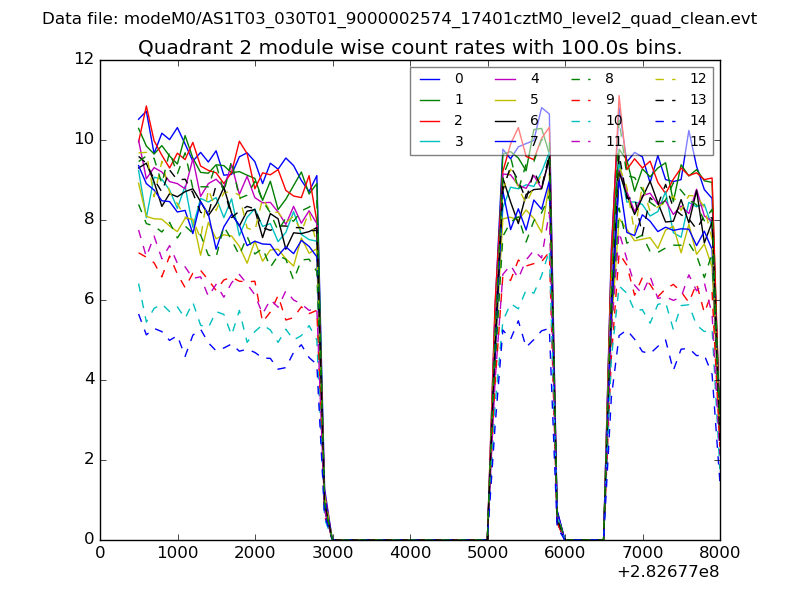
| Module-wise count rates for Quadrant B Data is divided into 100 sec bins |
 |
 |
| Module-wise count rates for Quadrant C Data is divided into 100 sec bins |
 |
 |
| Module-wise count rates for Quadrant D Data is divided into 100 sec bins |
 |
 |
| Parameter | Plot |
|---|---|
| CZT HV Monitor | 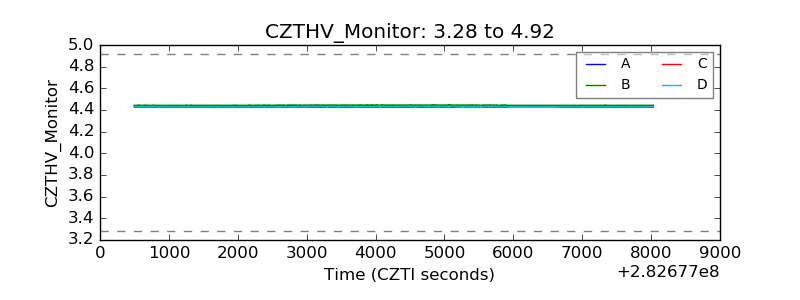 |
| D_VDD | 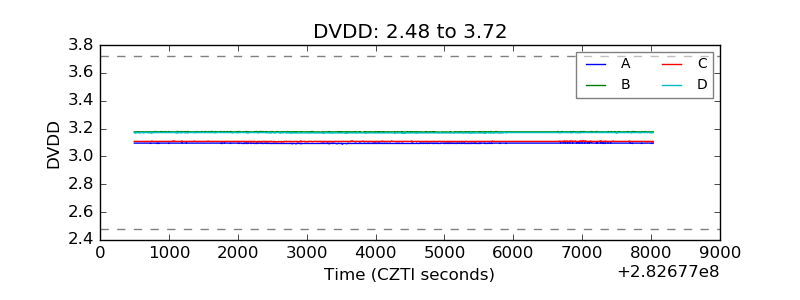 |
| Temperature 1 | 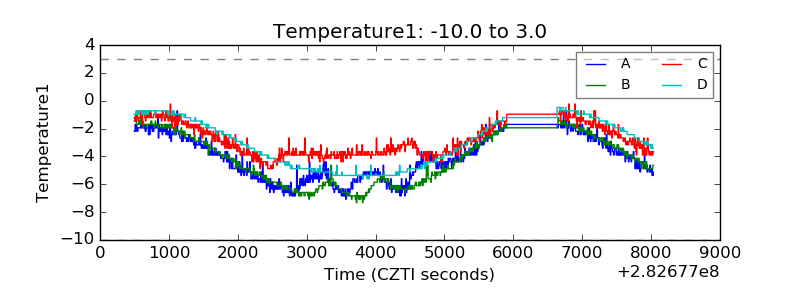 |
| Veto HV Monitor | 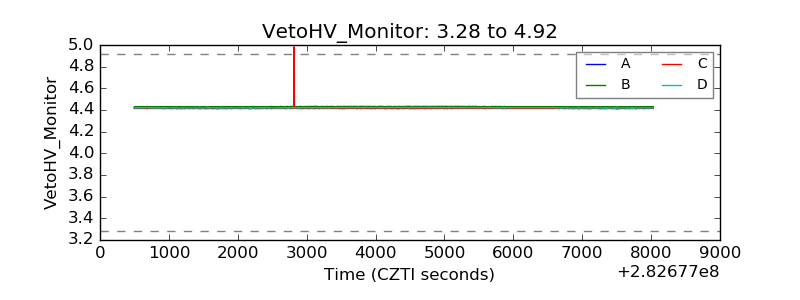 |
| Veto LLD | 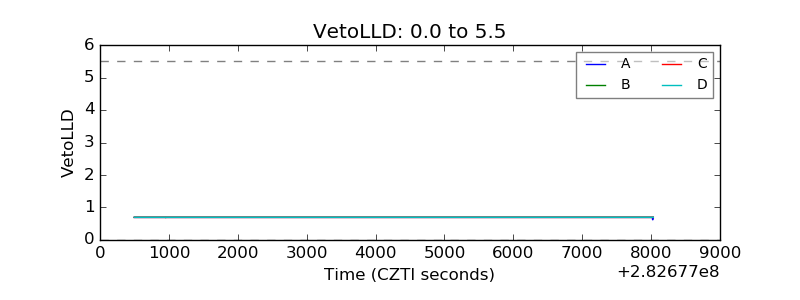 |
| Alpha Counter | 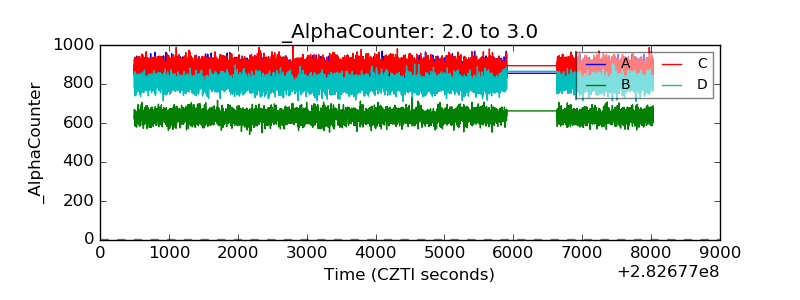 |
| _CPM_Rate | 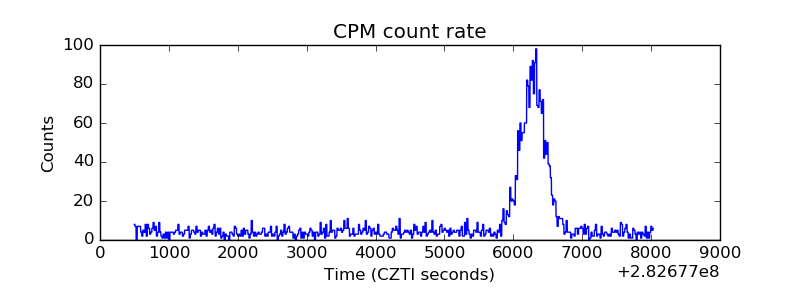 |
| CZT Counter | 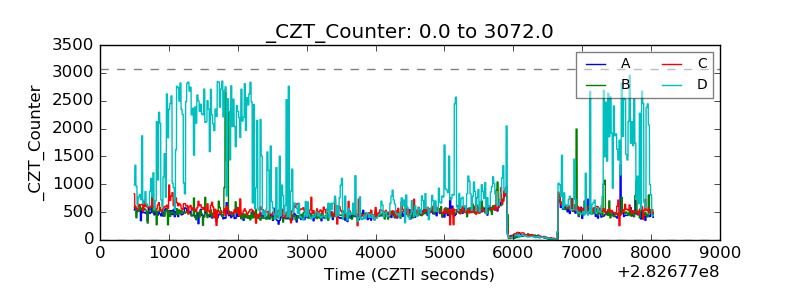 |
| +2.5 Volts monitor |  |
| +5 Volts monitor | 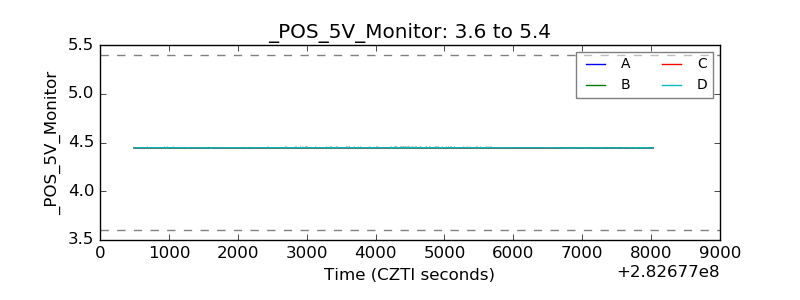 |
| _ROLL_ROT | 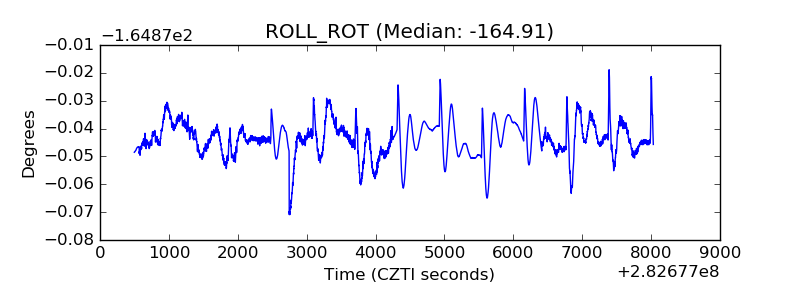 |
| _Roll_DEC | 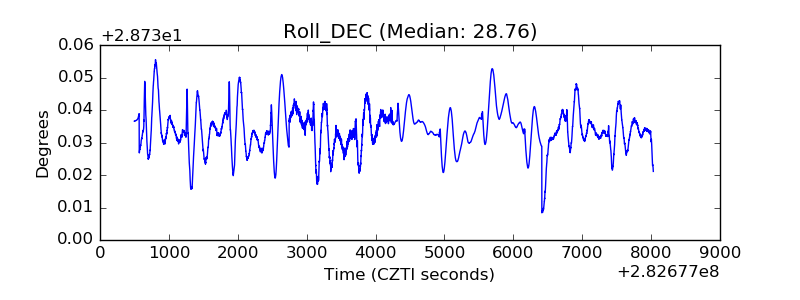 |
| _Roll_RA | 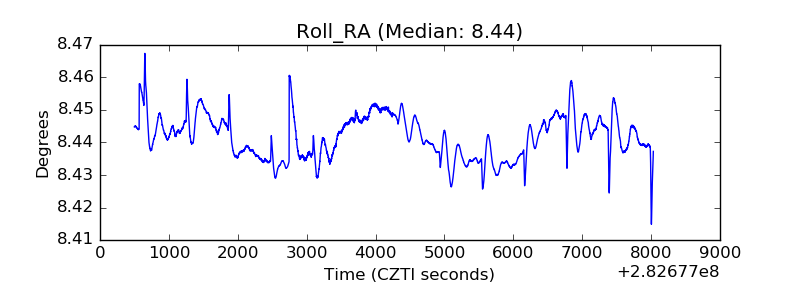 |
| Veto Counter | 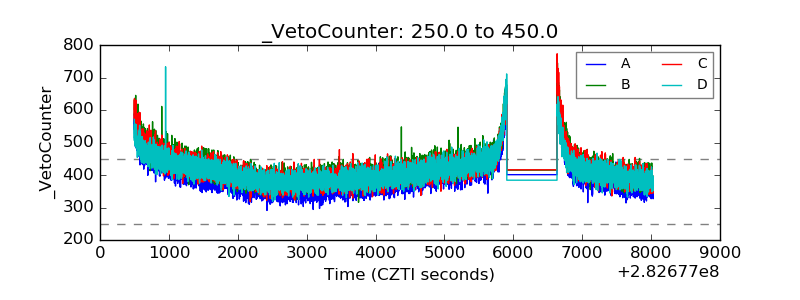 |