| Param | Original file | Final file |
|---|---|---|
| Filename | modeM0/AS1T03_030T01_9000002574_17403cztM0_level2.evt | modeM0/AS1T03_030T01_9000002574_17403cztM0_level2_quad_clean.evt |
| Size (bytes) | 721,635,840 | 115,813,440 |
| Size | 688.2 MB | 110.4 MB |
| Events in quadrant A | 3,986,993 | 771,217 |
| Events in quadrant B | 4,629,933 | 761,167 |
| Events in quadrant C | 4,349,972 | 738,445 |
| Events in quadrant D | 8,318,258 | 651,728 |
| Mode M0 | |||
|---|---|---|---|
| Quadrant | BADHDUFLAG | Total packets | Discarded packets |
| A | 0 | 17430 | 2 |
| B | 0 | 19331 | 2 |
| C | 0 | 17884 | 2 |
| D | 0 | 30455 | 2 |
| Mode SS | |||
|---|---|---|---|
| Quadrant | BADHDUFLAG | Total packets | Discarded packets |
| A | 0 | 172 | 0 |
| B | 0 | 172 | 0 |
| C | 0 | 172 | 0 |
| D | 0 | 172 | 0 |
| Mode M9 | |||
|---|---|---|---|
| Quadrant | BADHDUFLAG | Total packets | Discarded packets |
| A | 0 | 5 | 0 |
| B | 0 | 5 | 0 |
| C | 0 | 5 | 0 |
| D | 0 | 5 | 0 |
| Quadrant | Total seconds | Saturated seconds | Saturation percentage |
|---|---|---|---|
| A | 8411 | 70 | 0.832243% |
| B | 8412 | 280 | 3.328578% |
| C | 8412 | 140 | 1.664289% |
| D | 8412 | 1444 | 17.165953% |
Noise dominated data is calculated using 1-second bins in cleaned event files. If a bin has >2000 counts, and if more than 50% of those come from <1% of pixels, then it is considered to be noise-dominated and hence unusable.
| Quadrant | # 1 sec bins | Bins with >0 counts | Bins with >2000 counts | High rate bins dominated by noise | Noise dominated (total time) | Noise dominated (detector-on time) | Marked lightcurve |
|---|---|---|---|---|---|---|---|
| A | 8886 | 8413 | 0 | 0 | 0.00% | 0.00% | 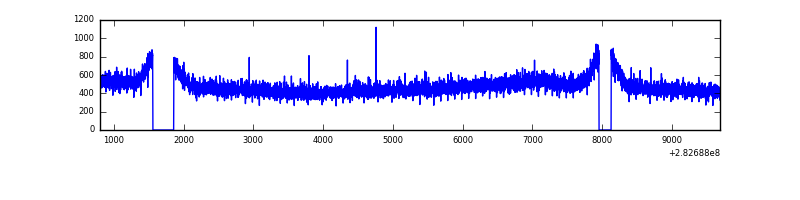 |
| B | 8887 | 8414 | 80 | 80 | 0.90% | 0.95% | 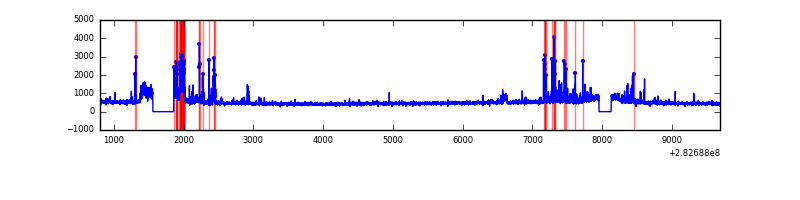 |
| C | 8887 | 8414 | 0 | 0 | 0.00% | 0.00% | 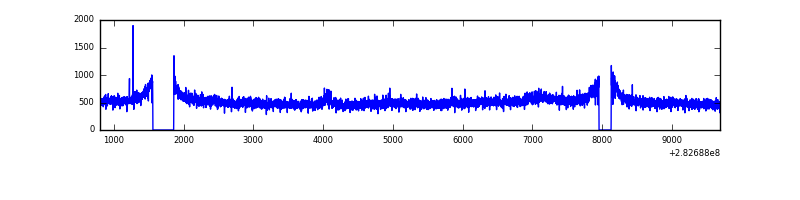 |
| D | 8887 | 8414 | 1197 | 1197 | 13.47% | 14.23% | 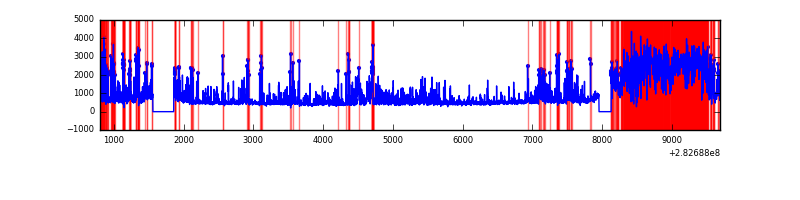 |
Top three noisy pixels from each quadrant. If the there are fewer than three noisy pixels in the level2.evt file, extra rows are filled as -1
| Pixel properties | Quadrant properties | ||||||
|---|---|---|---|---|---|---|---|
| Quadrant | DetID | PixID | Counts | Sigma | Mean | Median | Sigma |
| A | 0 | 226 | 8943 | 37.86 | 1035 | 1012 | 209.5 |
| A | 12 | 194 | 7708 | 31.96 | 1035 | 1012 | 209.5 |
| A | 3 | 137 | 7412 | 30.55 | 1035 | 1012 | 209.5 |
| B | 7 | 220 | 324896 | 1633.27 | 1021 | 993 | 198.3 |
| B | 0 | 197 | 81762 | 407.28 | 1021 | 993 | 198.3 |
| B | 15 | 35 | 58318 | 289.06 | 1021 | 993 | 198.3 |
| C | 3 | 233 | 218338 | 938.34 | 986 | 992 | 231.6 |
| C | 14 | 238 | 149171 | 639.73 | 986 | 992 | 231.6 |
| C | 5 | 218 | 122285 | 523.65 | 986 | 992 | 231.6 |
| D | 11 | 176 | 3193326 | 13979.88 | 935 | 904 | 228.4 |
| D | 13 | 232 | 838404 | 3667.48 | 935 | 904 | 228.4 |
| D | 1 | 52 | 409430 | 1788.97 | 935 | 904 | 228.4 |
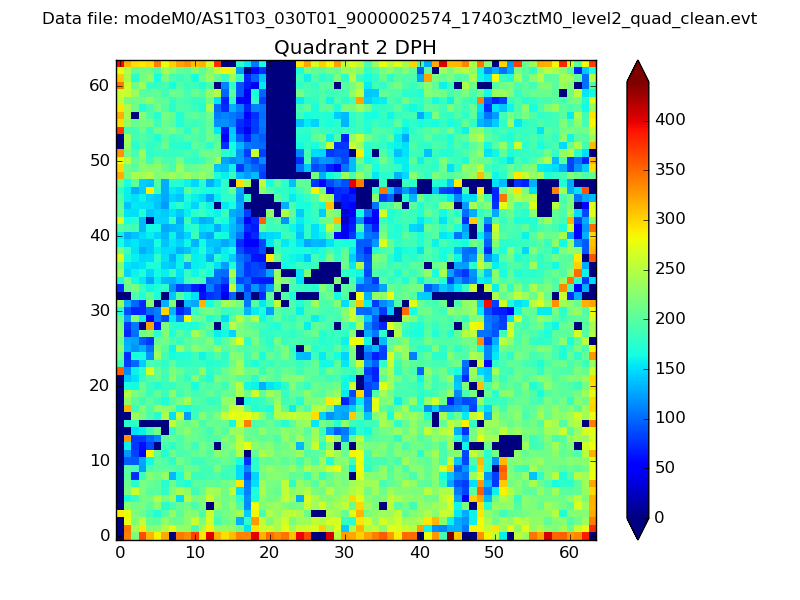
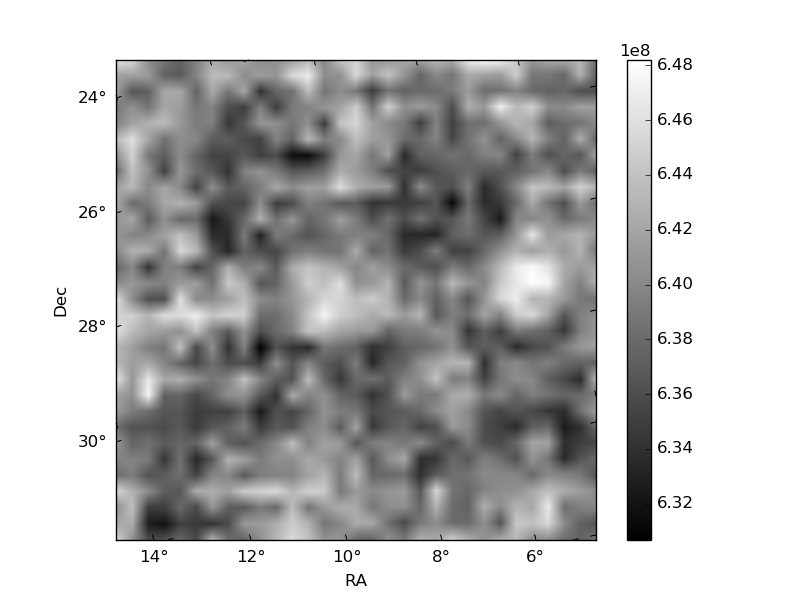
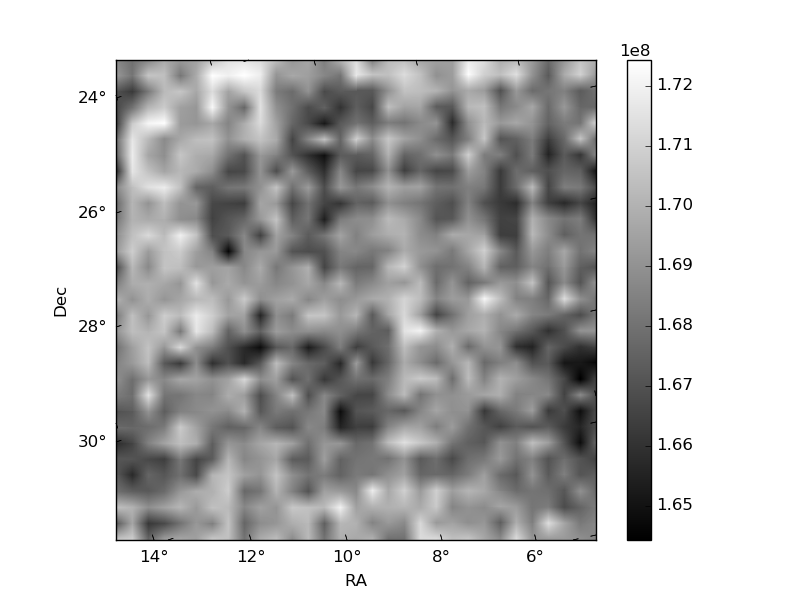
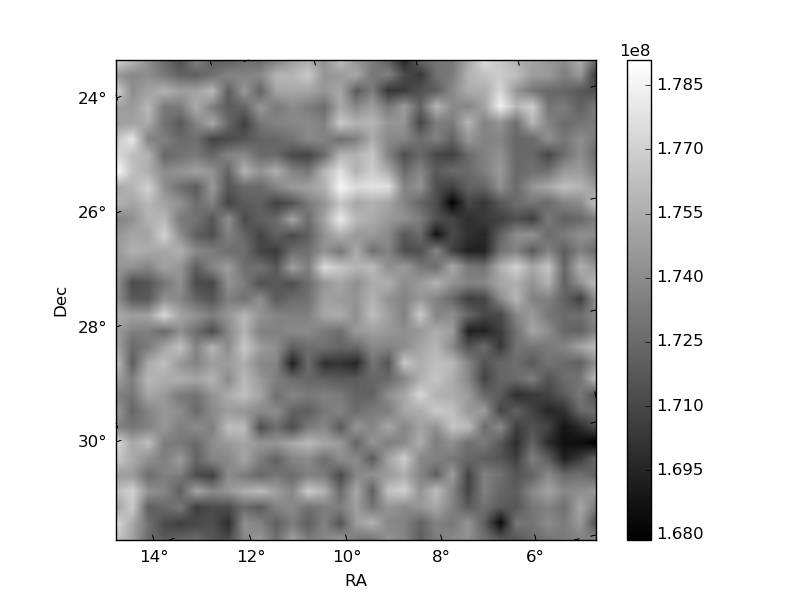
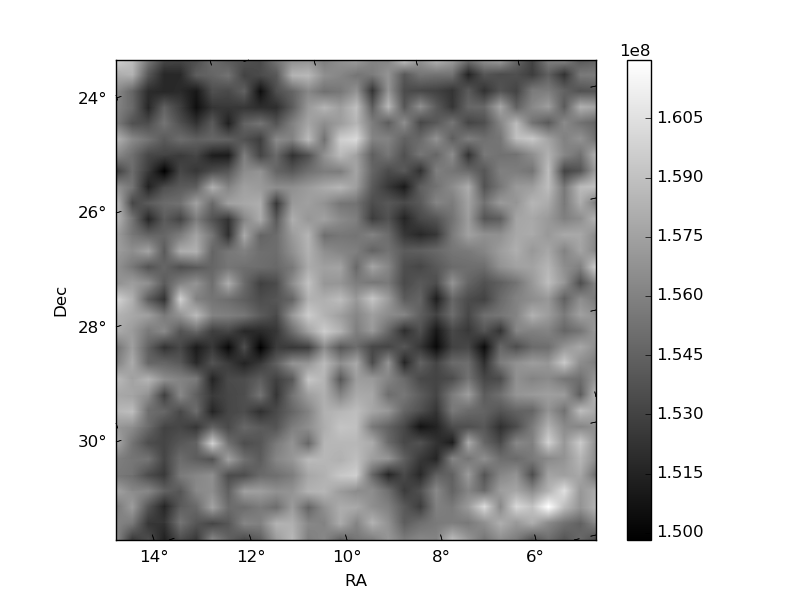
Histogram calculated using DETX and DETY for each event in the final _common_clean file
| Quadrant A | 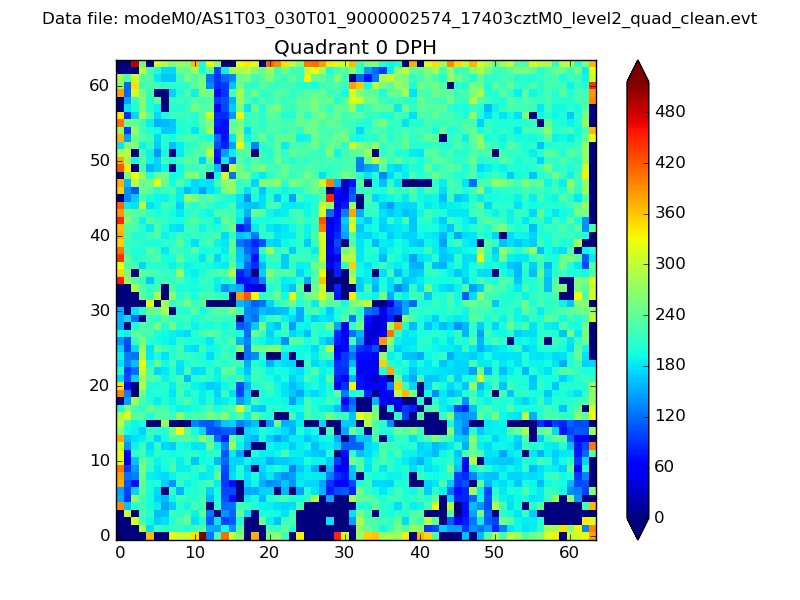 |
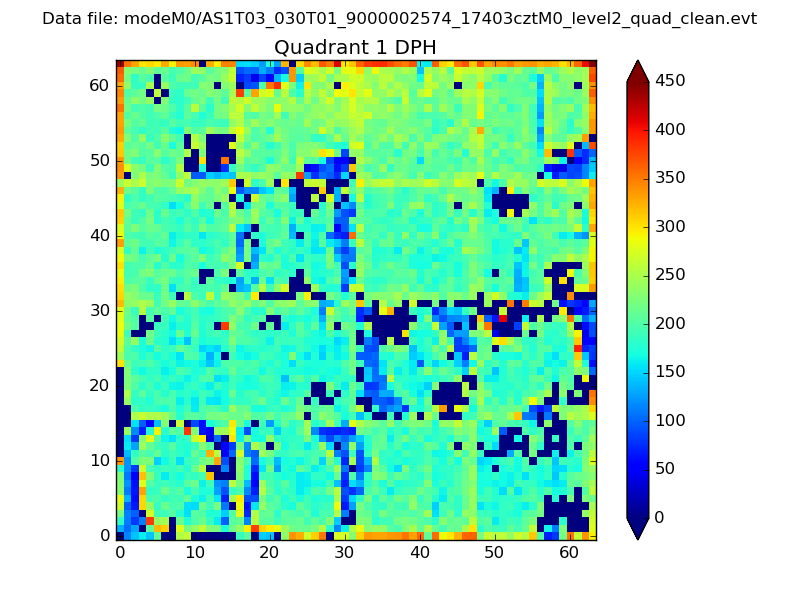 |
Quadrant B |
|---|---|---|---|
| Quadrant D | 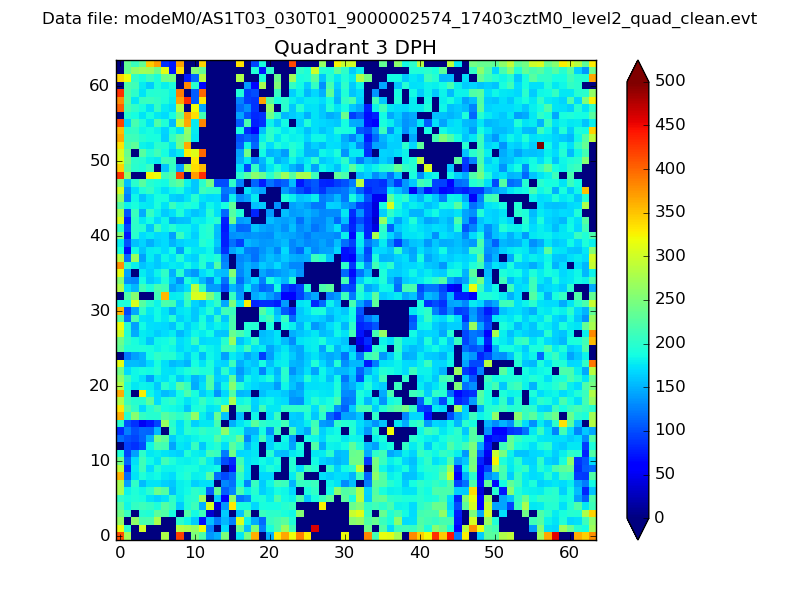 |
 |
Quadrant C |
| Plot type | Count rate plots | Images |
|---|---|---|
| Comparison with Poisson distribution Blue bars denote a histogram of data divided into 1 sec bins. Red curve is a Poisson curve with rate = median count rate of data. |
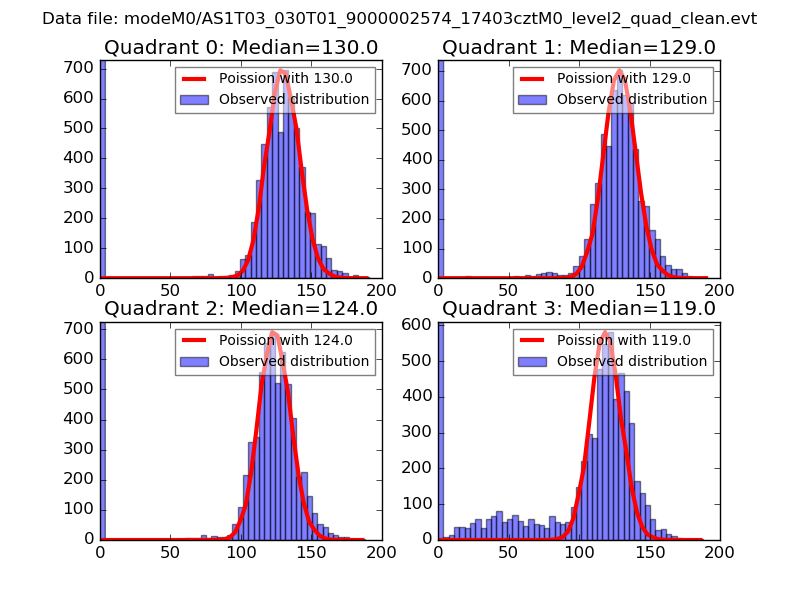 |
 |
| Quadrant-wise count rates Data is divided into 100 sec bins |
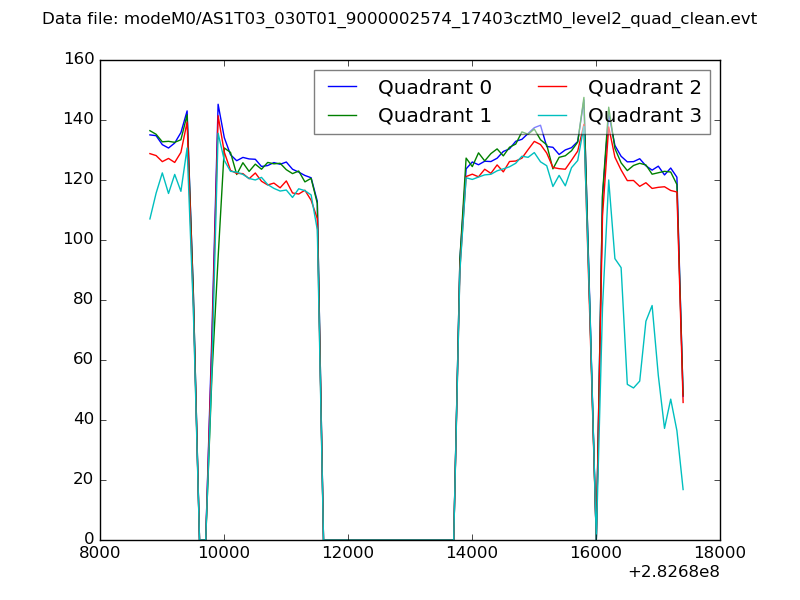 |
|
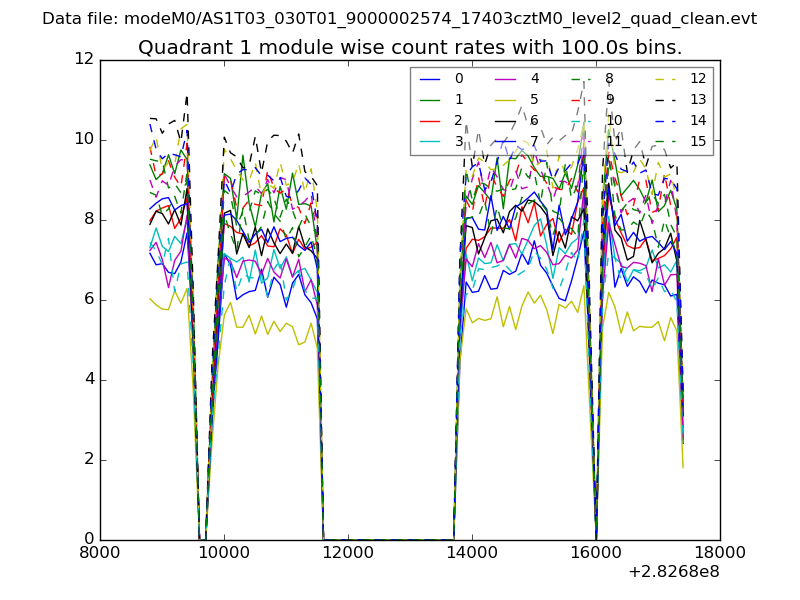
| Module-wise count rates for Quadrant A Data is divided into 100 sec bins |
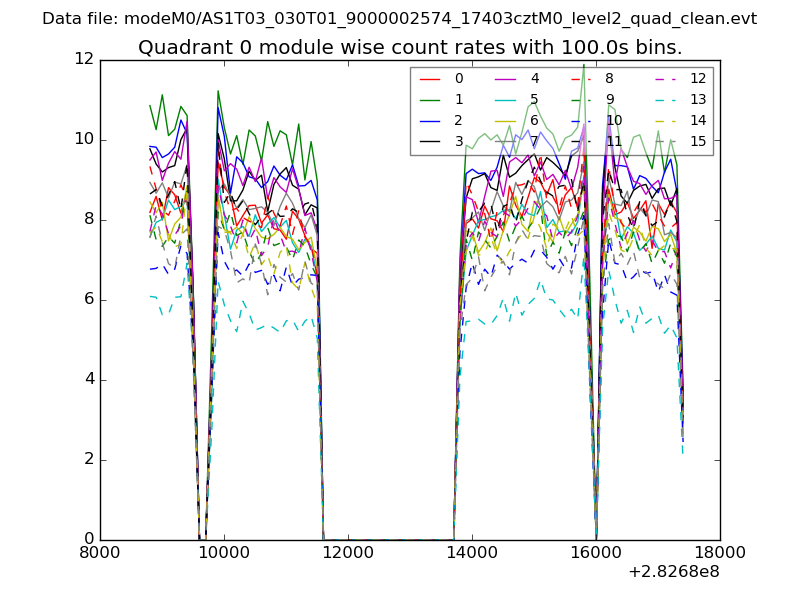 |
 |
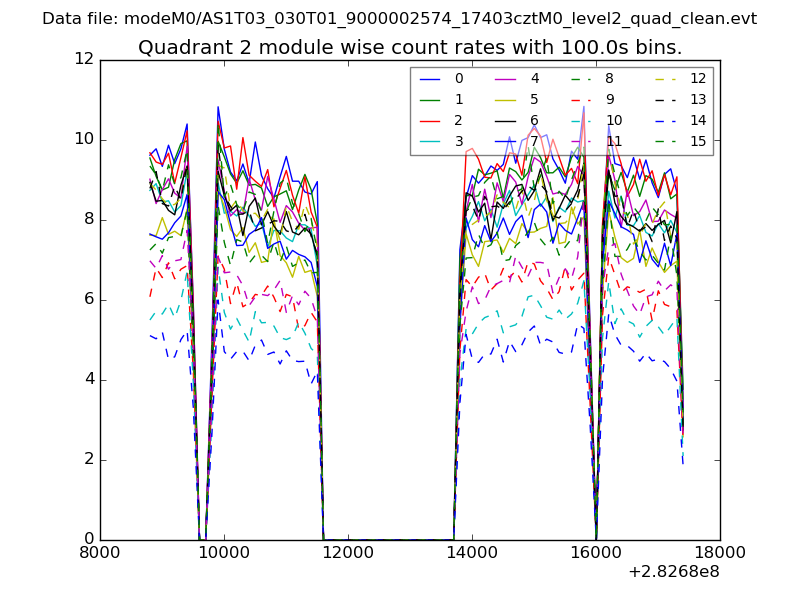
| Module-wise count rates for Quadrant B Data is divided into 100 sec bins |
 |
 |
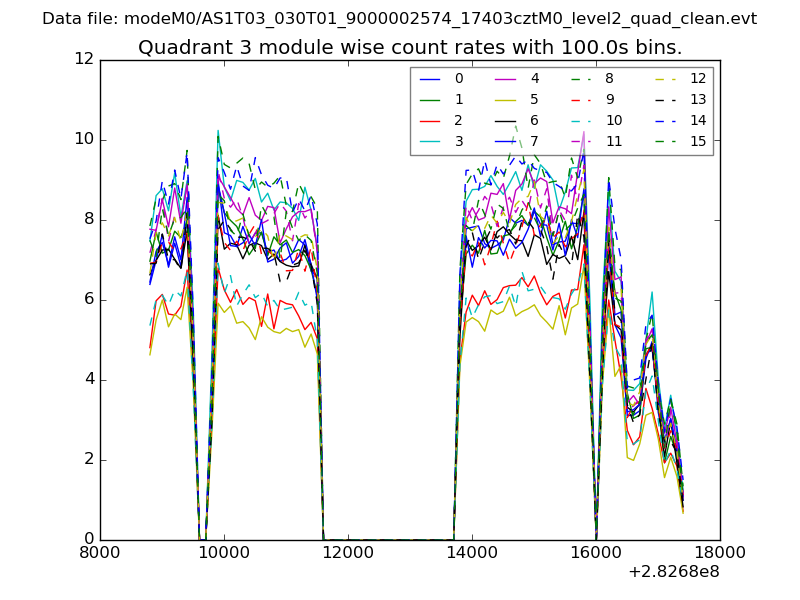
| Module-wise count rates for Quadrant C Data is divided into 100 sec bins |
 |
 |
| Module-wise count rates for Quadrant D Data is divided into 100 sec bins |
 |
 |
| Parameter | Plot |
|---|---|
| CZT HV Monitor | 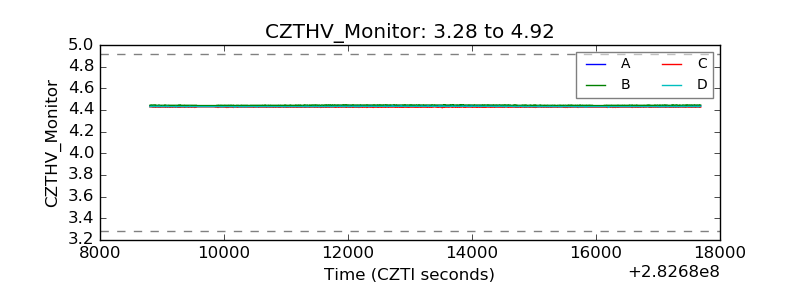 |
| D_VDD | 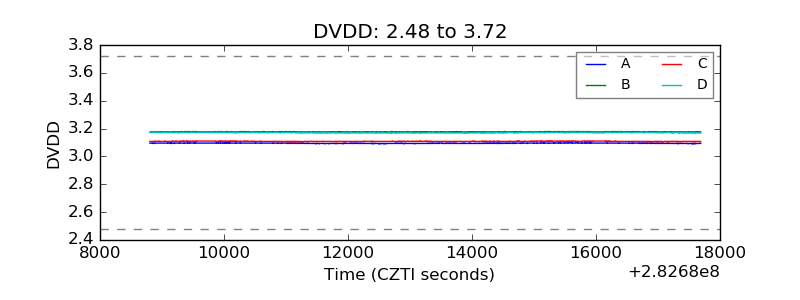 |
| Temperature 1 | 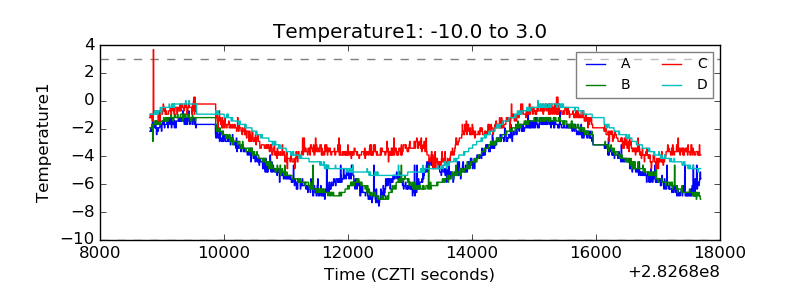 |
| Veto HV Monitor | 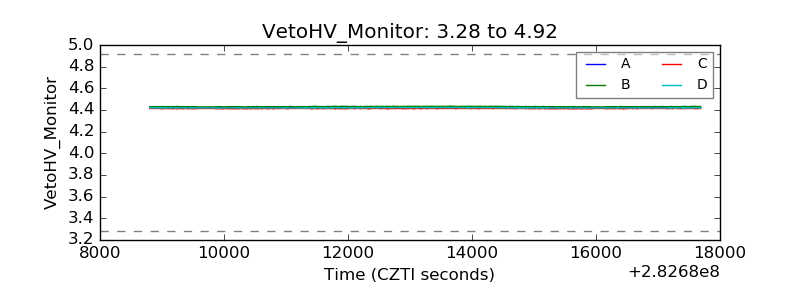 |
| Veto LLD | 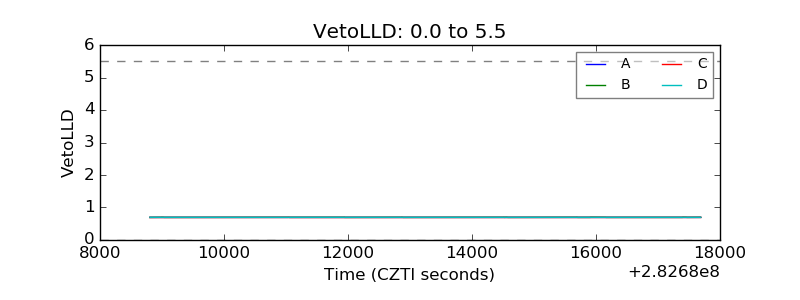 |
| Alpha Counter | 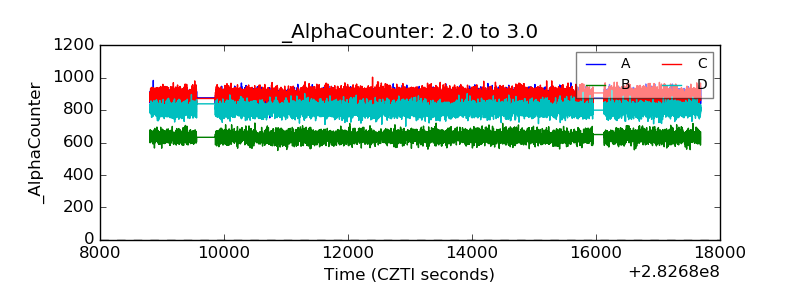 |
| _CPM_Rate | 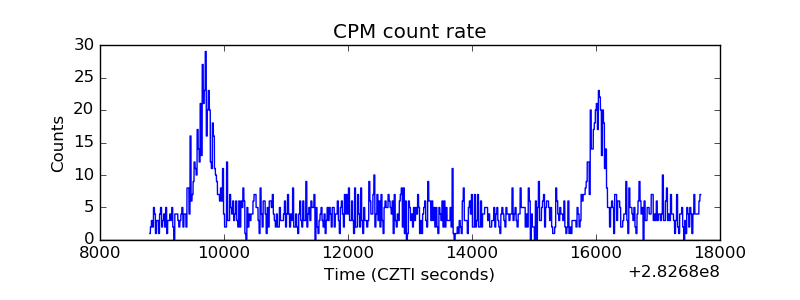 |
| CZT Counter | 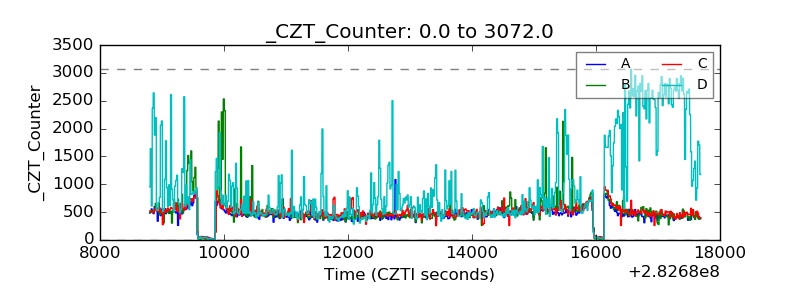 |
| +2.5 Volts monitor |  |
| +5 Volts monitor | 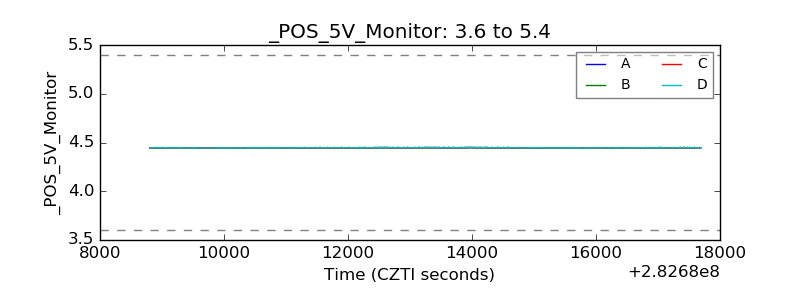 |
| _ROLL_ROT | 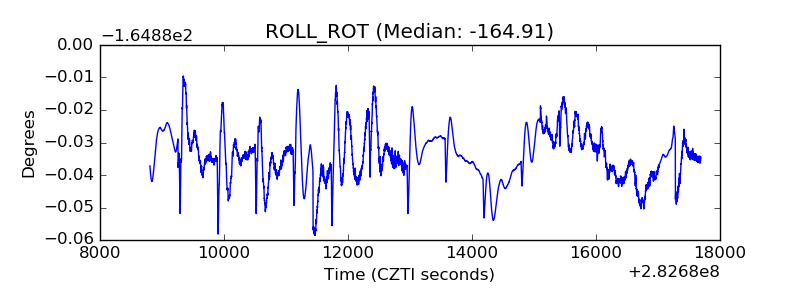 |
| _Roll_DEC | 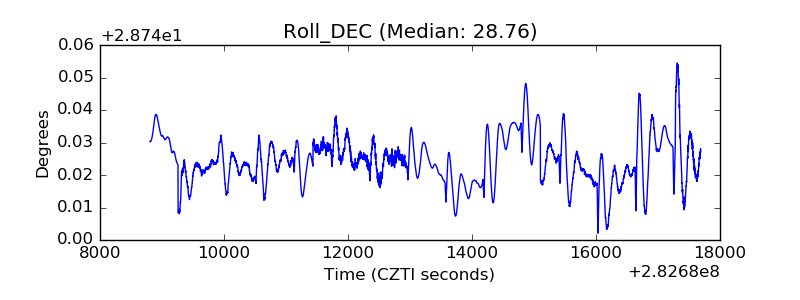 |
| _Roll_RA | 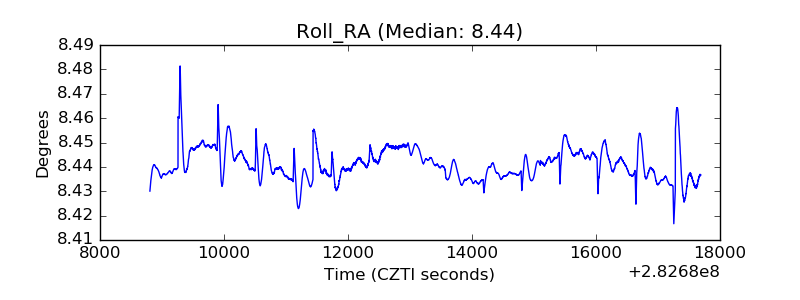 |
| Veto Counter | 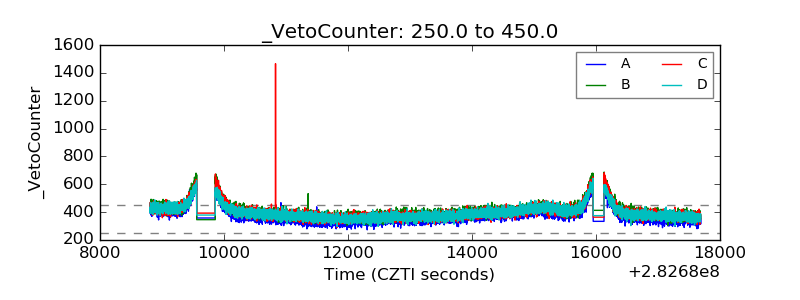 |