| Param | Original file | Final file |
|---|---|---|
| Filename | modeM0/AS1T03_030T01_9000002574_17404cztM0_level2.evt | modeM0/AS1T03_030T01_9000002574_17404cztM0_level2_quad_clean.evt |
| Size (bytes) | 694,025,280 | 82,722,240 |
| Size | 661.9 MB | 78.9 MB |
| Events in quadrant A | 3,307,790 | 540,095 |
| Events in quadrant B | 3,490,362 | 539,545 |
| Events in quadrant C | 3,557,246 | 518,397 |
| Events in quadrant D | 10,169,315 | 397,997 |
| Mode M0 | |||
|---|---|---|---|
| Quadrant | BADHDUFLAG | Total packets | Discarded packets |
| A | 0 | 14770 | 1 |
| B | 0 | 15162 | 1 |
| C | 0 | 14909 | 1 |
| D | 0 | 35275 | 1 |
| Mode SS | |||
|---|---|---|---|
| Quadrant | BADHDUFLAG | Total packets | Discarded packets |
| A | 0 | 148 | 0 |
| B | 0 | 148 | 0 |
| C | 0 | 148 | 0 |
| D | 0 | 148 | 0 |
| Mode M9 | |||
|---|---|---|---|
| Quadrant | BADHDUFLAG | Total packets | Discarded packets |
| A | 0 | 5 | 0 |
| B | 0 | 5 | 0 |
| C | 0 | 5 | 0 |
| D | 0 | 5 | 0 |
| Quadrant | Total seconds | Saturated seconds | Saturation percentage |
|---|---|---|---|
| A | 7297 | 19 | 0.260381% |
| B | 7297 | 37 | 0.507058% |
| C | 7297 | 32 | 0.438536% |
| D | 7297 | 2059 | 28.217076% |
Noise dominated data is calculated using 1-second bins in cleaned event files. If a bin has >2000 counts, and if more than 50% of those come from <1% of pixels, then it is considered to be noise-dominated and hence unusable.
| Quadrant | # 1 sec bins | Bins with >0 counts | Bins with >2000 counts | High rate bins dominated by noise | Noise dominated (total time) | Noise dominated (detector-on time) | Marked lightcurve |
|---|---|---|---|---|---|---|---|
| A | 7732 | 7298 | 0 | 0 | 0.00% | 0.00% |  |
| B | 7732 | 7298 | 5 | 5 | 0.06% | 0.07% |  |
| C | 7732 | 7298 | 0 | 0 | 0.00% | 0.00% |  |
| D | 7732 | 7298 | 1878 | 1878 | 24.29% | 25.73% | 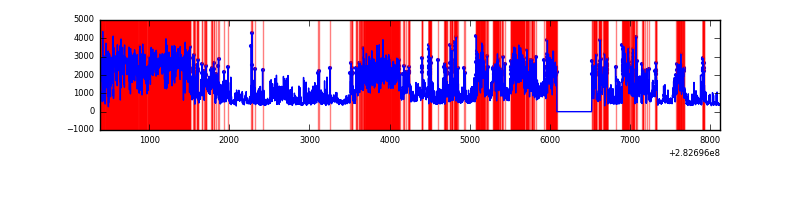 |
Top three noisy pixels from each quadrant. If the there are fewer than three noisy pixels in the level2.evt file, extra rows are filled as -1
| Pixel properties | Quadrant properties | ||||||
|---|---|---|---|---|---|---|---|
| Quadrant | DetID | PixID | Counts | Sigma | Mean | Median | Sigma |
| A | 0 | 226 | 7320 | 36.84 | 860 | 839 | 175.9 |
| A | 12 | 194 | 6364 | 31.4 | 860 | 839 | 175.9 |
| A | 3 | 137 | 6277 | 30.91 | 860 | 839 | 175.9 |
| B | 7 | 220 | 32887 | 191.85 | 858 | 835 | 167.1 |
| B | 0 | 197 | 30937 | 180.17 | 858 | 835 | 167.1 |
| B | 0 | 230 | 26634 | 154.42 | 858 | 835 | 167.1 |
| C | 14 | 238 | 125408 | 645.59 | 822 | 827 | 193.0 |
| C | 5 | 218 | 122974 | 632.97 | 822 | 827 | 193.0 |
| C | 3 | 233 | 85549 | 439.03 | 822 | 827 | 193.0 |
| D | 11 | 176 | 6221686 | 34093.99 | 743 | 720 | 182.5 |
| D | 13 | 232 | 826050 | 4523.22 | 743 | 720 | 182.5 |
| D | 10 | 70 | 102903 | 560.01 | 743 | 720 | 182.5 |
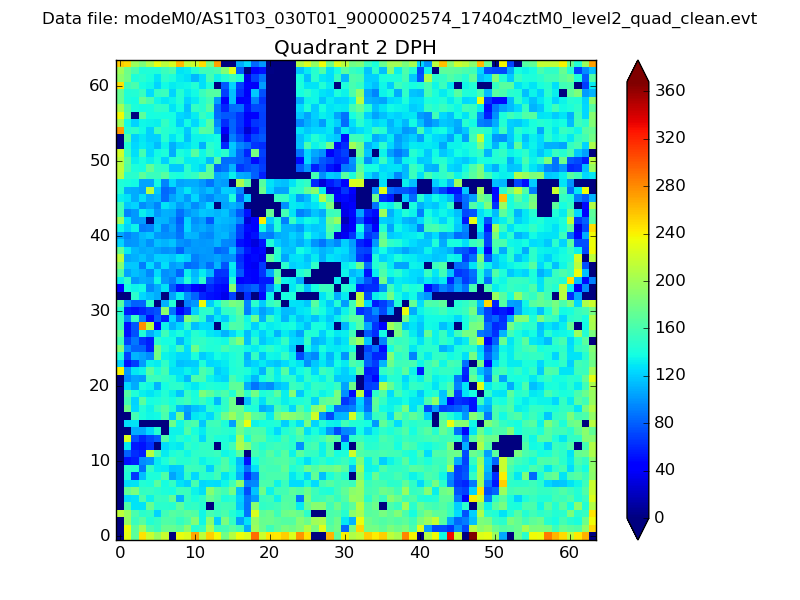
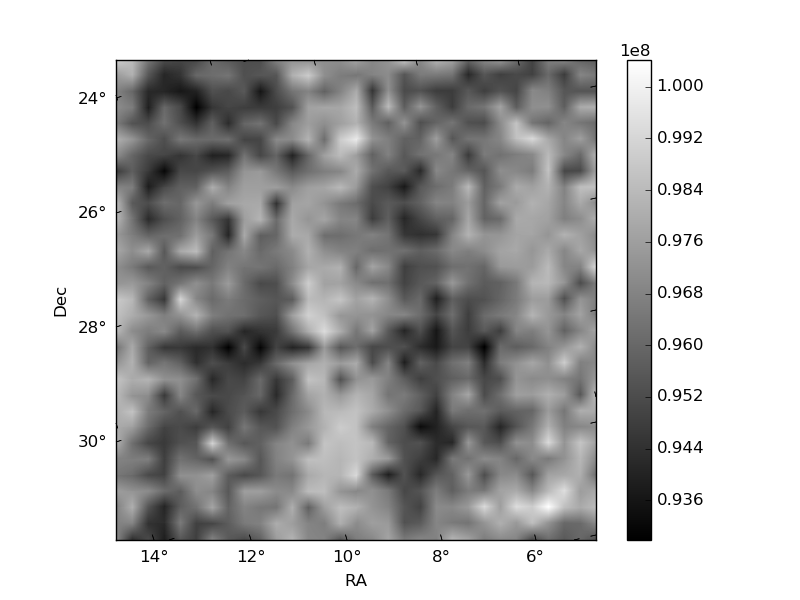
Histogram calculated using DETX and DETY for each event in the final _common_clean file
| Quadrant A | 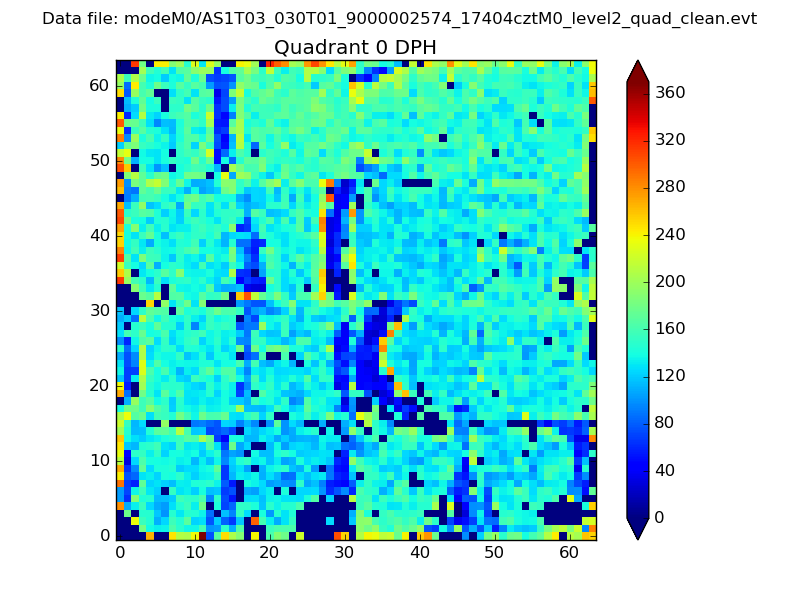 |
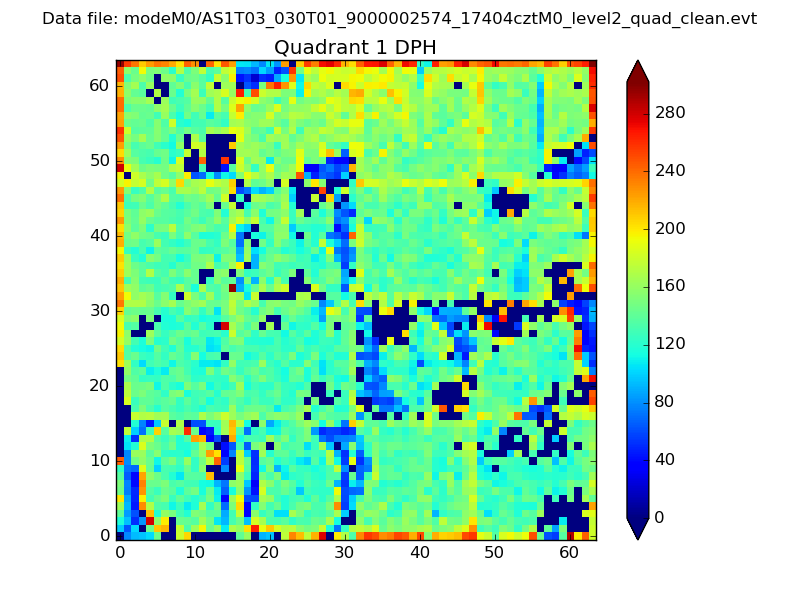 |
Quadrant B |
|---|---|---|---|
| Quadrant D | 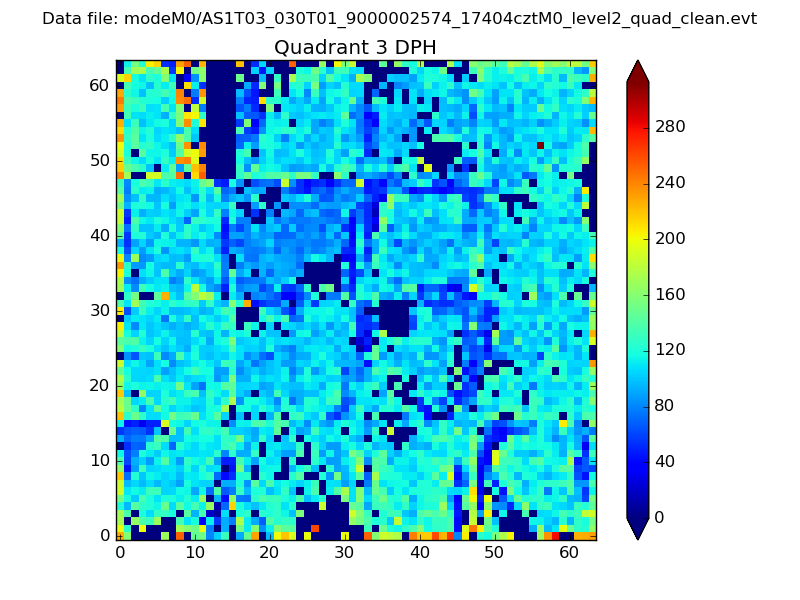 |
 |
Quadrant C |
| Plot type | Count rate plots | Images |
|---|---|---|
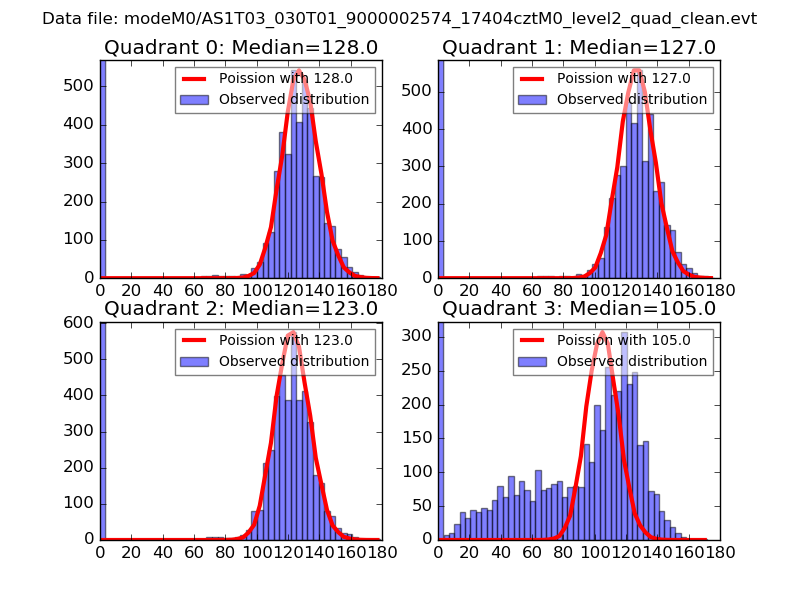
| Comparison with Poisson distribution Blue bars denote a histogram of data divided into 1 sec bins. Red curve is a Poisson curve with rate = median count rate of data. |
 |
 |
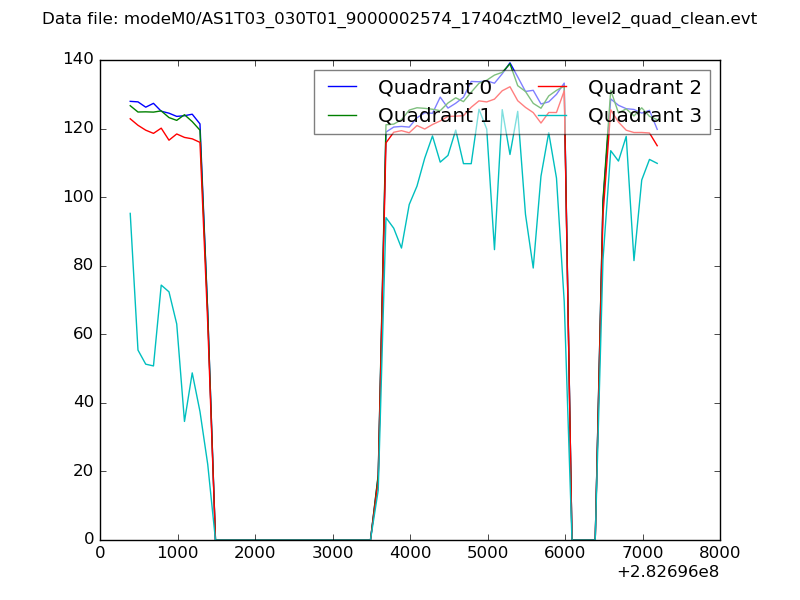
| Quadrant-wise count rates Data is divided into 100 sec bins |
 |
|
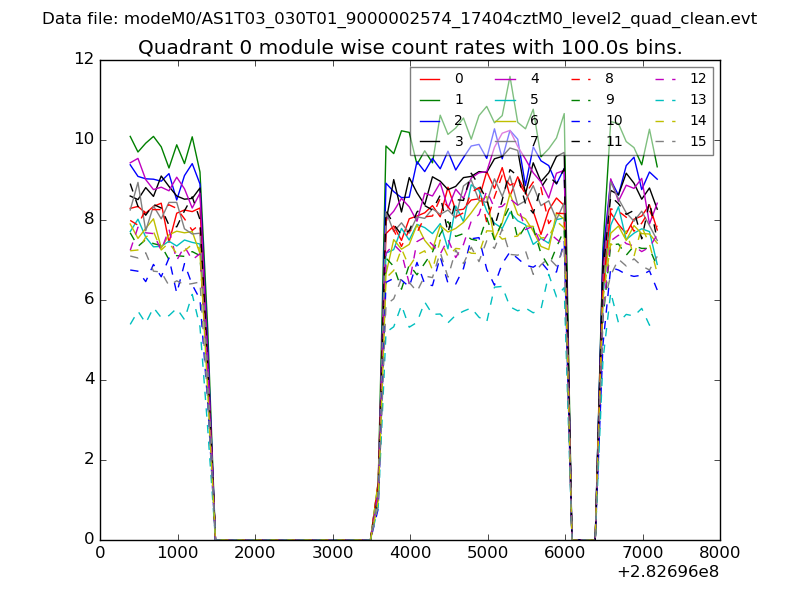
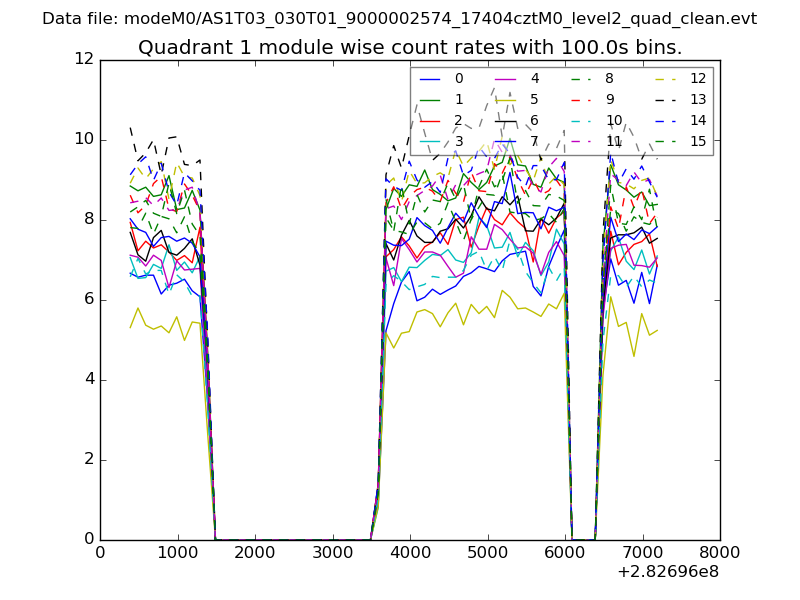
| Module-wise count rates for Quadrant A Data is divided into 100 sec bins |
 |
 |
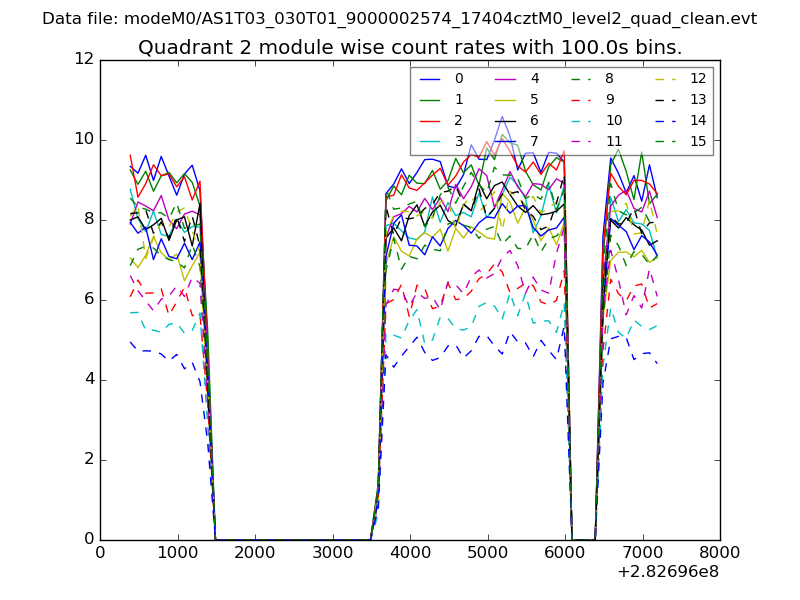
| Module-wise count rates for Quadrant B Data is divided into 100 sec bins |
 |
 |
| Module-wise count rates for Quadrant C Data is divided into 100 sec bins |
 |
 |
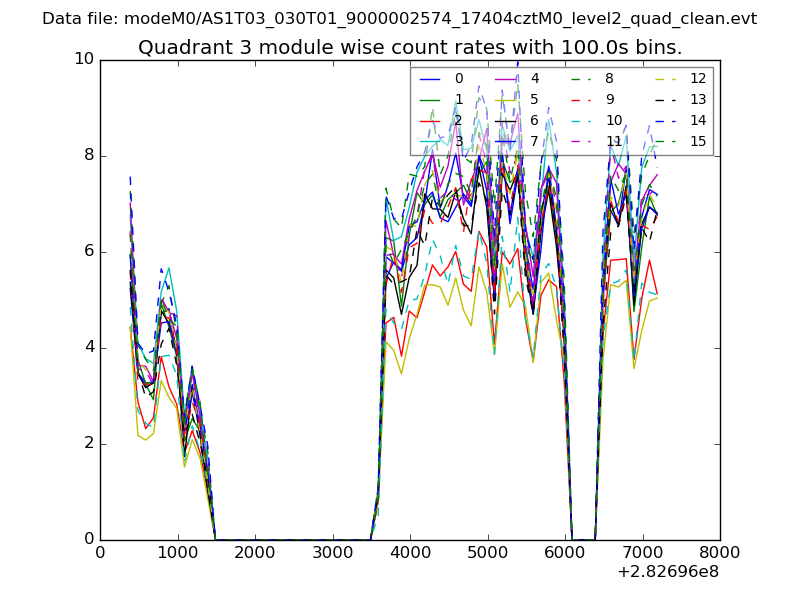
| Module-wise count rates for Quadrant D Data is divided into 100 sec bins |
 |
 |
| Parameter | Plot |
|---|---|
| CZT HV Monitor | 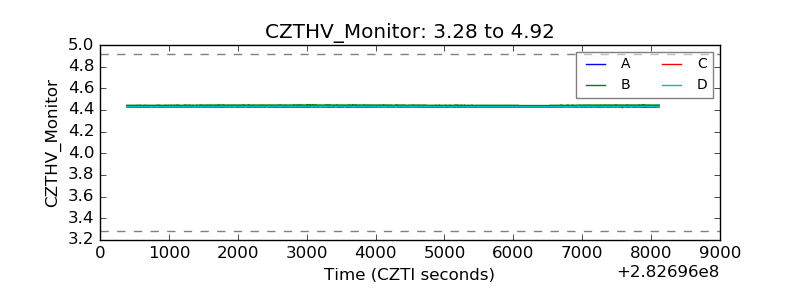 |
| D_VDD | 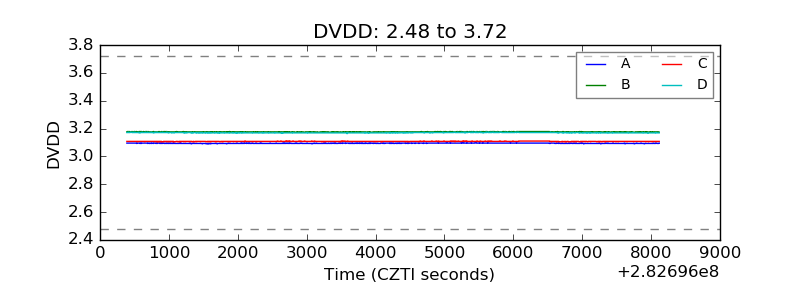 |
| Temperature 1 | 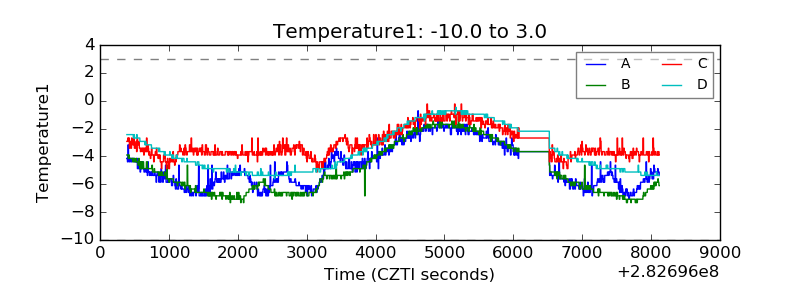 |
| Veto HV Monitor | 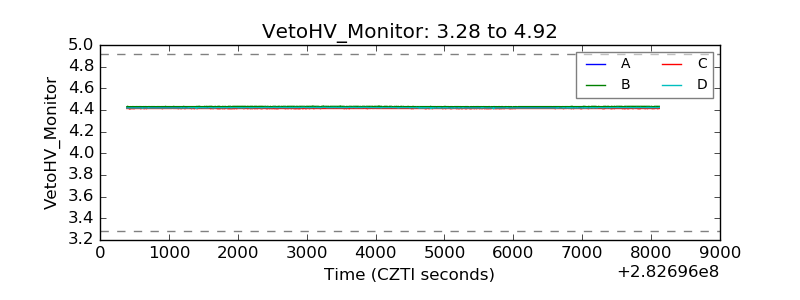 |
| Veto LLD | 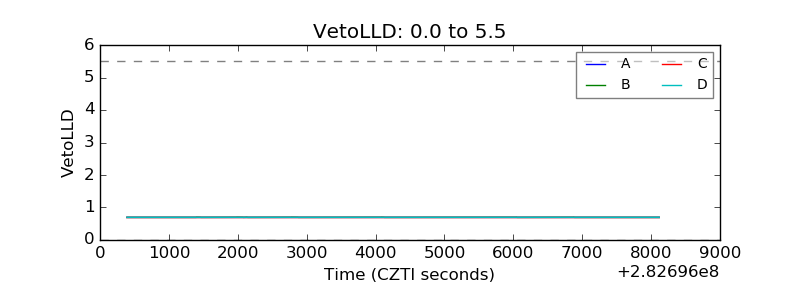 |
| Alpha Counter | 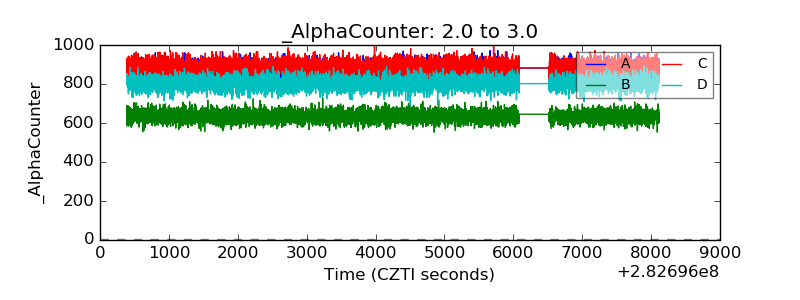 |
| _CPM_Rate | 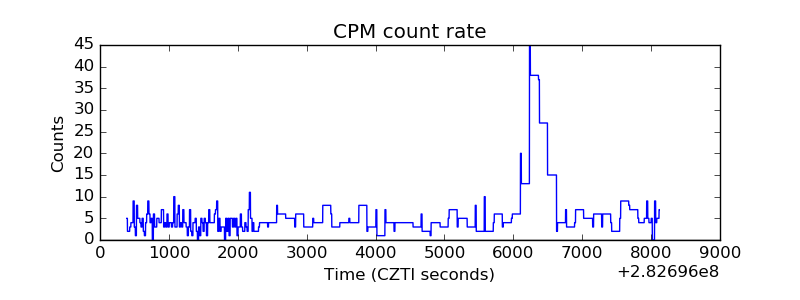 |
| CZT Counter | 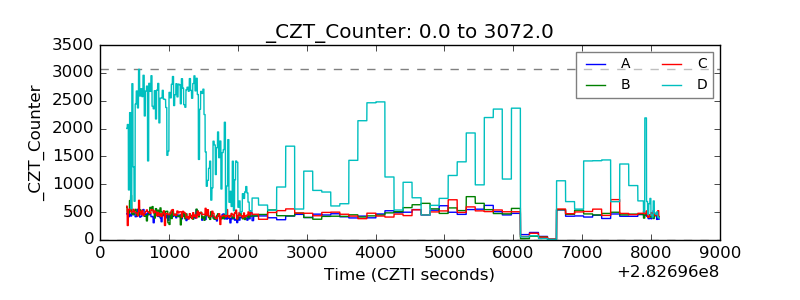 |
| +2.5 Volts monitor |  |
| +5 Volts monitor | 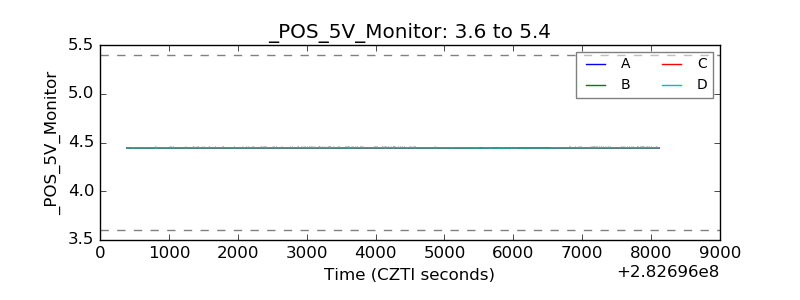 |
| _ROLL_ROT | 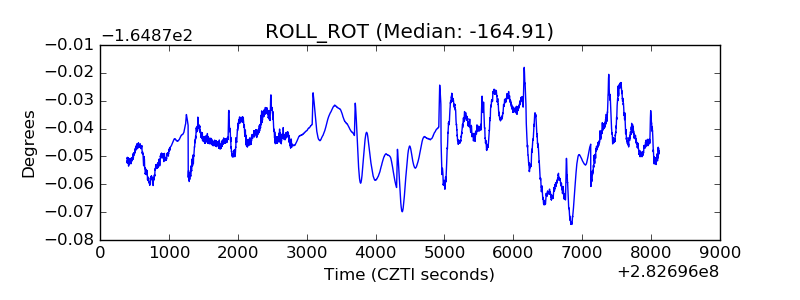 |
| _Roll_DEC | 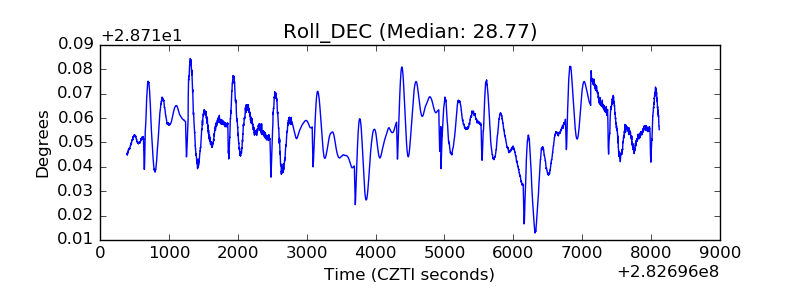 |
| _Roll_RA |  |
| Veto Counter | 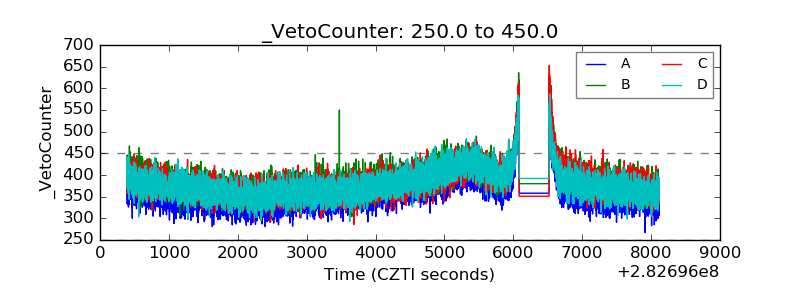 |