| Param | Original file | Final file |
|---|---|---|
| Filename | modeM0/AS1T03_030T01_9000002574_17407cztM0_level2.evt | modeM0/AS1T03_030T01_9000002574_17407cztM0_level2_quad_clean.evt |
| Size (bytes) | 575,317,440 | 84,049,920 |
| Size | 548.7 MB | 80.2 MB |
| Events in quadrant A | 3,609,939 | 516,786 |
| Events in quadrant B | 3,745,330 | 521,798 |
| Events in quadrant C | 3,736,687 | 501,178 |
| Events in quadrant D | 5,814,554 | 474,943 |
| Mode M0 | |||
|---|---|---|---|
| Quadrant | BADHDUFLAG | Total packets | Discarded packets |
| A | 0 | 15583 | 2 |
| B | 0 | 15819 | 2 |
| C | 0 | 15704 | 2 |
| D | 0 | 22397 | 3 |
| Mode SS | |||
|---|---|---|---|
| Quadrant | BADHDUFLAG | Total packets | Discarded packets |
| A | 0 | 156 | 0 |
| B | 0 | 156 | 0 |
| C | 0 | 156 | 0 |
| D | 0 | 156 | 0 |
| Mode M9 | |||
|---|---|---|---|
| Quadrant | BADHDUFLAG | Total packets | Discarded packets |
| A | 0 | 17 | 0 |
| B | 0 | 17 | 0 |
| C | 0 | 17 | 0 |
| D | 0 | 17 | 0 |
| Quadrant | Total seconds | Saturated seconds | Saturation percentage |
|---|---|---|---|
| A | 7623 | 61 | 0.800210% |
| B | 7624 | 93 | 1.219832% |
| C | 7624 | 107 | 1.403463% |
| D | 7623 | 498 | 6.532861% |
Noise dominated data is calculated using 1-second bins in cleaned event files. If a bin has >2000 counts, and if more than 50% of those come from <1% of pixels, then it is considered to be noise-dominated and hence unusable.
| Quadrant | # 1 sec bins | Bins with >0 counts | Bins with >2000 counts | High rate bins dominated by noise | Noise dominated (total time) | Noise dominated (detector-on time) | Marked lightcurve |
|---|---|---|---|---|---|---|---|
| A | 9318 | 7625 | 0 | 0 | 0.00% | 0.00% | 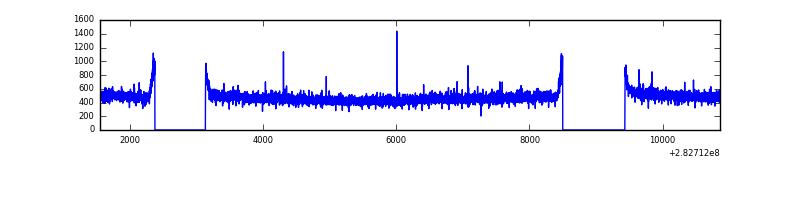 |
| B | 9319 | 7626 | 2 | 2 | 0.02% | 0.03% | 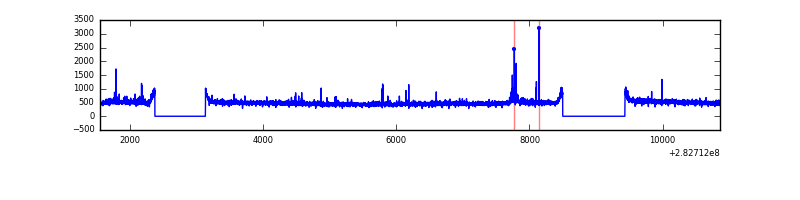 |
| C | 9319 | 7625 | 0 | 0 | 0.00% | 0.00% | 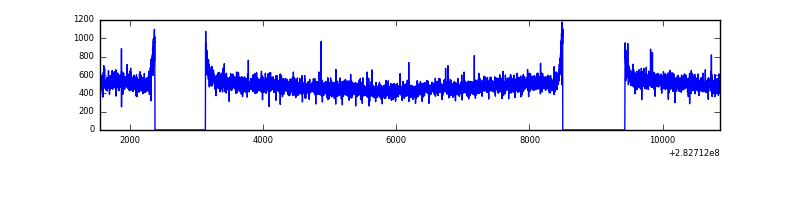 |
| D | 9318 | 7624 | 388 | 388 | 4.16% | 5.09% | 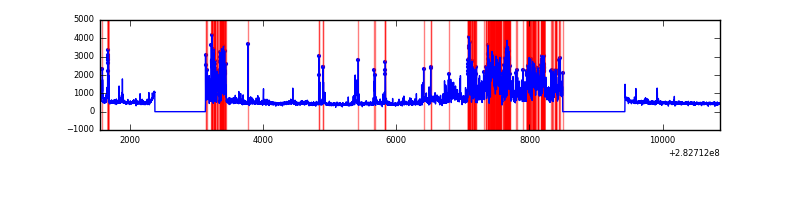 |
Top three noisy pixels from each quadrant. If the there are fewer than three noisy pixels in the level2.evt file, extra rows are filled as -1
| Pixel properties | Quadrant properties | ||||||
|---|---|---|---|---|---|---|---|
| Quadrant | DetID | PixID | Counts | Sigma | Mean | Median | Sigma |
| A | 0 | 226 | 8249 | 38.61 | 938 | 918 | 189.9 |
| A | 3 | 137 | 7091 | 32.51 | 938 | 918 | 189.9 |
| A | 12 | 194 | 6883 | 31.41 | 938 | 918 | 189.9 |
| B | 0 | 197 | 25461 | 135.13 | 941 | 914 | 181.7 |
| B | 12 | 111 | 22054 | 116.37 | 941 | 914 | 181.7 |
| B | 11 | 111 | 18924 | 99.14 | 941 | 914 | 181.7 |
| C | 14 | 238 | 138325 | 649.44 | 901 | 908 | 211.6 |
| C | 5 | 218 | 40845 | 188.74 | 901 | 908 | 211.6 |
| C | 3 | 233 | 39833 | 183.96 | 901 | 908 | 211.6 |
| D | 11 | 176 | 1541874 | 7056.92 | 895 | 869 | 218.4 |
| D | 10 | 70 | 282997 | 1291.98 | 895 | 869 | 218.4 |
| D | 1 | 52 | 243654 | 1111.82 | 895 | 869 | 218.4 |
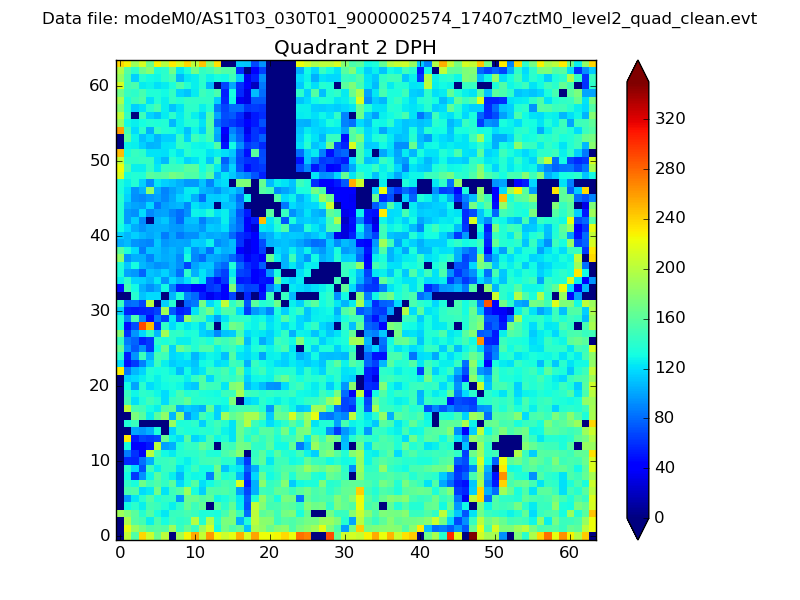
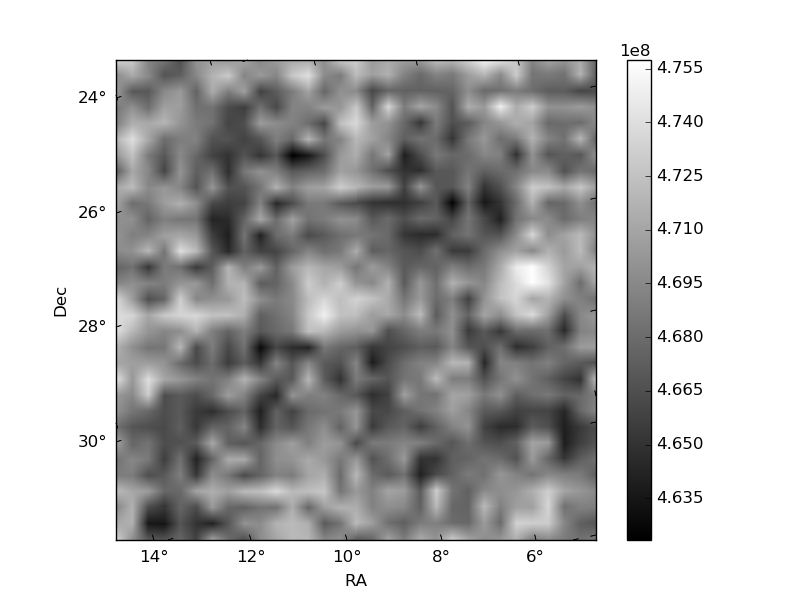
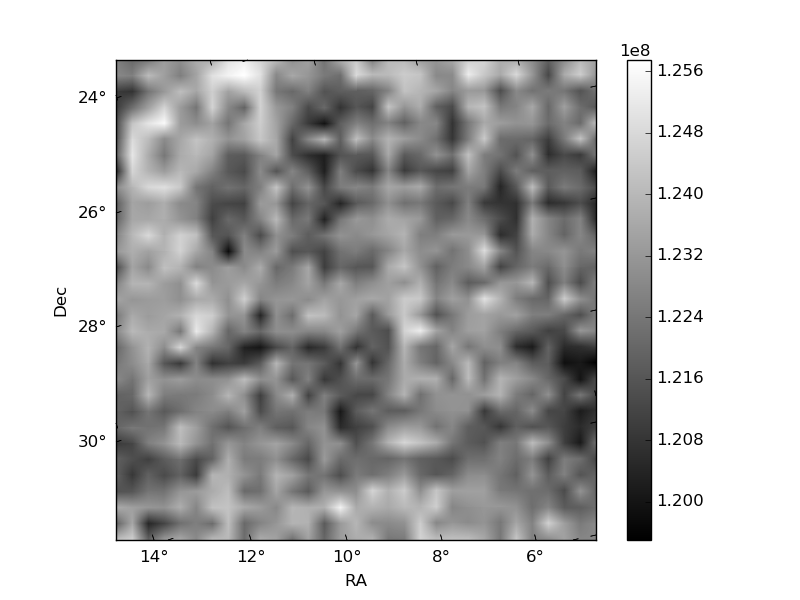
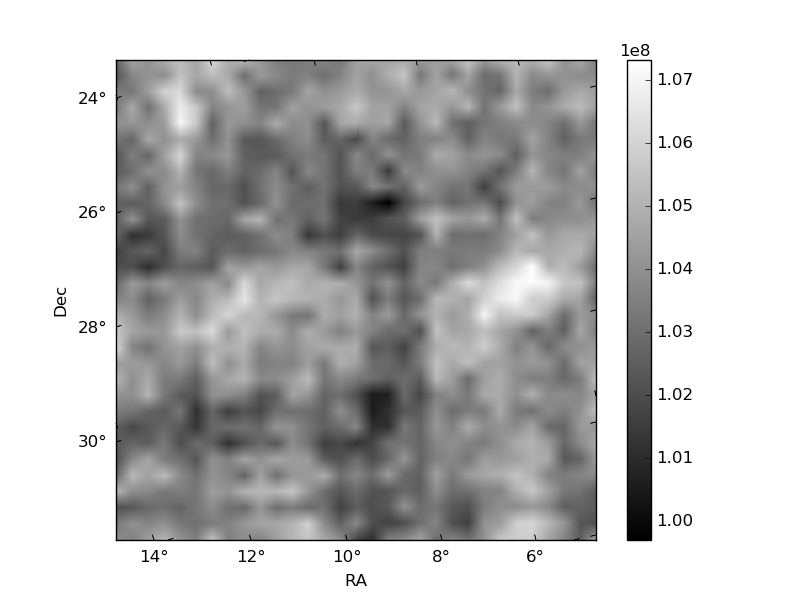
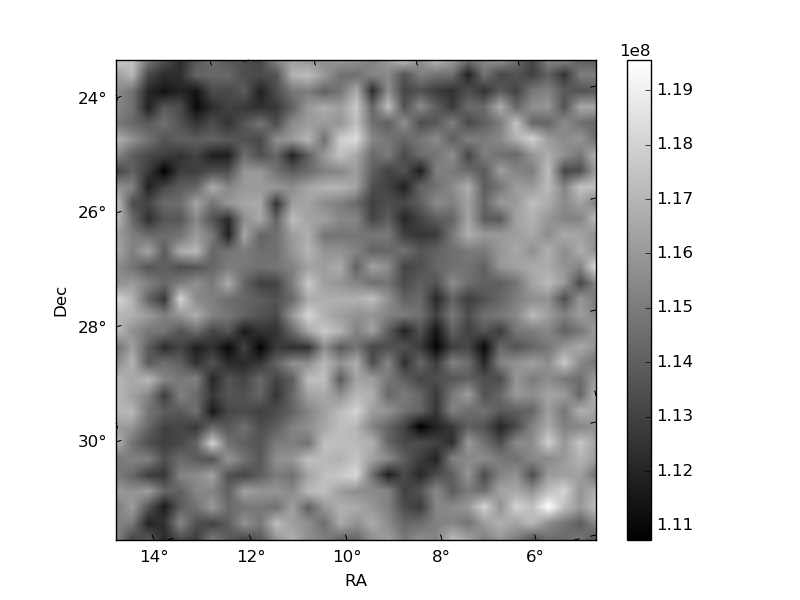
Histogram calculated using DETX and DETY for each event in the final _common_clean file
| Quadrant A | 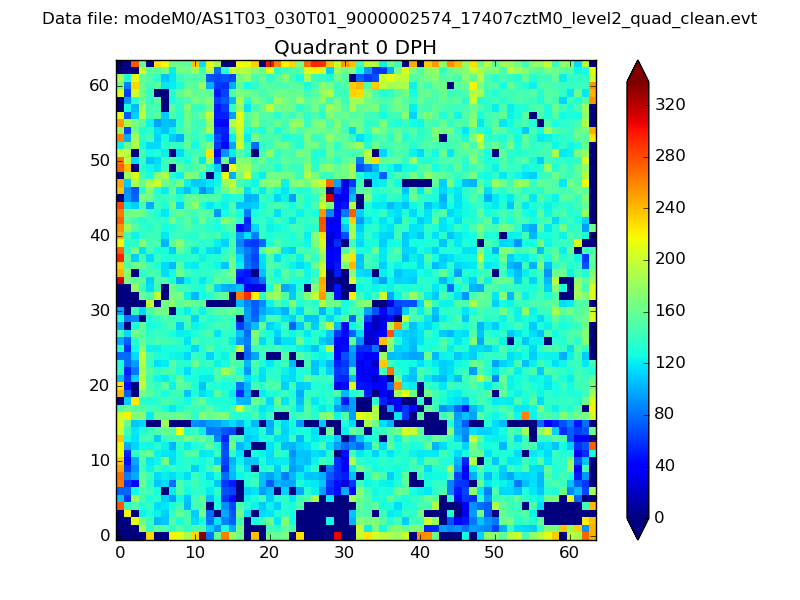 |
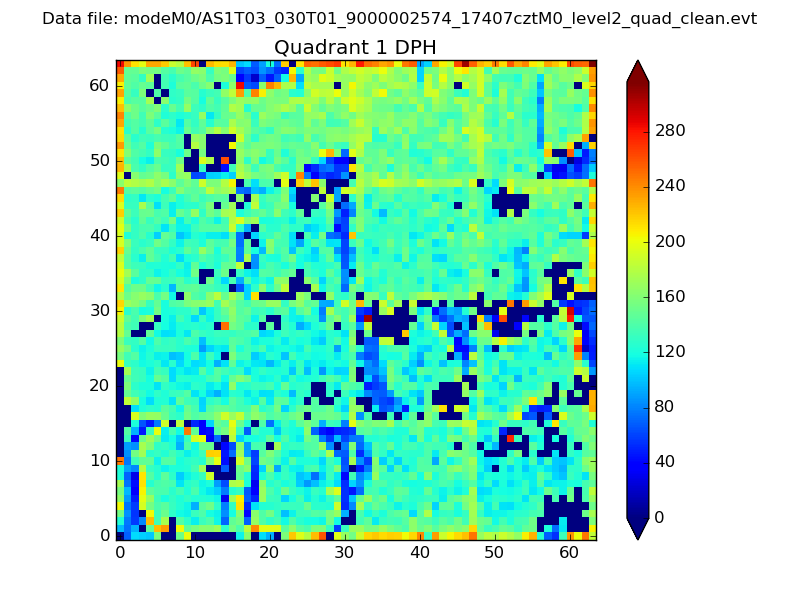 |
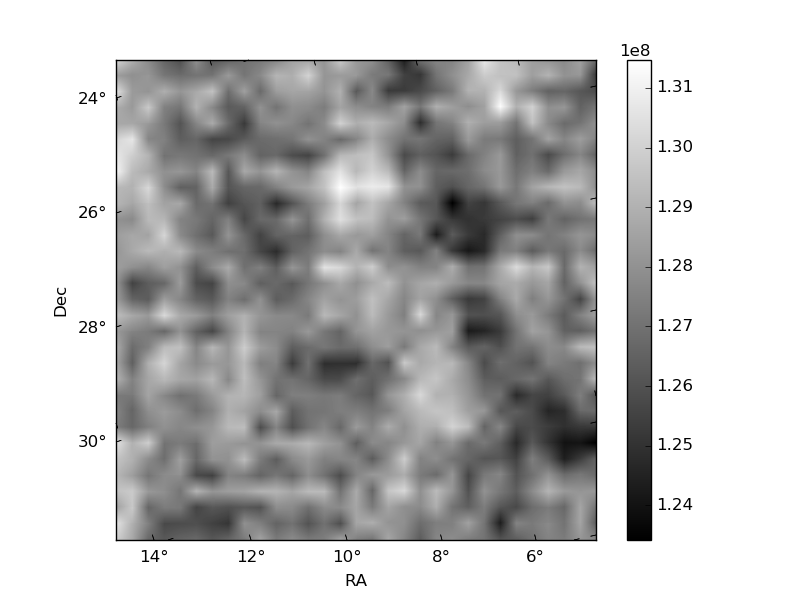
Quadrant B |
|---|---|---|---|
| Quadrant D | 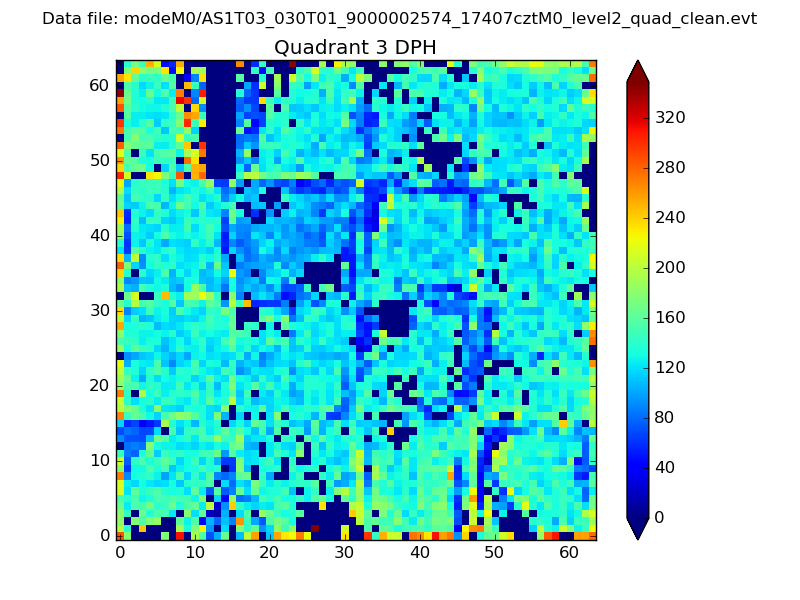 |
 |
Quadrant C |
| Plot type | Count rate plots | Images |
|---|---|---|
| Comparison with Poisson distribution Blue bars denote a histogram of data divided into 1 sec bins. Red curve is a Poisson curve with rate = median count rate of data. |
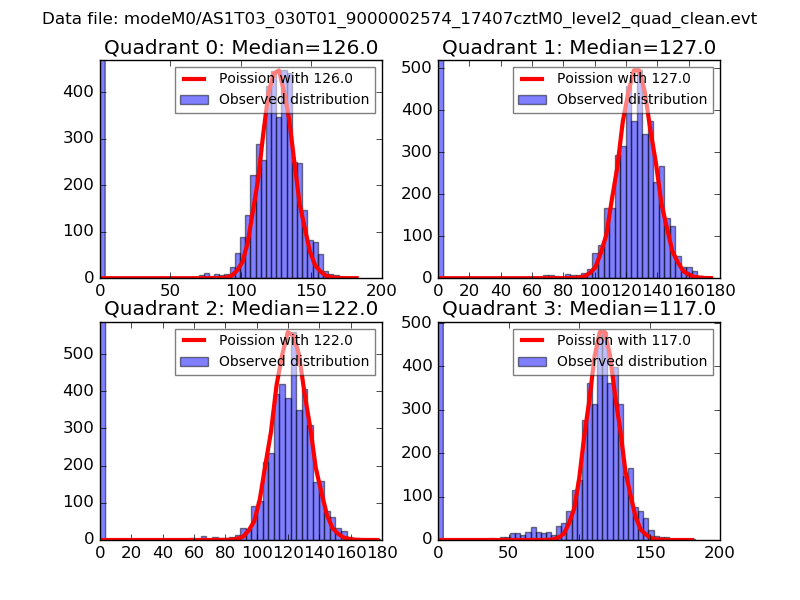 |
 |
| Quadrant-wise count rates Data is divided into 100 sec bins |
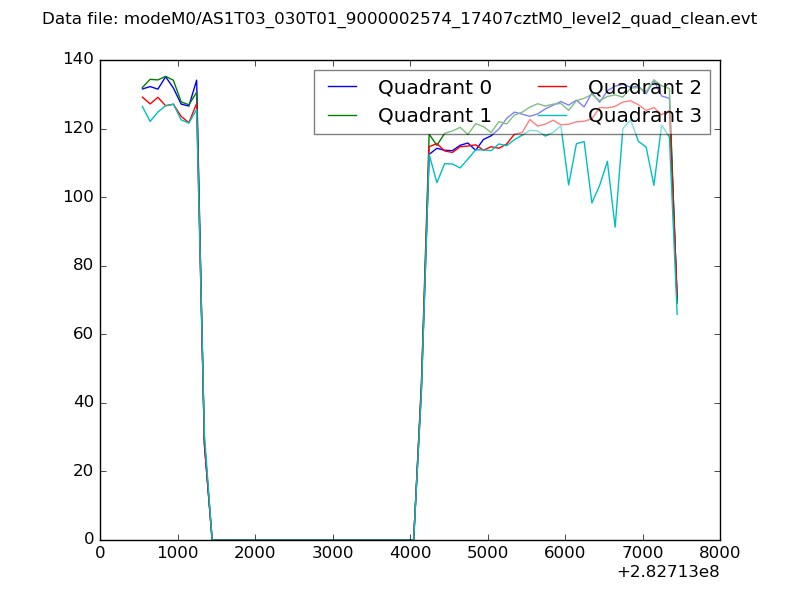 |
|
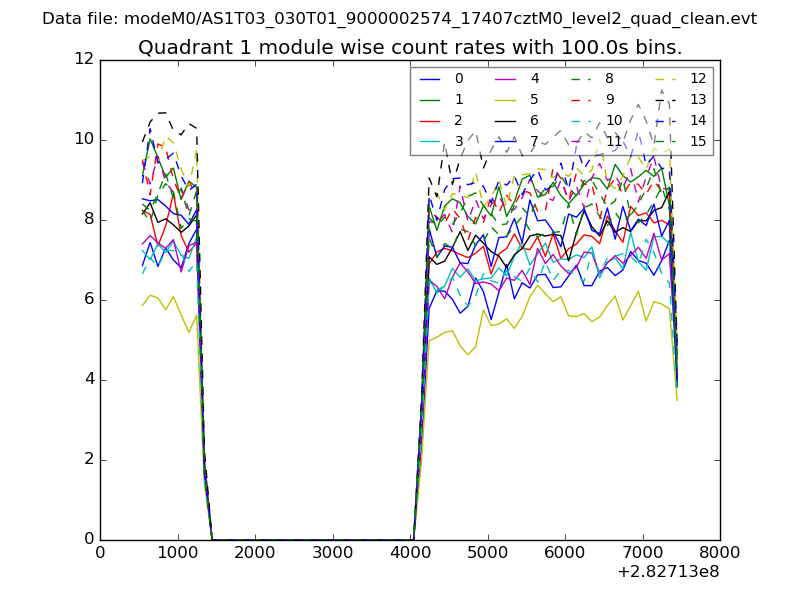
| Module-wise count rates for Quadrant A Data is divided into 100 sec bins |
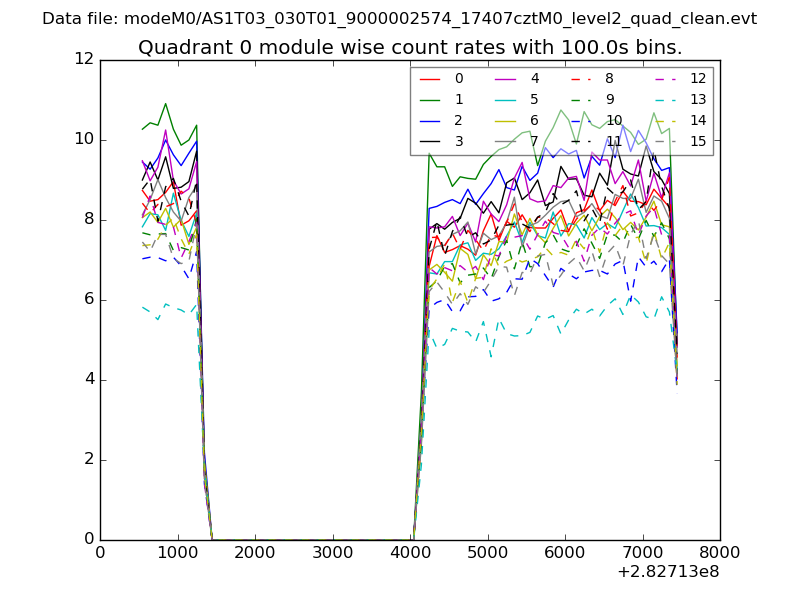 |
 |
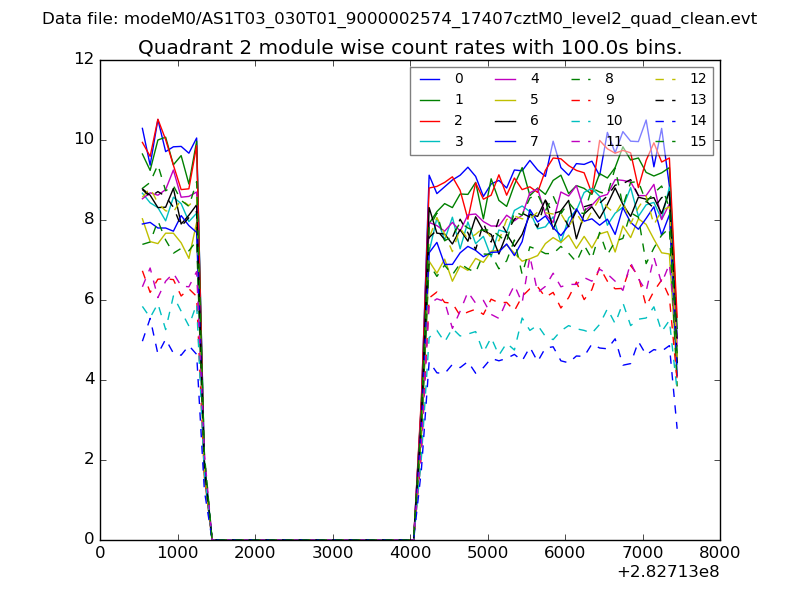
| Module-wise count rates for Quadrant B Data is divided into 100 sec bins |
 |
 |
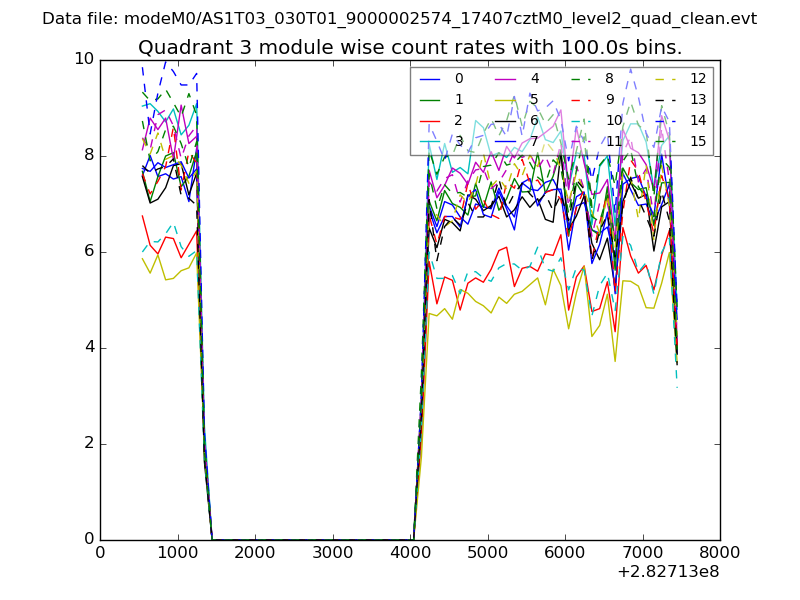
| Module-wise count rates for Quadrant C Data is divided into 100 sec bins |
 |
 |
| Module-wise count rates for Quadrant D Data is divided into 100 sec bins |
 |
 |
| Parameter | Plot |
|---|---|
| CZT HV Monitor | 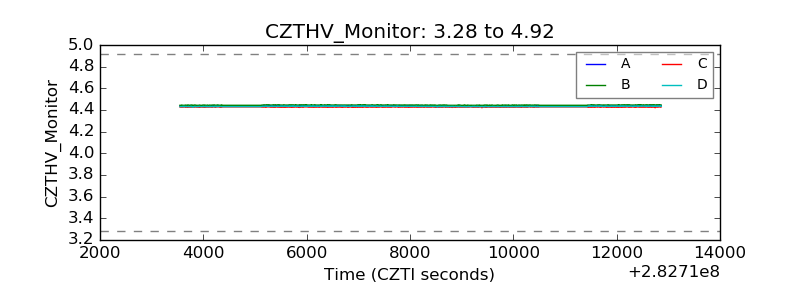 |
| D_VDD | 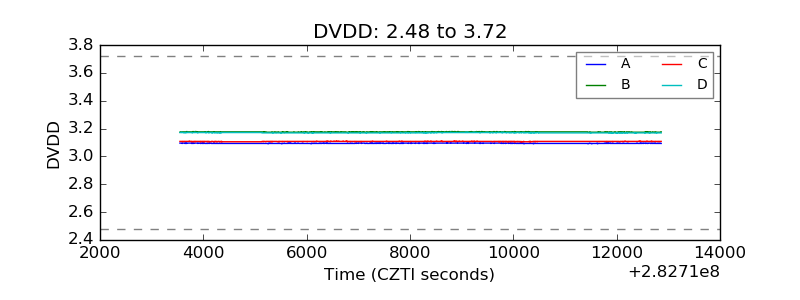 |
| Temperature 1 | 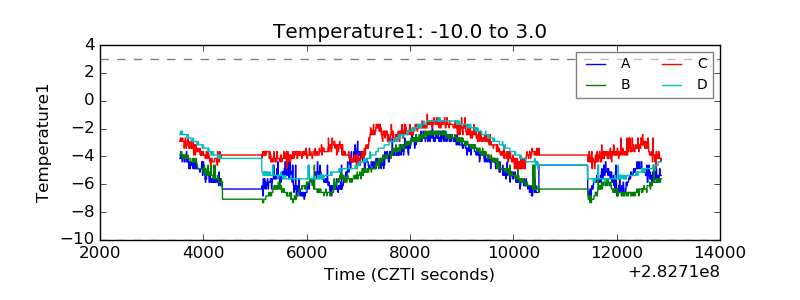 |
| Veto HV Monitor | 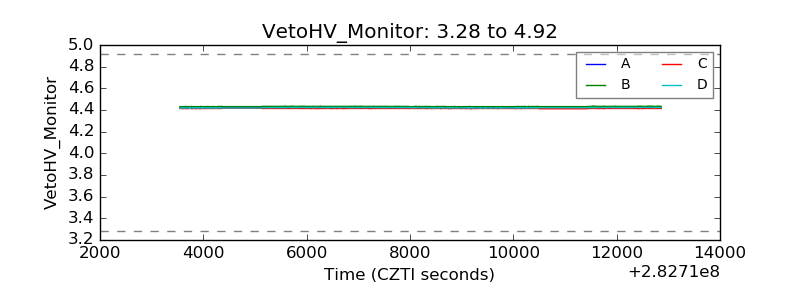 |
| Veto LLD | 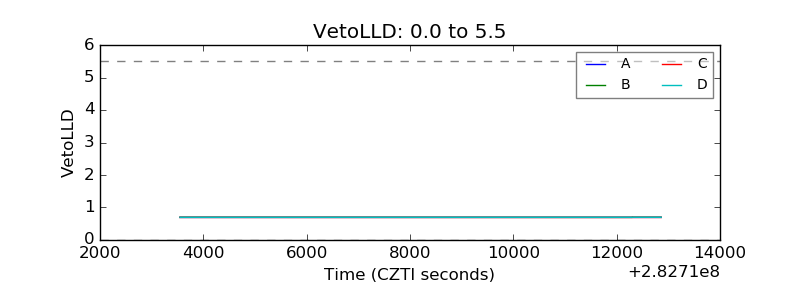 |
| Alpha Counter | 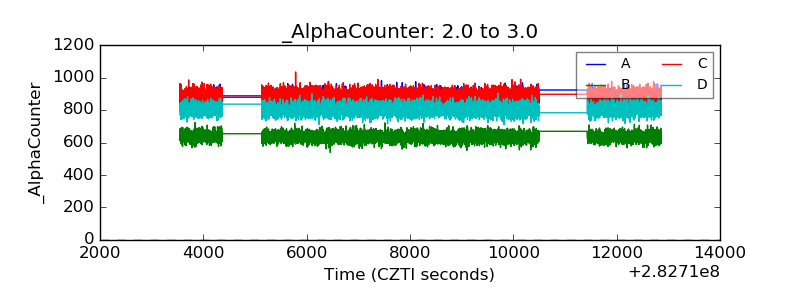 |
| _CPM_Rate | 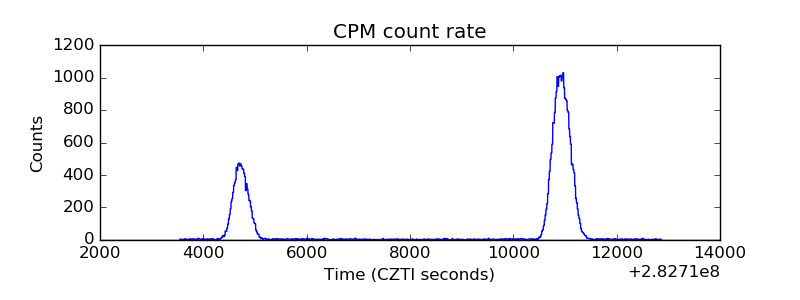 |
| CZT Counter | 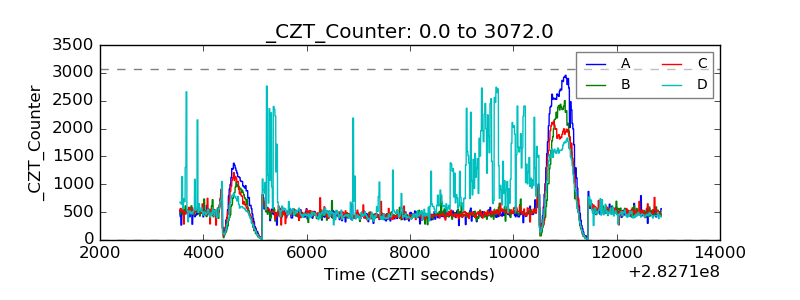 |
| +2.5 Volts monitor |  |
| +5 Volts monitor |  |
| _ROLL_ROT | 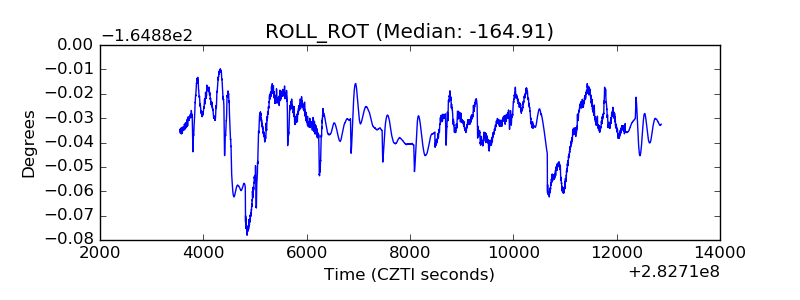 |
| _Roll_DEC | 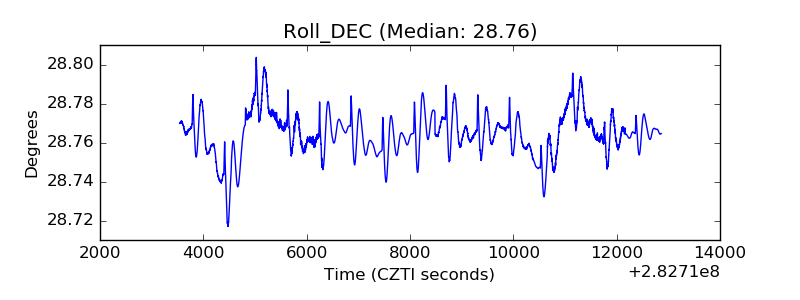 |
| _Roll_RA | 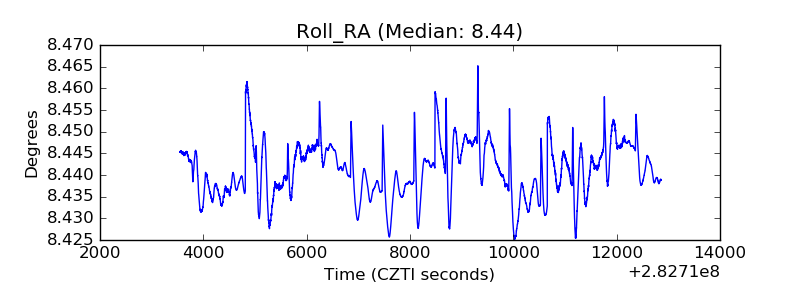 |
| Veto Counter | 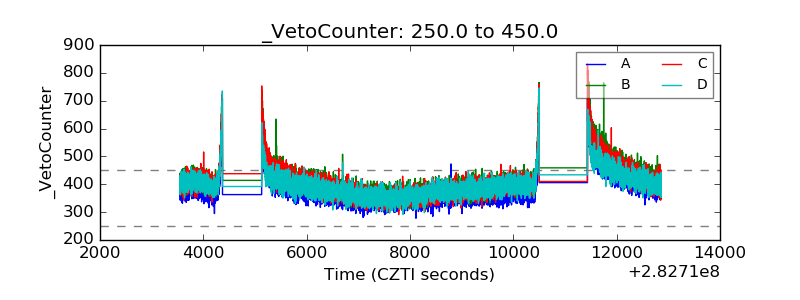 |