| Param | Original file | Final file |
|---|---|---|
| Filename | modeM0/AS1T03_030T01_9000002574_17410cztM0_level2.evt | modeM0/AS1T03_030T01_9000002574_17410cztM0_level2_quad_clean.evt |
| Size (bytes) | 473,284,800 | 88,050,240 |
| Size | 451.4 MB | 84.0 MB |
| Events in quadrant A | 3,282,424 | 569,959 |
| Events in quadrant B | 3,354,615 | 575,108 |
| Events in quadrant C | 3,422,249 | 541,617 |
| Events in quadrant D | 3,840,256 | 534,022 |
| Mode M0 | |||
|---|---|---|---|
| Quadrant | BADHDUFLAG | Total packets | Discarded packets |
| A | 0 | 13832 | 2 |
| B | 0 | 14014 | 2 |
| C | 0 | 14008 | 2 |
| D | 0 | 15603 | 2 |
| Mode SS | |||
|---|---|---|---|
| Quadrant | BADHDUFLAG | Total packets | Discarded packets |
| A | 0 | 130 | 0 |
| B | 0 | 130 | 0 |
| C | 0 | 130 | 0 |
| D | 0 | 130 | 0 |
| Mode M9 | |||
|---|---|---|---|
| Quadrant | BADHDUFLAG | Total packets | Discarded packets |
| A | 0 | 23 | 0 |
| B | 0 | 23 | 0 |
| C | 0 | 23 | 0 |
| D | 0 | 23 | 0 |
| Quadrant | Total seconds | Saturated seconds | Saturation percentage |
|---|---|---|---|
| A | 6393 | 112 | 1.751916% |
| B | 6394 | 128 | 2.001877% |
| C | 6394 | 155 | 2.424148% |
| D | 6394 | 141 | 2.205192% |
Noise dominated data is calculated using 1-second bins in cleaned event files. If a bin has >2000 counts, and if more than 50% of those come from <1% of pixels, then it is considered to be noise-dominated and hence unusable.
| Quadrant | # 1 sec bins | Bins with >0 counts | Bins with >2000 counts | High rate bins dominated by noise | Noise dominated (total time) | Noise dominated (detector-on time) | Marked lightcurve |
|---|---|---|---|---|---|---|---|
| A | 8653 | 6393 | 0 | 0 | 0.00% | 0.00% | 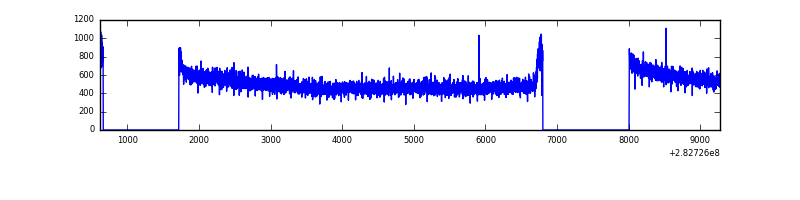 |
| B | 8654 | 6394 | 0 | 0 | 0.00% | 0.00% | 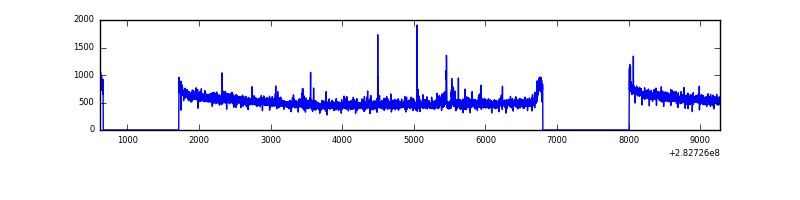 |
| C | 8654 | 6394 | 0 | 0 | 0.00% | 0.00% | 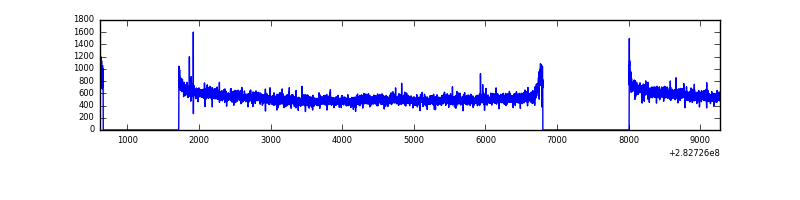 |
| D | 8654 | 6394 | 44 | 44 | 0.51% | 0.69% |  |
Top three noisy pixels from each quadrant. If the there are fewer than three noisy pixels in the level2.evt file, extra rows are filled as -1
| Pixel properties | Quadrant properties | ||||||
|---|---|---|---|---|---|---|---|
| Quadrant | DetID | PixID | Counts | Sigma | Mean | Median | Sigma |
| A | 0 | 226 | 7371 | 38.06 | 854 | 839 | 171.6 |
| A | 12 | 194 | 6264 | 31.61 | 854 | 839 | 171.6 |
| A | 3 | 137 | 6046 | 30.34 | 854 | 839 | 171.6 |
| B | 15 | 19 | 19232 | 116.21 | 847 | 830 | 158.4 |
| B | 12 | 111 | 18743 | 113.12 | 847 | 830 | 158.4 |
| B | 11 | 111 | 16584 | 99.49 | 847 | 830 | 158.4 |
| C | 14 | 238 | 125274 | 672.23 | 799 | 805 | 185.2 |
| C | 3 | 233 | 93780 | 502.14 | 799 | 805 | 185.2 |
| C | 5 | 218 | 64772 | 345.47 | 799 | 805 | 185.2 |
| D | 13 | 232 | 377304 | 1925.65 | 813 | 791 | 195.5 |
| D | 11 | 176 | 114120 | 579.61 | 813 | 791 | 195.5 |
| D | 10 | 70 | 100343 | 509.15 | 813 | 791 | 195.5 |
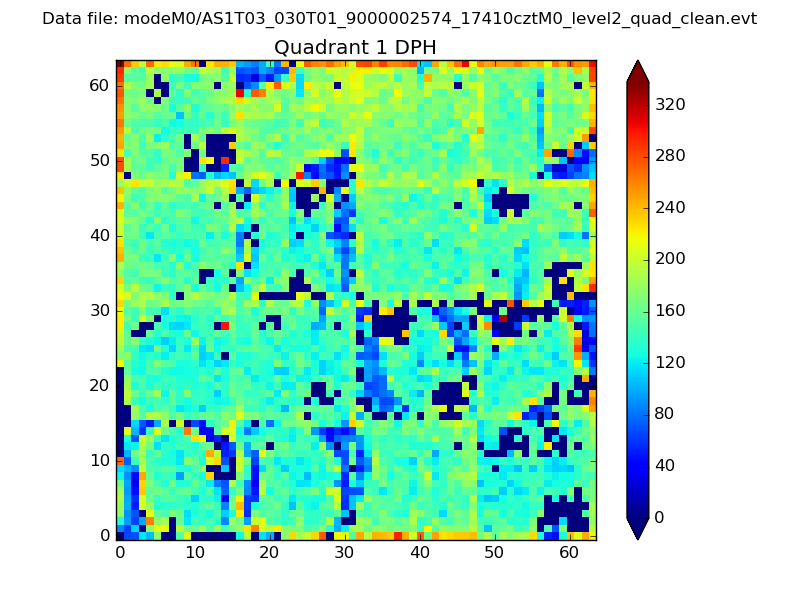
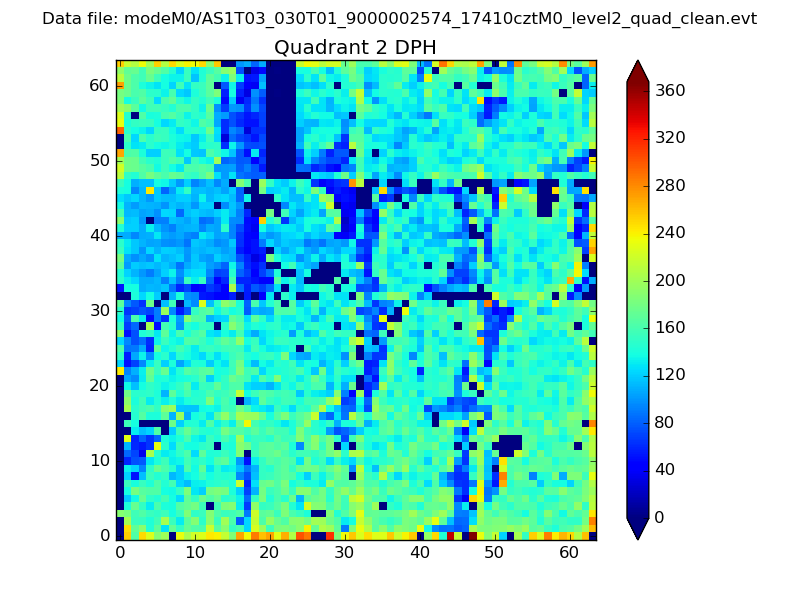
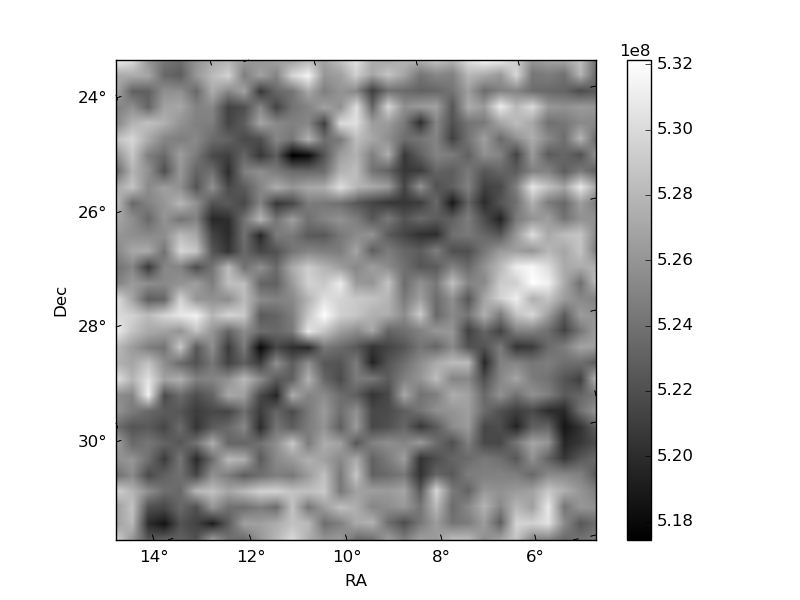
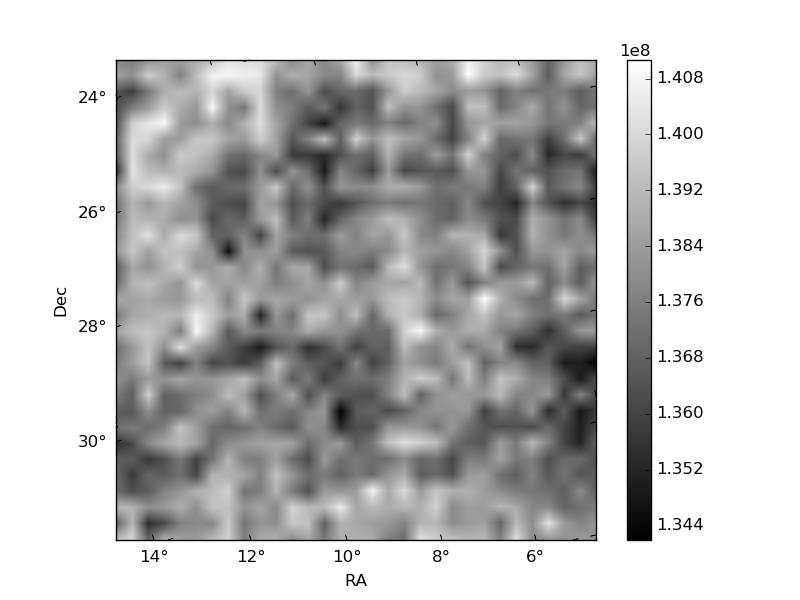
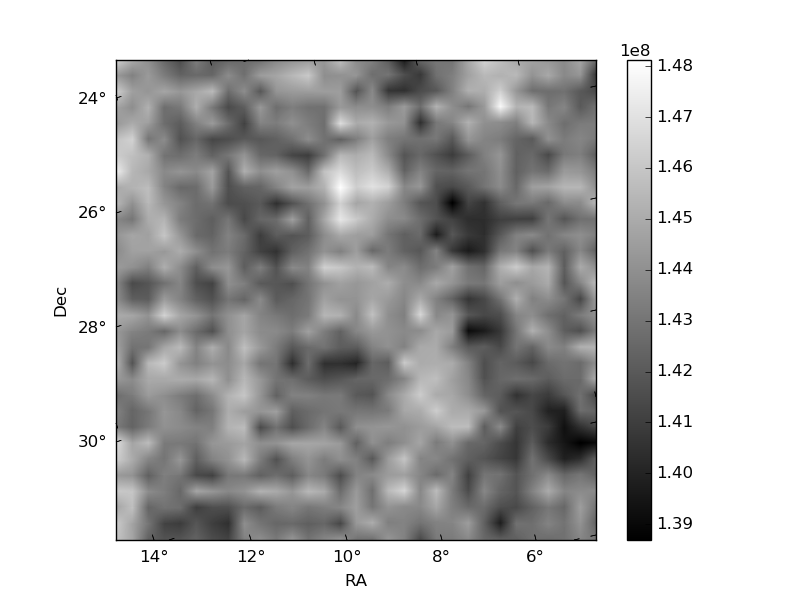
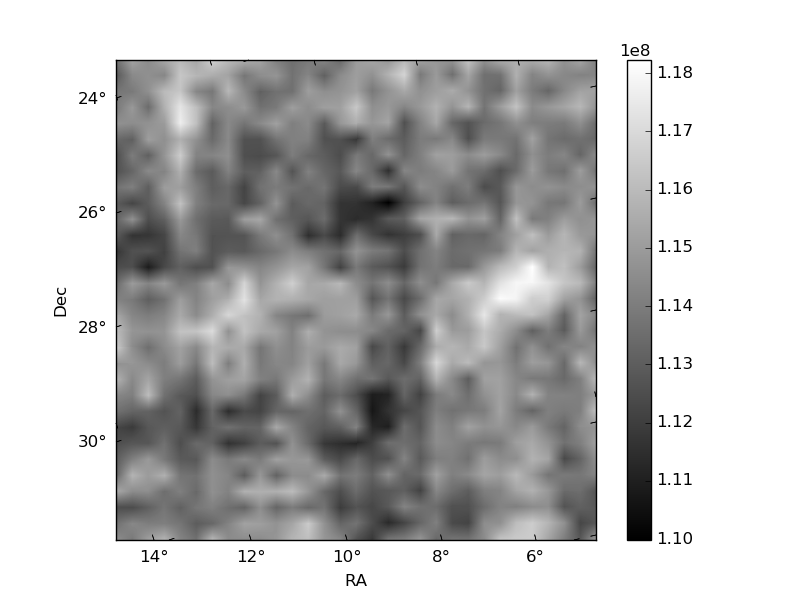
Histogram calculated using DETX and DETY for each event in the final _common_clean file
| Quadrant A | 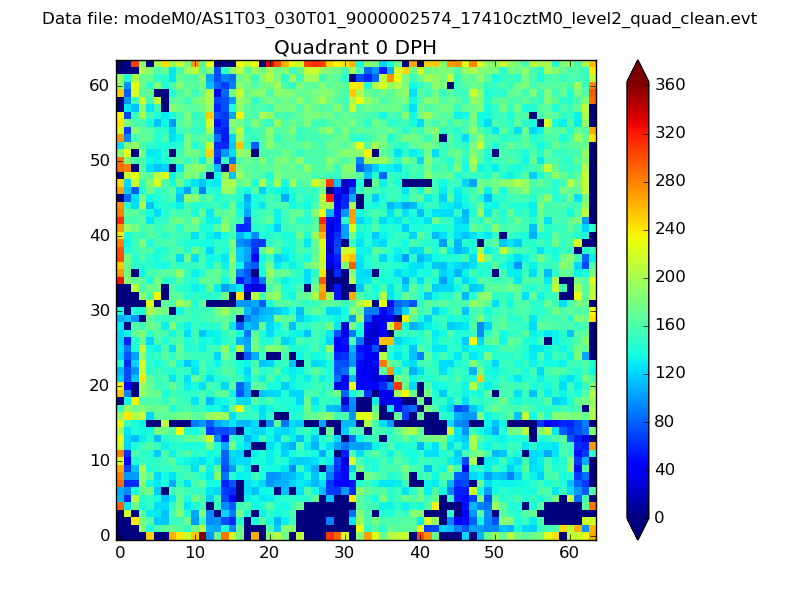 |
 |
Quadrant B |
|---|---|---|---|
| Quadrant D | 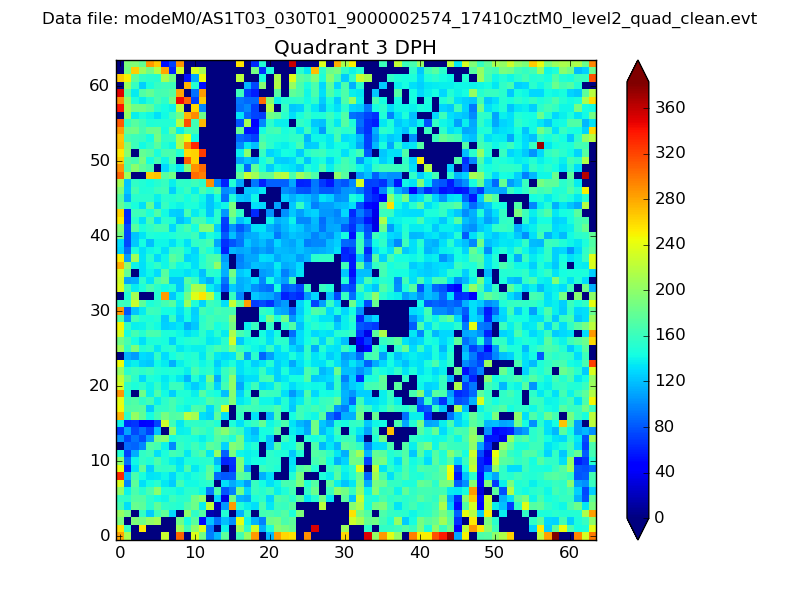 |
 |
Quadrant C |
| Plot type | Count rate plots | Images |
|---|---|---|
| Comparison with Poisson distribution Blue bars denote a histogram of data divided into 1 sec bins. Red curve is a Poisson curve with rate = median count rate of data. |
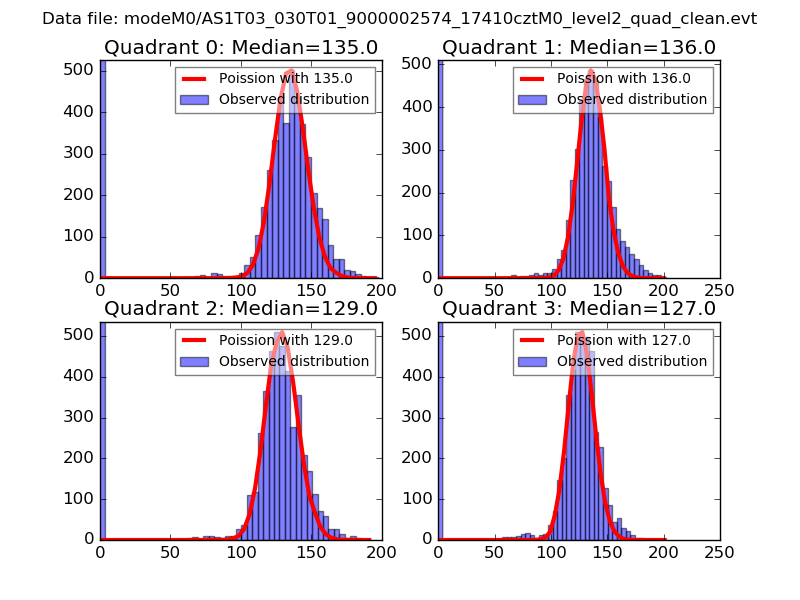 |
 |
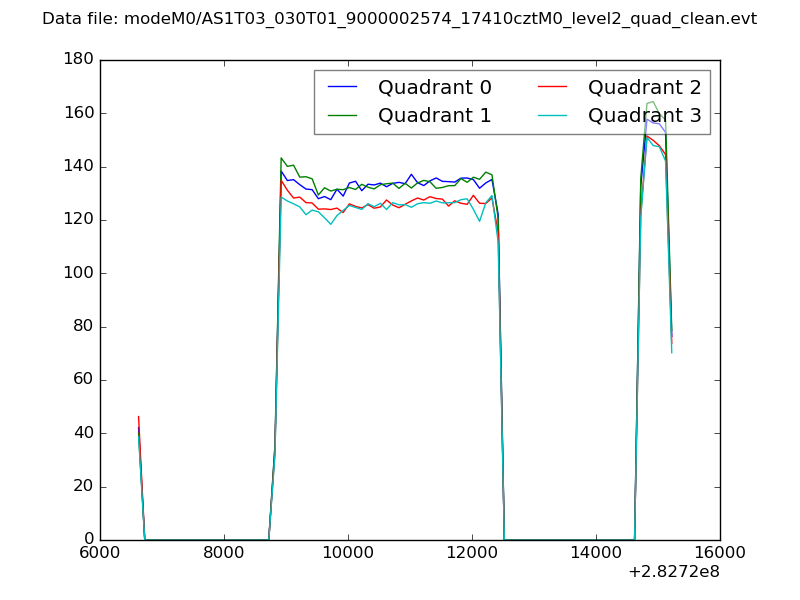
| Quadrant-wise count rates Data is divided into 100 sec bins |
 |
|
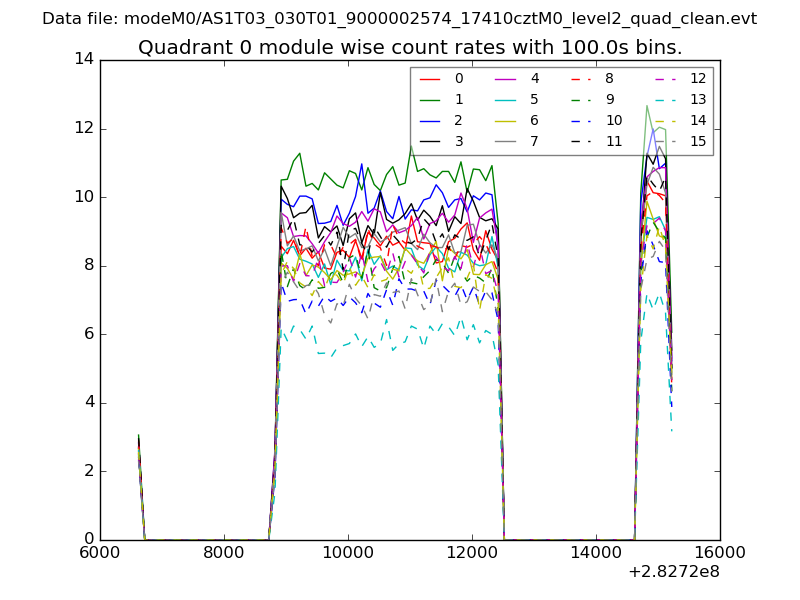
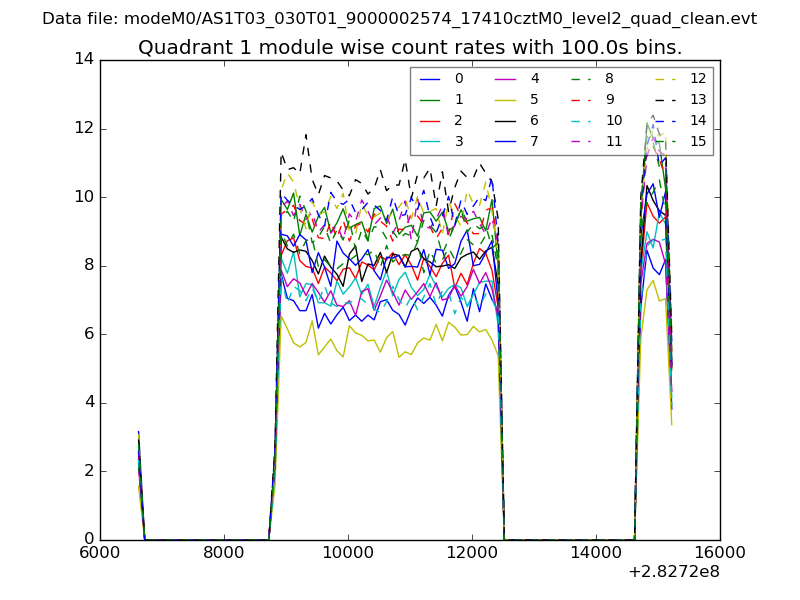
| Module-wise count rates for Quadrant A Data is divided into 100 sec bins |
 |
 |
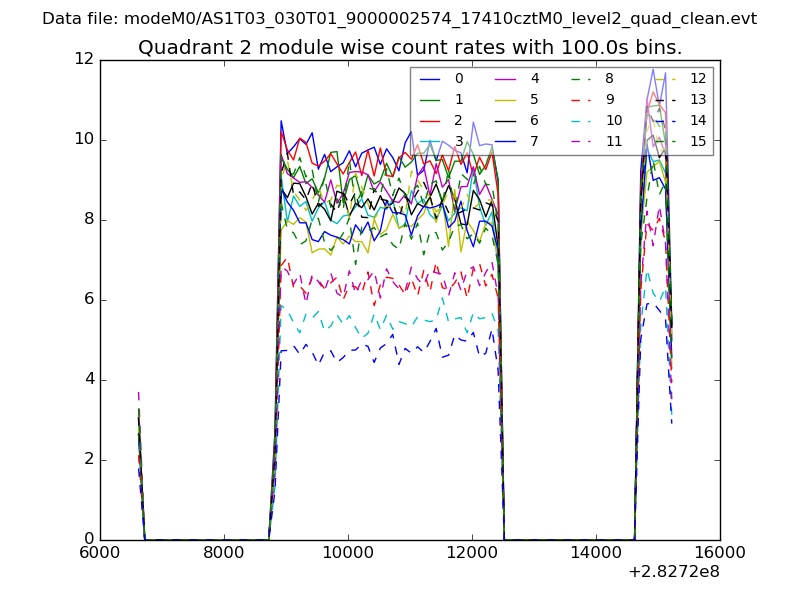
| Module-wise count rates for Quadrant B Data is divided into 100 sec bins |
 |
 |
| Module-wise count rates for Quadrant C Data is divided into 100 sec bins |
 |
 |
| Module-wise count rates for Quadrant D Data is divided into 100 sec bins |
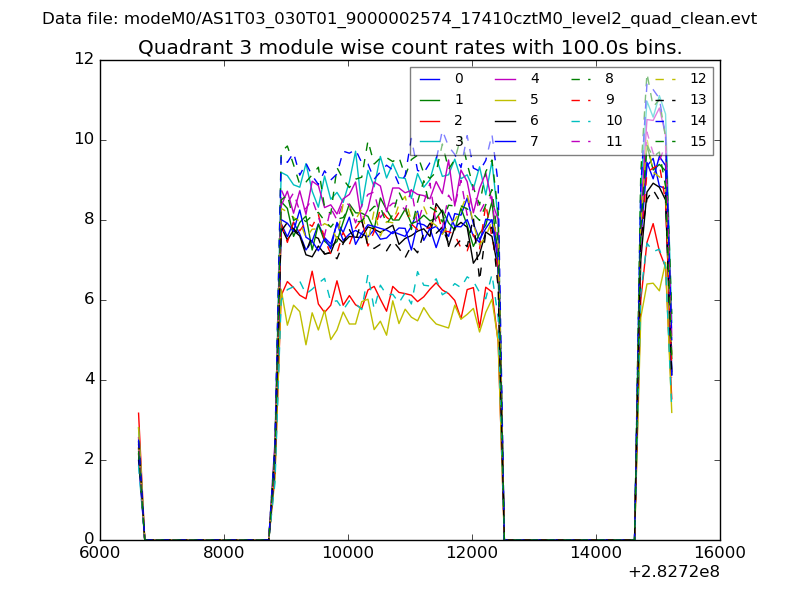 |
 |
| Parameter | Plot |
|---|---|
| CZT HV Monitor | 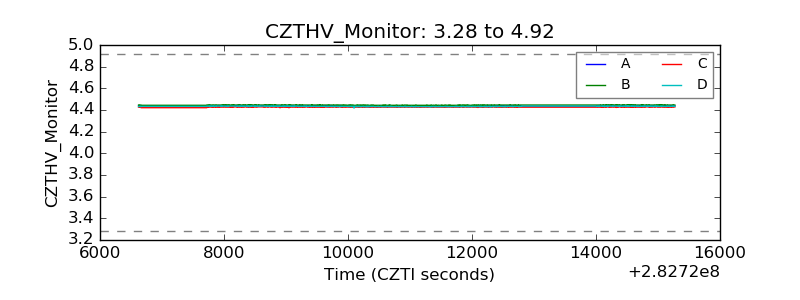 |
| D_VDD |  |
| Temperature 1 | 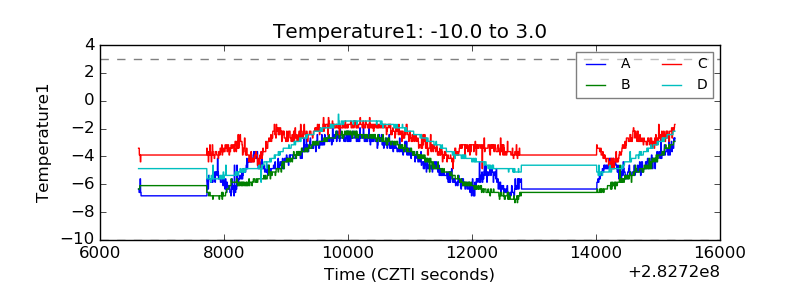 |
| Veto HV Monitor | 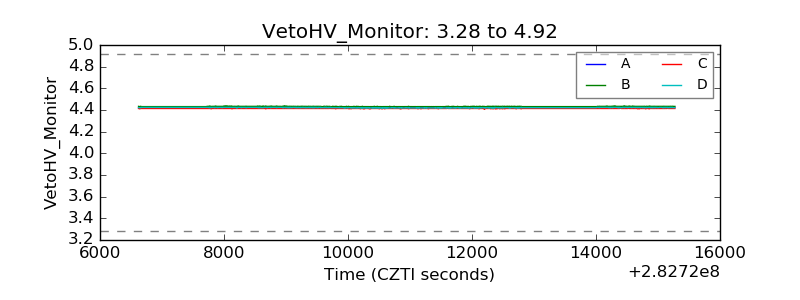 |
| Veto LLD | 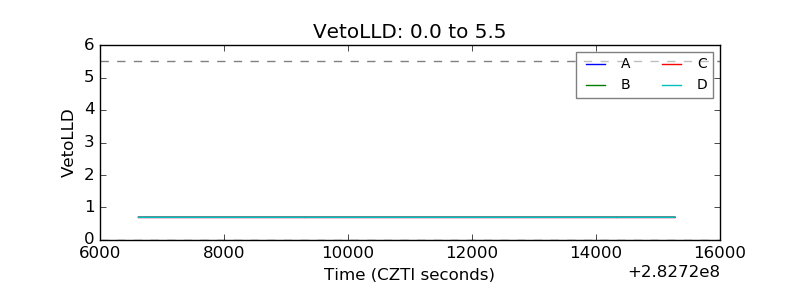 |
| Alpha Counter | 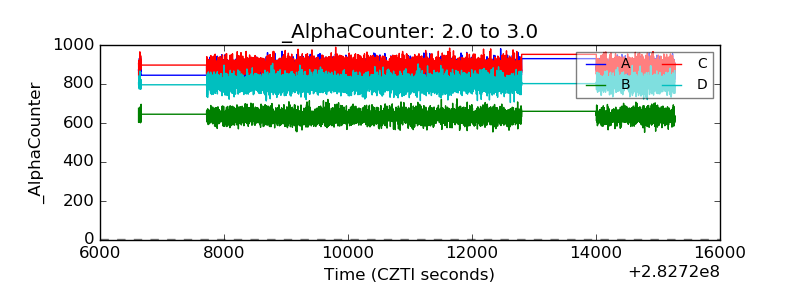 |
| _CPM_Rate | 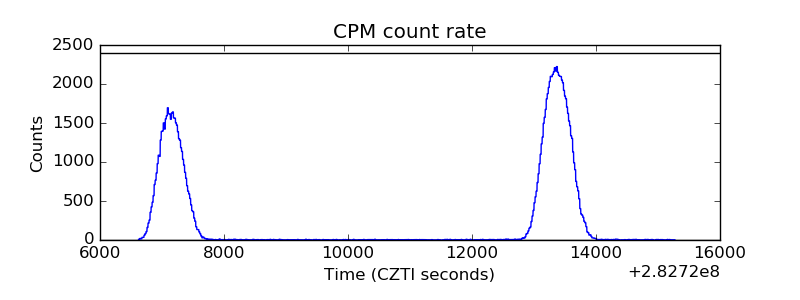 |
| CZT Counter | 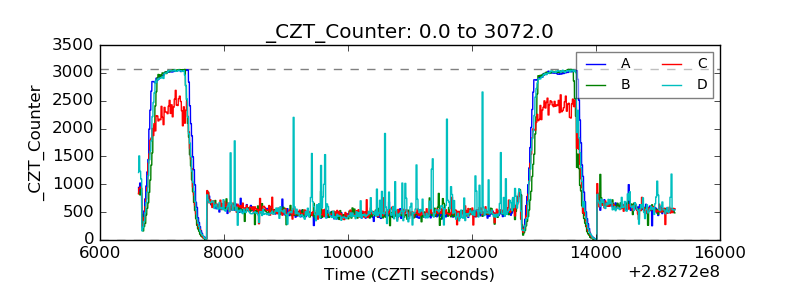 |
| +2.5 Volts monitor |  |
| +5 Volts monitor |  |
| _ROLL_ROT | 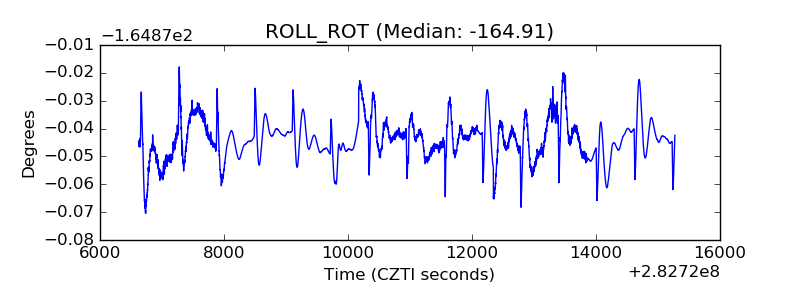 |
| _Roll_DEC | 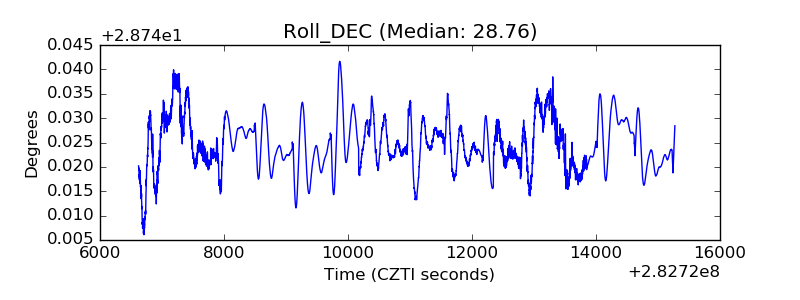 |
| _Roll_RA | 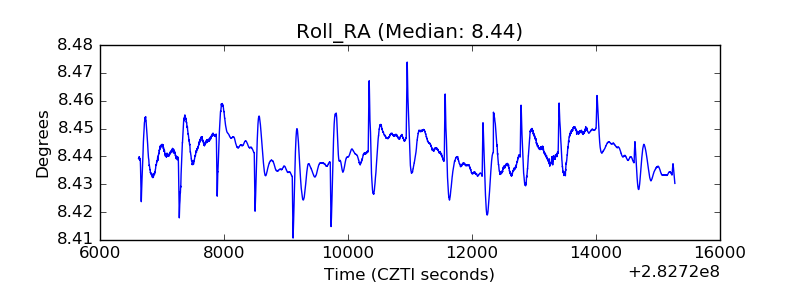 |
| Veto Counter | 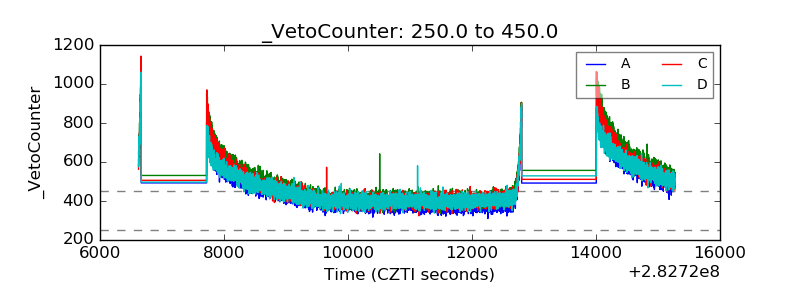 |