| Param | Original file | Final file |
|---|---|---|
| Filename | modeM0/AS1T03_030T01_9000002574_17411cztM0_level2.evt | modeM0/AS1T03_030T01_9000002574_17411cztM0_level2_quad_clean.evt |
| Size (bytes) | 312,099,840 | 63,555,840 |
| Size | 297.6 MB | 60.6 MB |
| Events in quadrant A | 1,907,808 | 431,010 |
| Events in quadrant B | 2,022,161 | 436,135 |
| Events in quadrant C | 2,115,560 | 402,126 |
| Events in quadrant D | 3,153,376 | 392,665 |
| Mode M0 | |||
|---|---|---|---|
| Quadrant | BADHDUFLAG | Total packets | Discarded packets |
| A | 0 | 8015 | 1 |
| B | 0 | 8324 | 1 |
| C | 0 | 8671 | 1 |
| D | 0 | 11912 | 1 |
| Mode SS | |||
|---|---|---|---|
| Quadrant | BADHDUFLAG | Total packets | Discarded packets |
| A | 0 | 74 | 0 |
| B | 0 | 74 | 0 |
| C | 0 | 74 | 0 |
| D | 0 | 74 | 0 |
| Mode M9 | |||
|---|---|---|---|
| Quadrant | BADHDUFLAG | Total packets | Discarded packets |
| A | 0 | 9 | 0 |
| B | 0 | 10 | 0 |
| C | 0 | 10 | 0 |
| D | 0 | 10 | 0 |
| Quadrant | Total seconds | Saturated seconds | Saturation percentage |
|---|---|---|---|
| A | 3713 | 9 | 0.242392% |
| B | 3713 | 13 | 0.350121% |
| C | 3713 | 24 | 0.646378% |
| D | 3713 | 117 | 3.151091% |
Noise dominated data is calculated using 1-second bins in cleaned event files. If a bin has >2000 counts, and if more than 50% of those come from <1% of pixels, then it is considered to be noise-dominated and hence unusable.
| Quadrant | # 1 sec bins | Bins with >0 counts | Bins with >2000 counts | High rate bins dominated by noise | Noise dominated (total time) | Noise dominated (detector-on time) | Marked lightcurve |
|---|---|---|---|---|---|---|---|
| A | 3713 | 3713 | 0 | 0 | 0.00% | 0.00% | 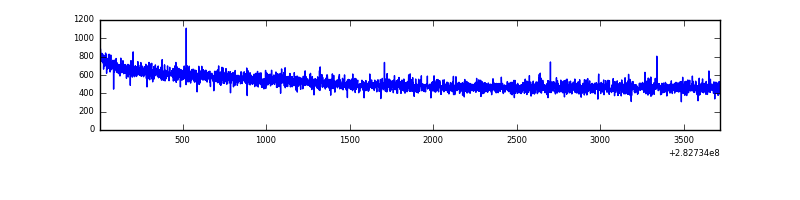 |
| B | 3713 | 3713 | 1 | 1 | 0.03% | 0.03% | 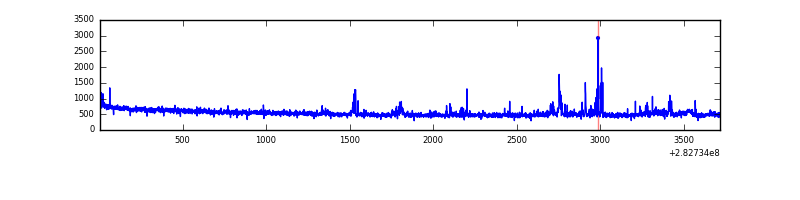 |
| C | 3713 | 3713 | 0 | 0 | 0.00% | 0.00% | 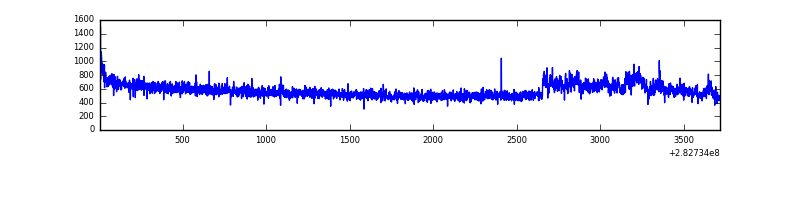 |
| D | 3713 | 3713 | 140 | 140 | 3.77% | 3.77% | 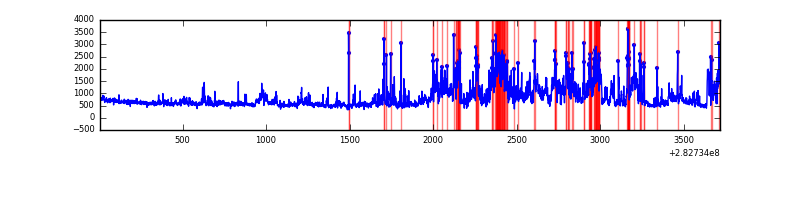 |
Top three noisy pixels from each quadrant. If the there are fewer than three noisy pixels in the level2.evt file, extra rows are filled as -1
| Pixel properties | Quadrant properties | ||||||
|---|---|---|---|---|---|---|---|
| Quadrant | DetID | PixID | Counts | Sigma | Mean | Median | Sigma |
| A | 0 | 226 | 4423 | 39.88 | 496 | 489 | 98.6 |
| A | 12 | 194 | 3653 | 32.08 | 496 | 489 | 98.6 |
| A | 3 | 137 | 3230 | 27.79 | 496 | 489 | 98.6 |
| B | 0 | 197 | 45246 | 484.76 | 489 | 478 | 92.4 |
| B | 0 | 229 | 16615 | 174.74 | 489 | 478 | 92.4 |
| B | 4 | 216 | 16074 | 168.88 | 489 | 478 | 92.4 |
| C | 3 | 233 | 205445 | 1931.29 | 456 | 460 | 106.1 |
| C | 14 | 238 | 73004 | 683.48 | 456 | 460 | 106.1 |
| C | 5 | 218 | 34362 | 319.41 | 456 | 460 | 106.1 |
| D | 11 | 176 | 1073282 | 9364.58 | 470 | 458 | 114.6 |
| D | 10 | 70 | 90771 | 788.33 | 470 | 458 | 114.6 |
| D | 13 | 232 | 78846 | 684.24 | 470 | 458 | 114.6 |
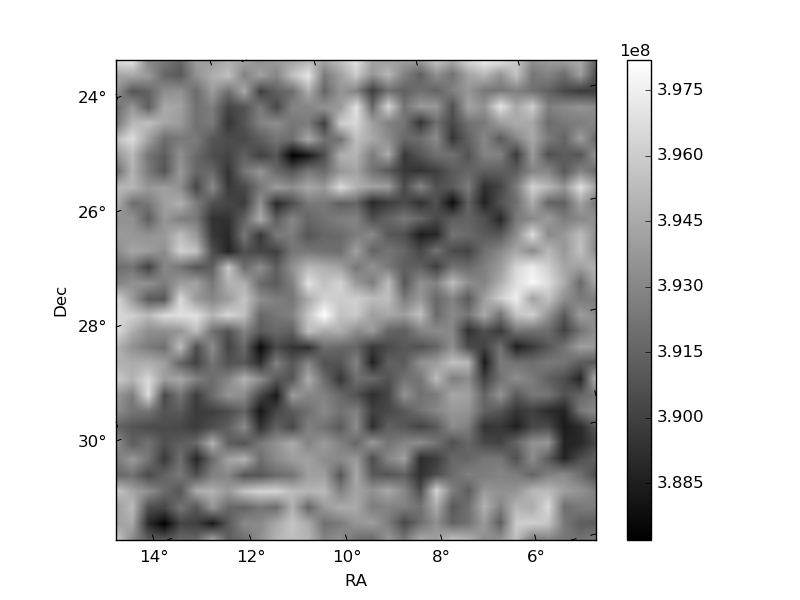
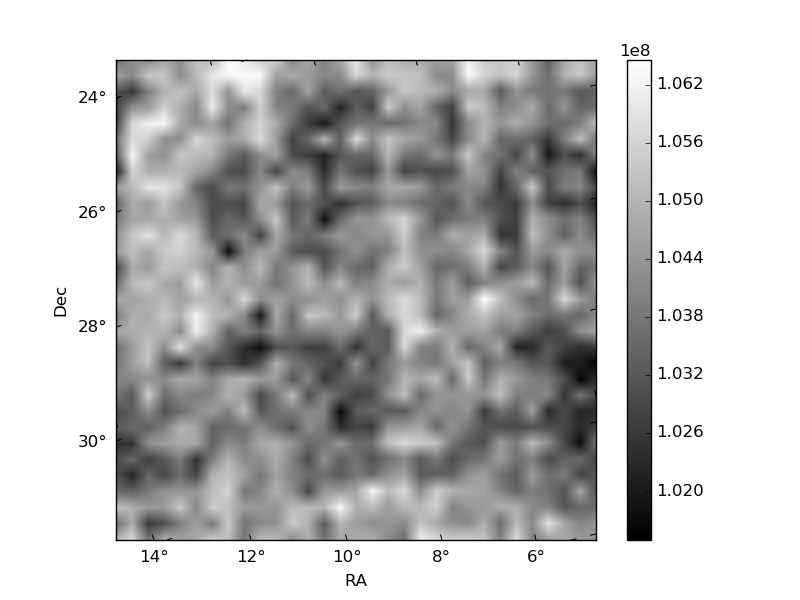
Histogram calculated using DETX and DETY for each event in the final _common_clean file
| Quadrant A | 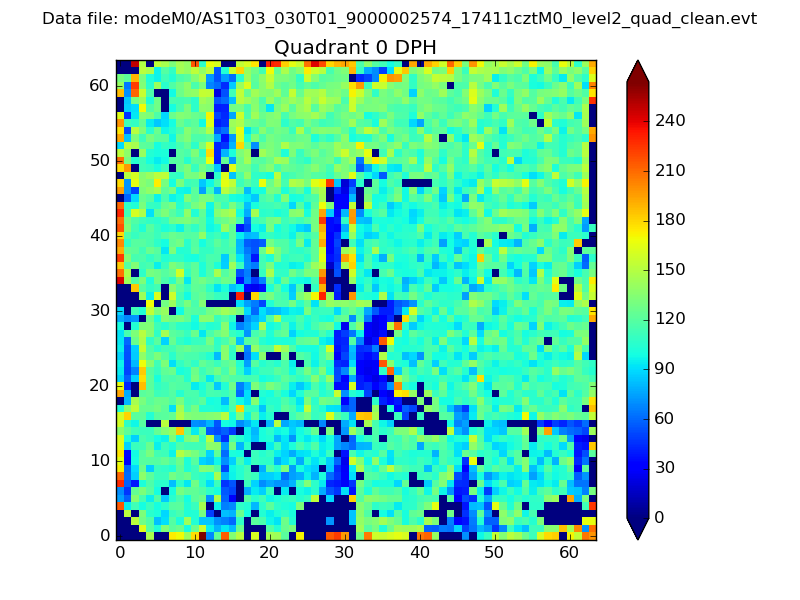 |
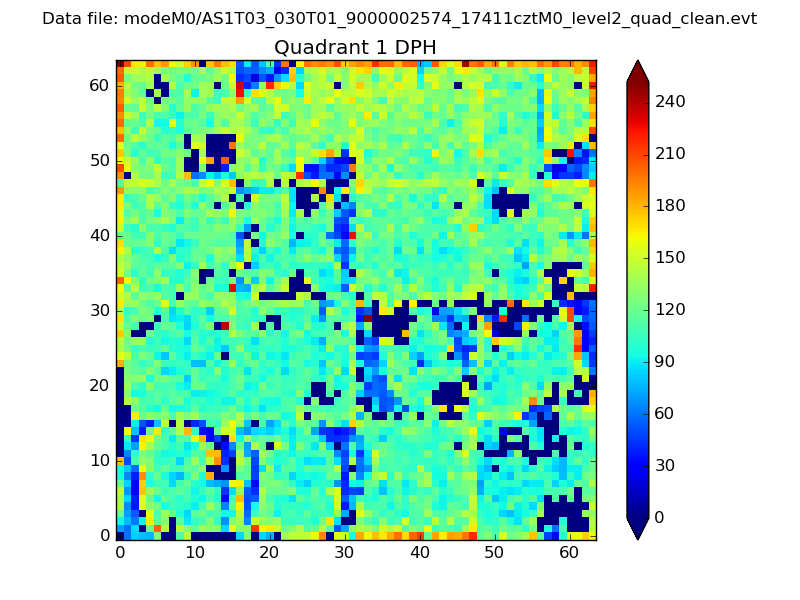 |
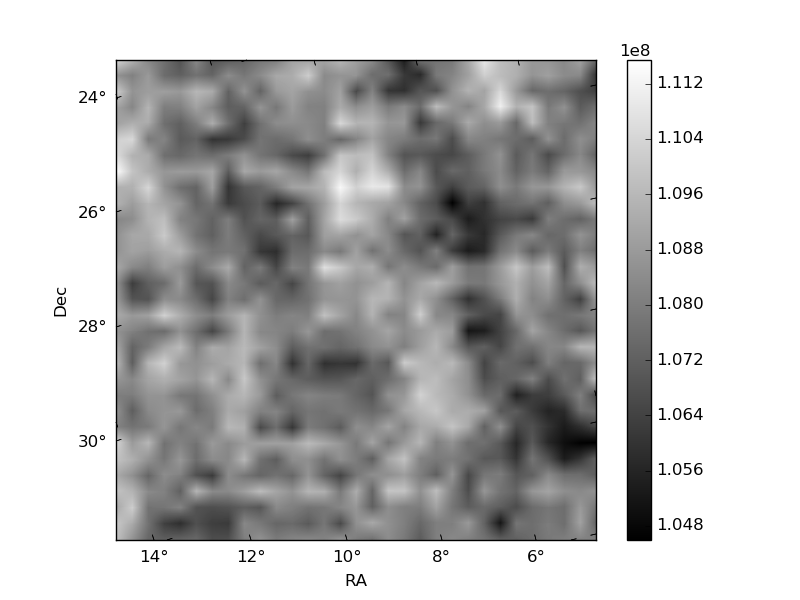
Quadrant B |
|---|---|---|---|
| Quadrant D | 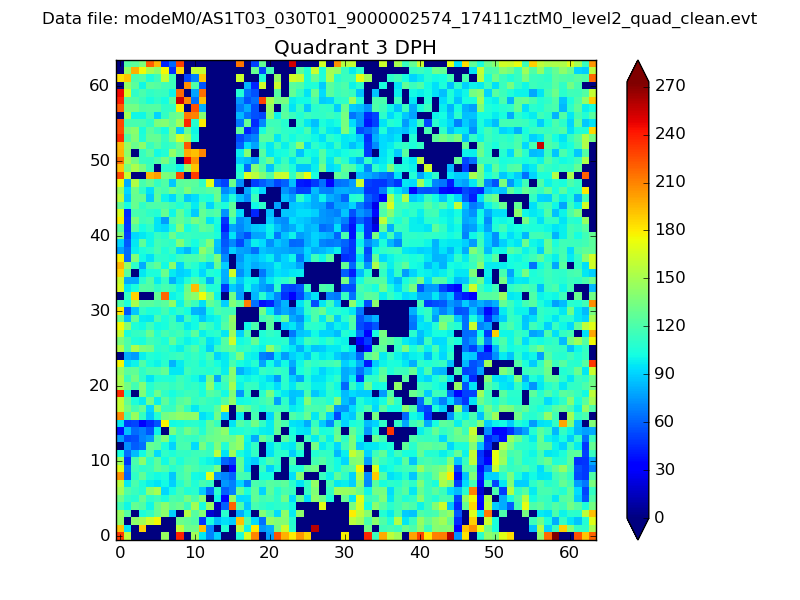 |
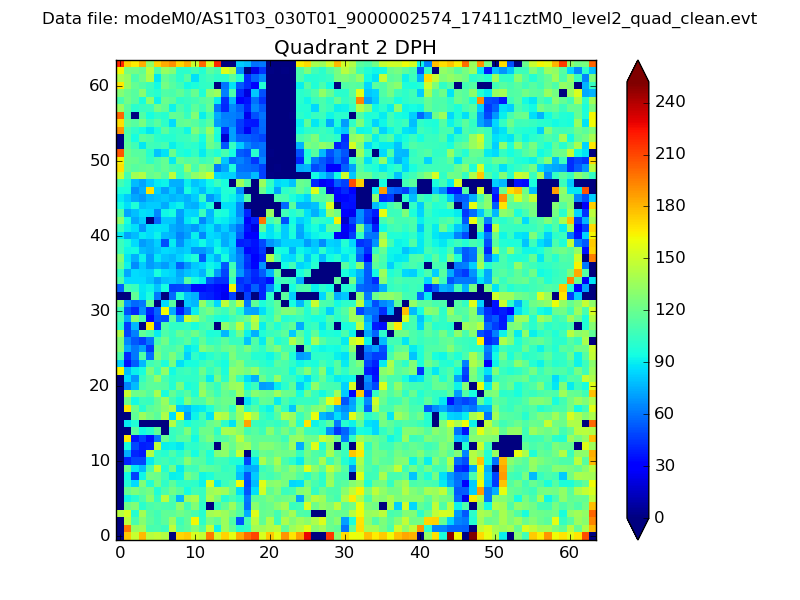 |
Quadrant C |
| Plot type | Count rate plots | Images |
|---|---|---|
| Comparison with Poisson distribution Blue bars denote a histogram of data divided into 1 sec bins. Red curve is a Poisson curve with rate = median count rate of data. |
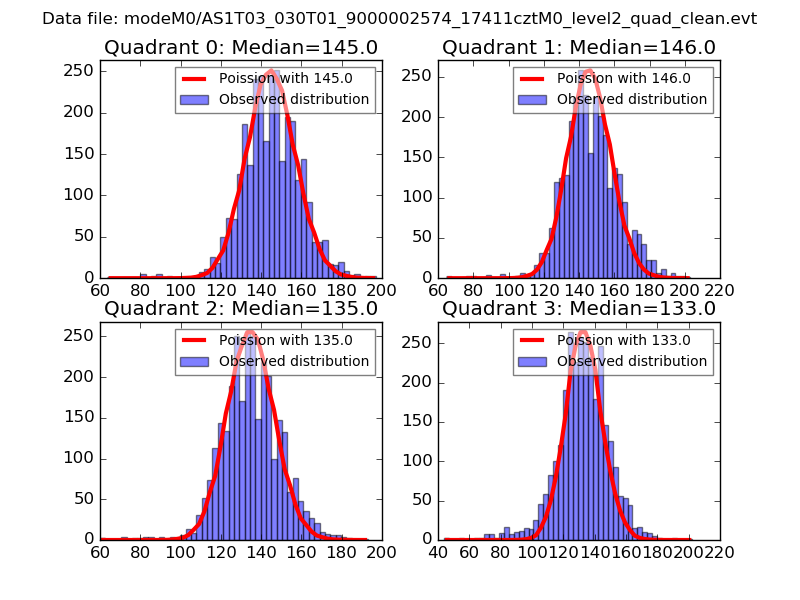 |
 |
| Quadrant-wise count rates Data is divided into 100 sec bins |
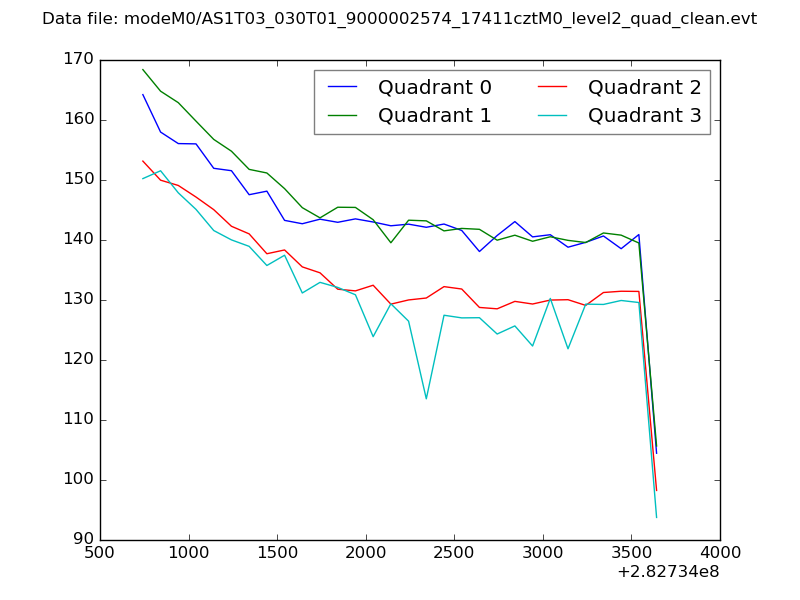 |
|
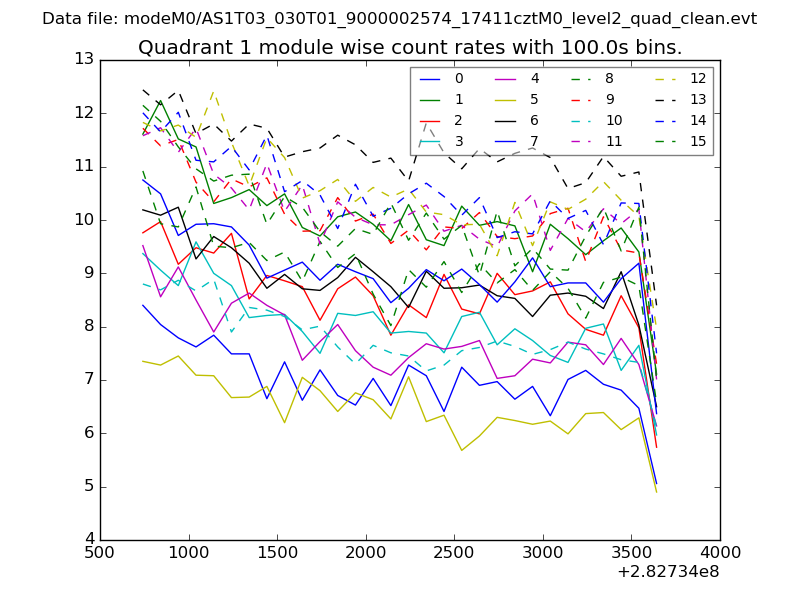
| Module-wise count rates for Quadrant A Data is divided into 100 sec bins |
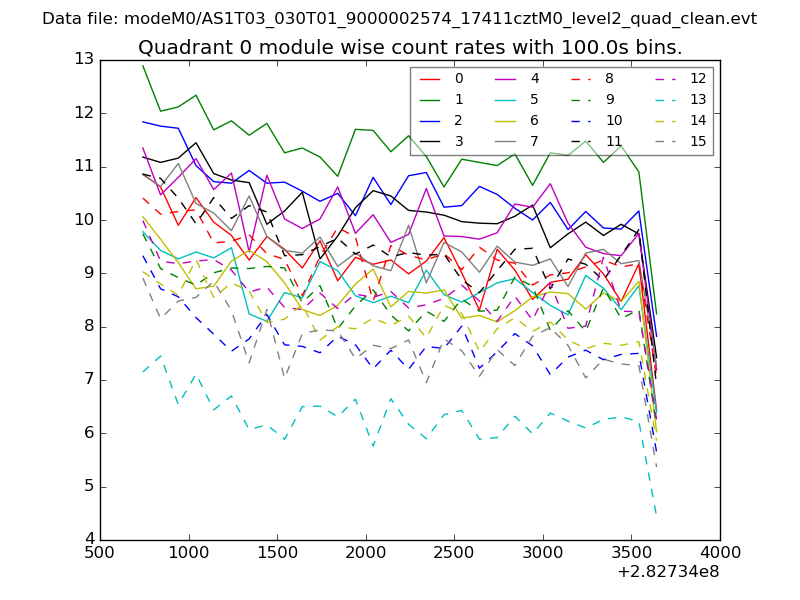 |
 |
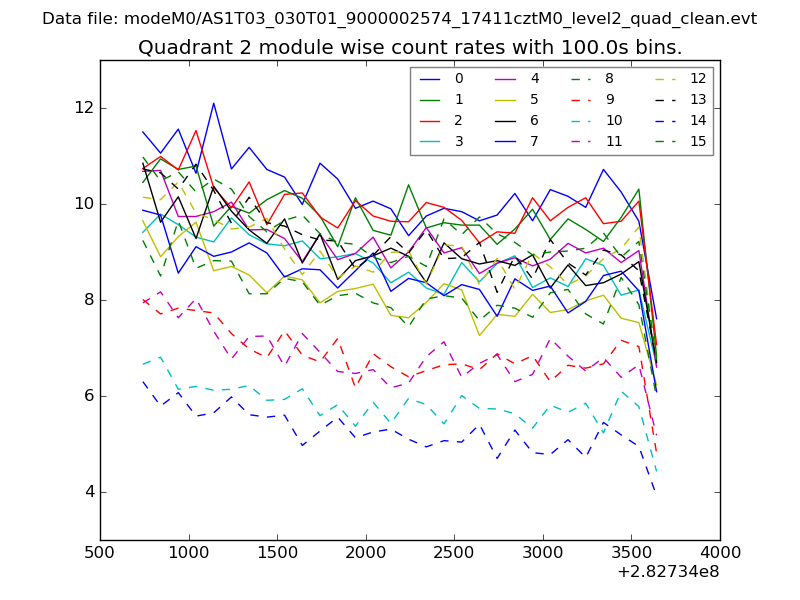
| Module-wise count rates for Quadrant B Data is divided into 100 sec bins |
 |
 |
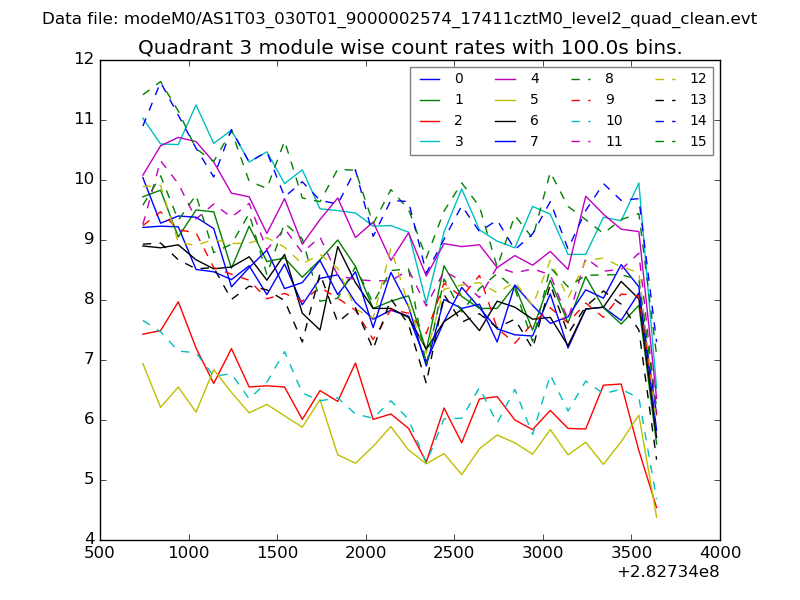
| Module-wise count rates for Quadrant C Data is divided into 100 sec bins |
 |
 |
| Module-wise count rates for Quadrant D Data is divided into 100 sec bins |
 |
 |
| Parameter | Plot |
|---|---|
| CZT HV Monitor | 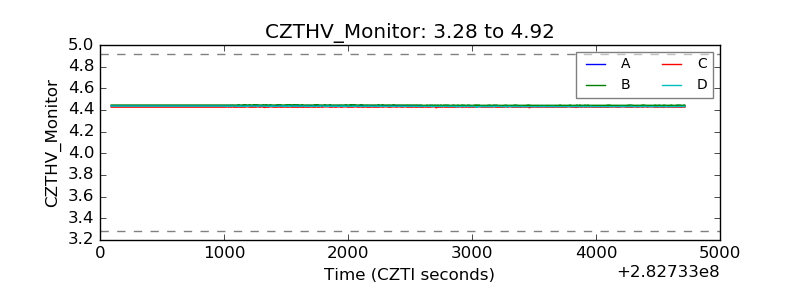 |
| D_VDD |  |
| Temperature 1 | 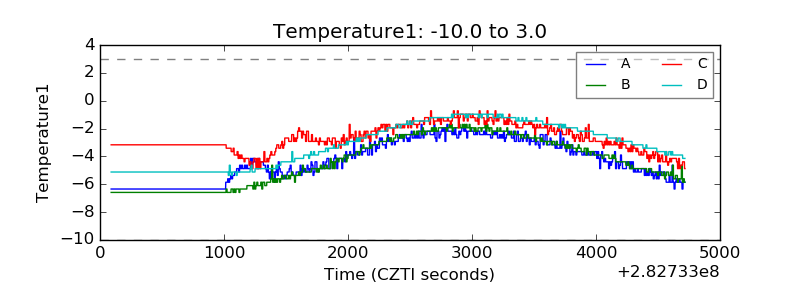 |
| Veto HV Monitor | 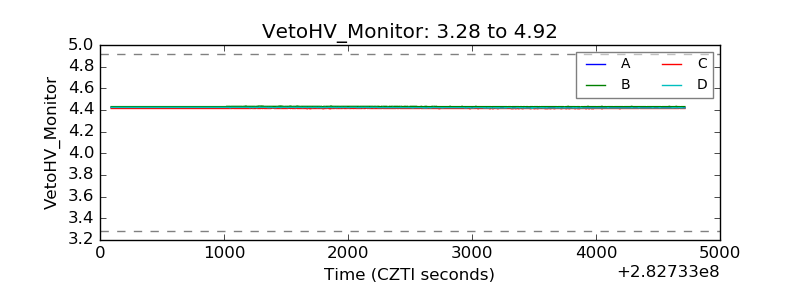 |
| Veto LLD | 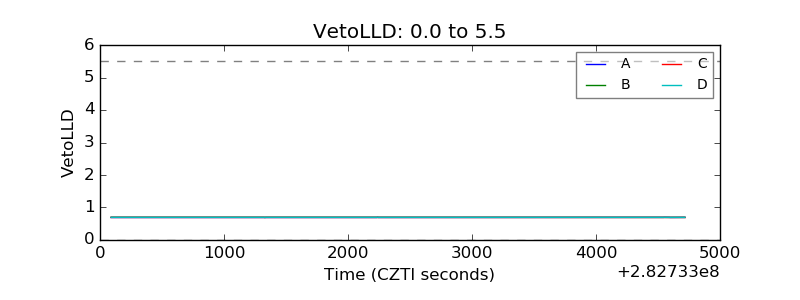 |
| Alpha Counter | 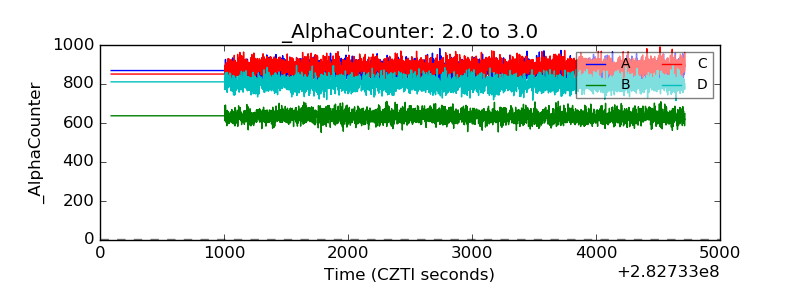 |
| _CPM_Rate | 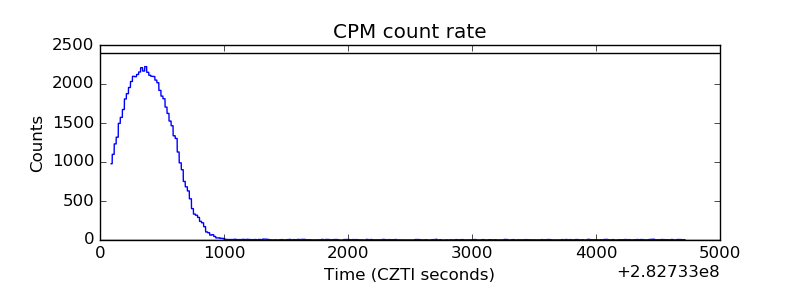 |
| CZT Counter | 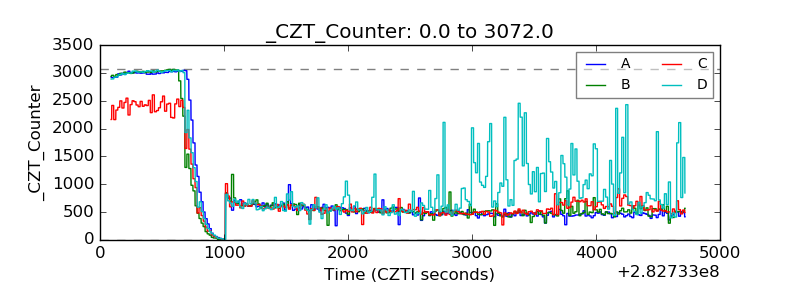 |
| +2.5 Volts monitor |  |
| +5 Volts monitor |  |
| _ROLL_ROT | 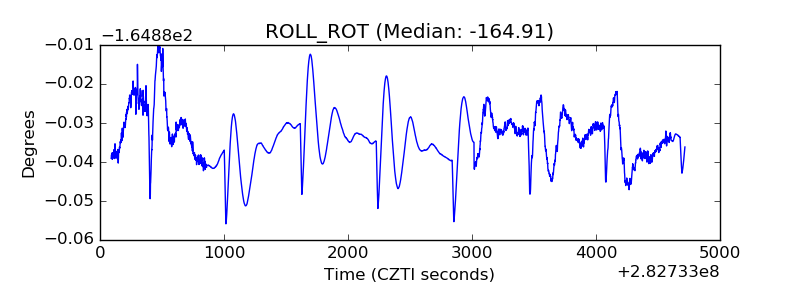 |
| _Roll_DEC | 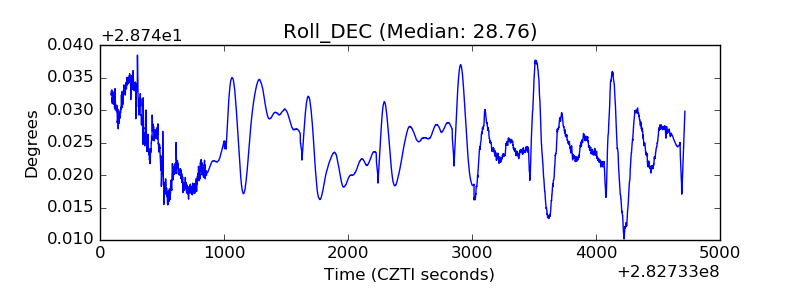 |
| _Roll_RA | 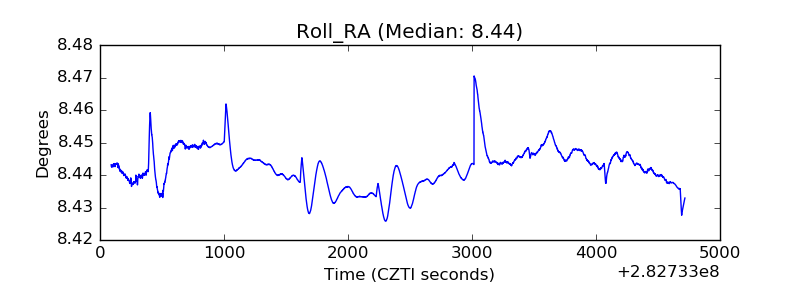 |
| Veto Counter | 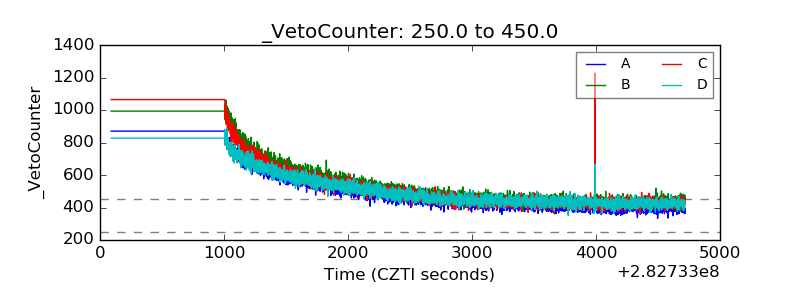 |