| Param | Original file | Final file |
|---|---|---|
| Filename | modeM0/AS1A05_182T03_9000002576cztM0_level2.fits | modeM0/AS1A05_182T03_9000002576cztM0_level2_quad_clean.evt |
| Size (bytes) | 133,856,640 | 54,696,960 |
| Size | 127.7 MB | 52.2 MB |
| Events in quadrant A | 873,636 | 223,594 |
| Events in quadrant B | 819,506 | 218,089 |
| Events in quadrant C | 821,346 | 202,332 |
| Events in quadrant D | 675,578 | 147,146 |
| Mode M0 | |||
|---|---|---|---|
| Quadrant | BADHDUFLAG | Total packets | Discarded packets |
| A | 0 | 26801 | 0 |
| B | 0 | 27573 | 0 |
| C | 0 | 26469 | 0 |
| D | 0 | 51254 | 0 |
| Mode SS | |||
|---|---|---|---|
| Quadrant | BADHDUFLAG | Total packets | Discarded packets |
| A | 0 | 256 | 0 |
| B | 0 | 256 | 0 |
| C | 0 | 256 | 0 |
| D | 0 | 256 | 0 |
| Mode M9 | |||
|---|---|---|---|
| Quadrant | BADHDUFLAG | Total packets | Discarded packets |
| A | 0 | 39 | 0 |
| B | 0 | 39 | 0 |
| C | 0 | 39 | 0 |
| D | 0 | 39 | 0 |
| Quadrant | Total seconds | Saturated seconds | Saturation percentage |
|---|---|---|---|
| A | 12486 | 175 | 1.401570% |
| B | 12486 | 191 | 1.529713% |
| C | 12486 | 204 | 1.633830% |
| D | 12486 | 2274 | 18.212398% |
Noise dominated data is calculated using 1-second bins in cleaned event files. If a bin has >2000 counts, and if more than 50% of those come from <1% of pixels, then it is considered to be noise-dominated and hence unusable.
| Quadrant | # 1 sec bins | Bins with >0 counts | Bins with >2000 counts | High rate bins dominated by noise | Noise dominated (total time) | Noise dominated (detector-on time) | Marked lightcurve |
|---|---|---|---|---|---|---|---|
| A | 16456 | 12486 | 0 | 0 | 0.00% | 0.00% |  |
| B | 16456 | 12486 | 0 | 0 | 0.00% | 0.00% |  |
| C | 16456 | 12486 | 0 | 0 | 0.00% | 0.00% |  |
| D | 16456 | 12485 | 0 | 0 | 0.00% | 0.00% |  |
Top three noisy pixels from each quadrant. If the there are fewer than three noisy pixels in the level2.evt file, extra rows are filled as -1
| Pixel properties | Quadrant properties | ||||||
|---|---|---|---|---|---|---|---|
| Quadrant | DetID | PixID | Counts | Sigma | Mean | Median | Sigma |
| A | 0 | 29 | 861 | 11.46 | 227 | 216 | 56.3 |
| A | 7 | 110 | 690 | 8.42 | 227 | 216 | 56.3 |
| A | 0 | 30 | 667 | 8.01 | 227 | 216 | 56.3 |
| B | 2 | 9 | 599 | 8.82 | 217 | 210 | 44.1 |
| B | 14 | 254 | 561 | 7.96 | 217 | 210 | 44.1 |
| B | 5 | 255 | 545 | 7.6 | 217 | 210 | 44.1 |
| C | 1 | 80 | 620 | 7.3 | 216 | 205 | 56.8 |
| C | 1 | 81 | 602 | 6.99 | 216 | 205 | 56.8 |
| C | 3 | 126 | 566 | 6.35 | 216 | 205 | 56.8 |
| D | 7 | 3 | 494 | 6.07 | 193 | 177 | 52.3 |
| D | 6 | 231 | 486 | 5.91 | 193 | 177 | 52.3 |
| D | 6 | 38 | 486 | 5.91 | 193 | 177 | 52.3 |
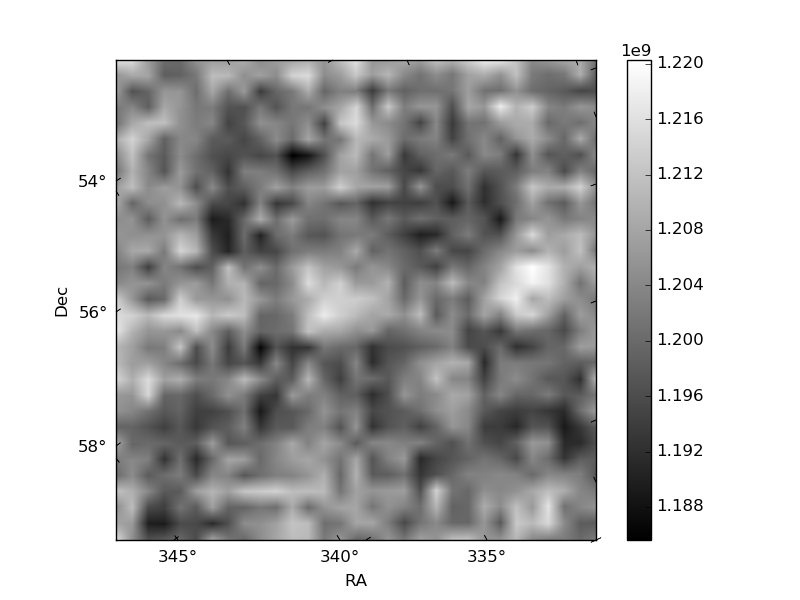
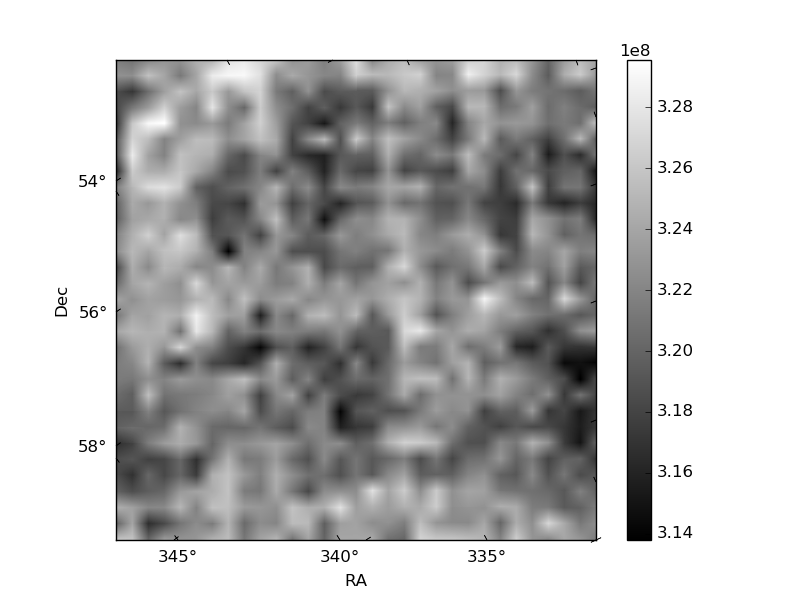
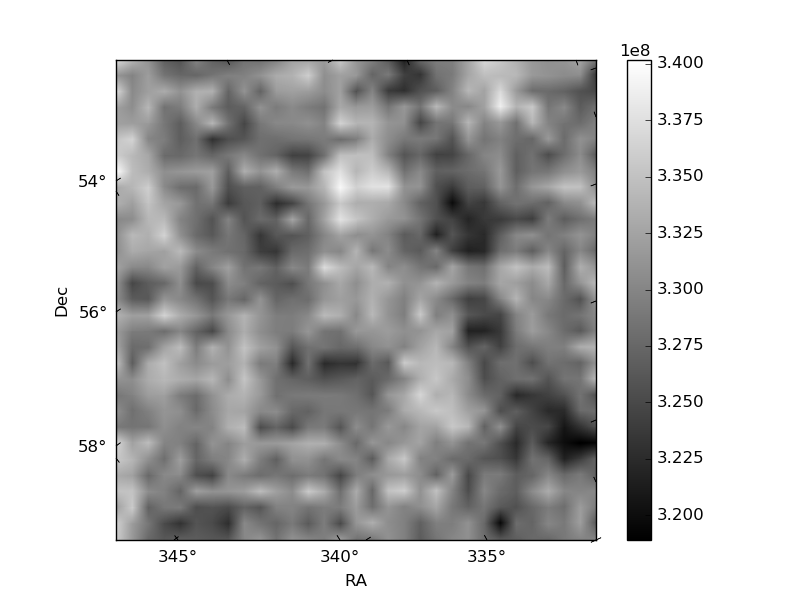
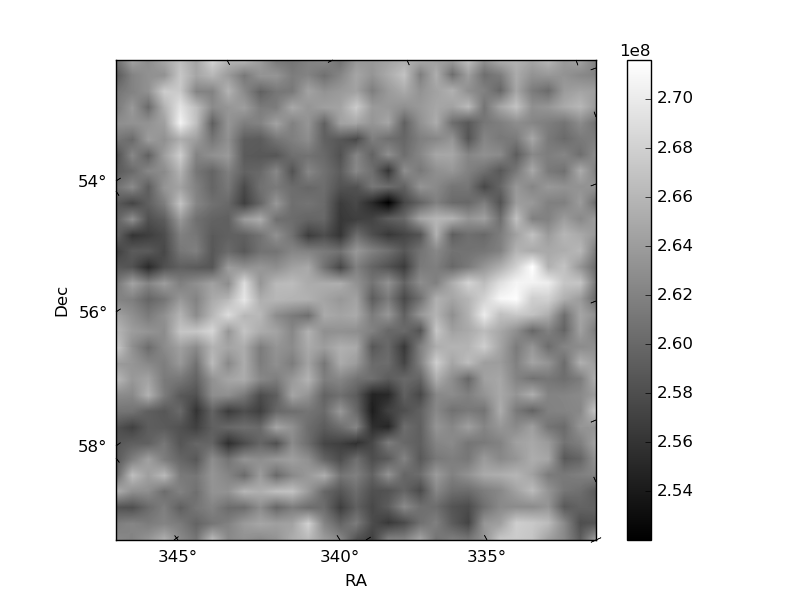
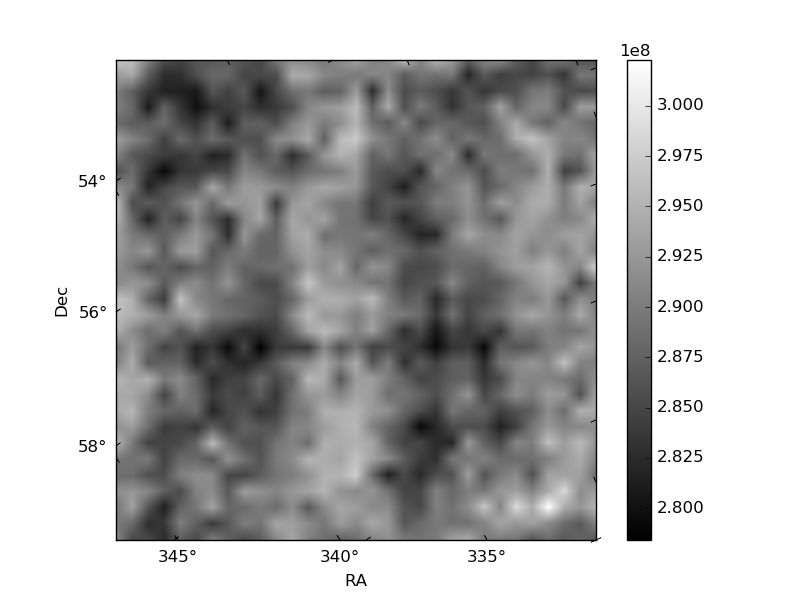
Histogram calculated using DETX and DETY for each event in the final _common_clean file
| Quadrant A | 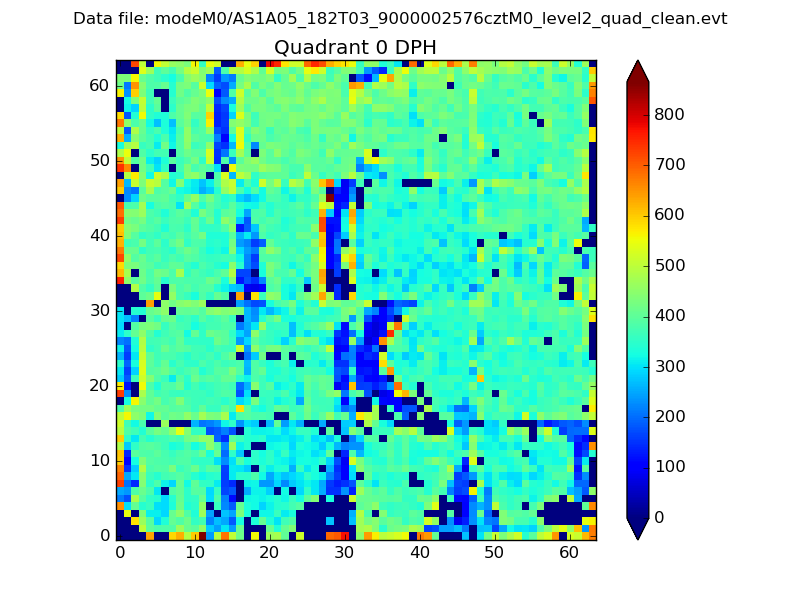 |
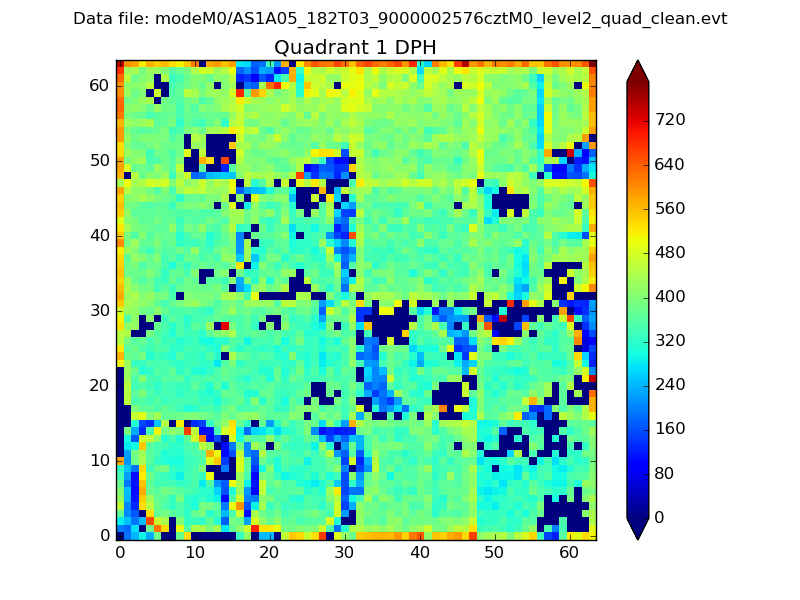 |
Quadrant B |
|---|---|---|---|
| Quadrant D | 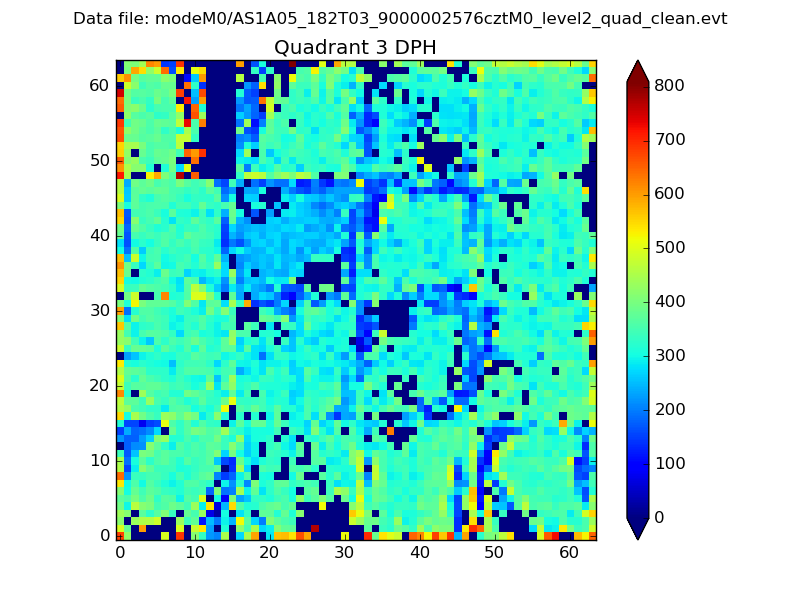 |
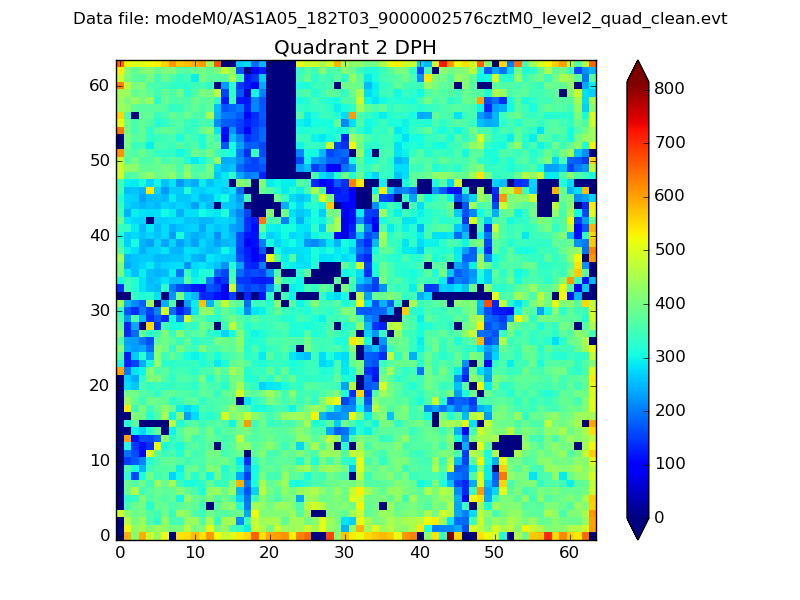 |
Quadrant C |
| Plot type | Count rate plots | Images |
|---|---|---|
| Comparison with Poisson distribution Blue bars denote a histogram of data divided into 1 sec bins. Red curve is a Poisson curve with rate = median count rate of data. |
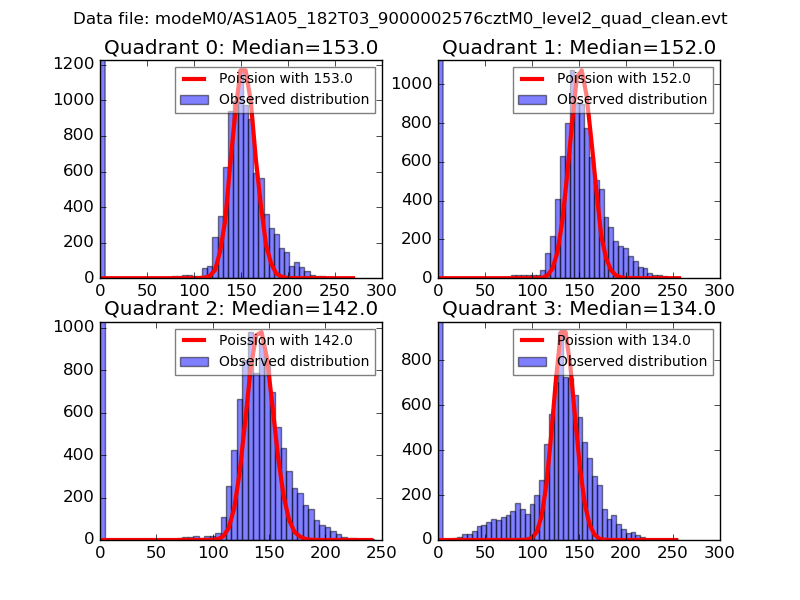 |
 |
| Quadrant-wise count rates Data is divided into 100 sec bins |
 |
|
| Module-wise count rates for Quadrant A Data is divided into 100 sec bins |
 |
 |
| Module-wise count rates for Quadrant B Data is divided into 100 sec bins |
 |
 |
| Module-wise count rates for Quadrant C Data is divided into 100 sec bins |
 |
 |
| Module-wise count rates for Quadrant D Data is divided into 100 sec bins |
 |
 |
| Parameter | Plot |
|---|---|
| CZT HV Monitor |  |
| D_VDD |  |
| Temperature 1 |  |
| Veto HV Monitor |  |
| Veto LLD |  |
| Alpha Counter |  |
| _CPM_Rate |  |
| CZT Counter |  |
| +2.5 Volts monitor |  |
| +5 Volts monitor | 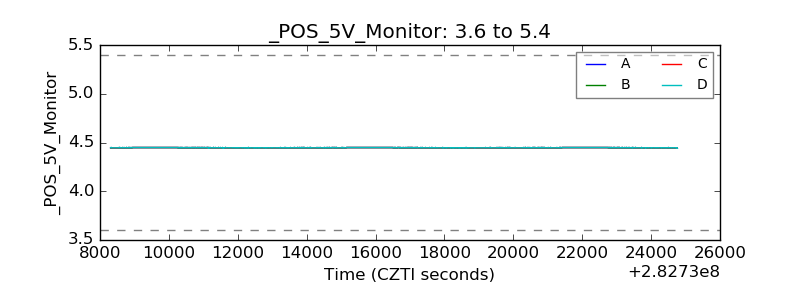 |
| _ROLL_ROT | 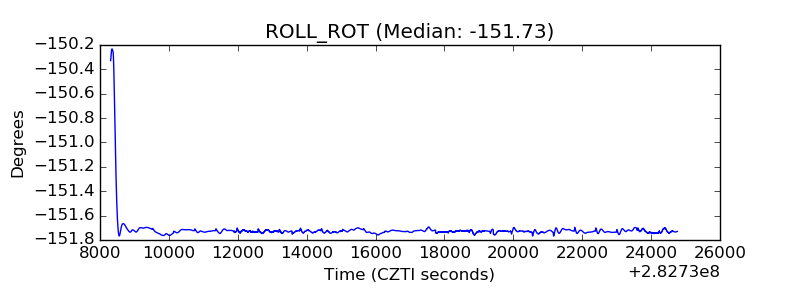 |
| _Roll_DEC | 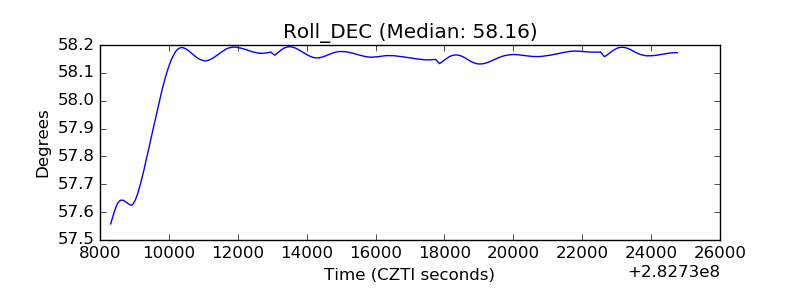 |
| _Roll_RA |  |
| Veto Counter | 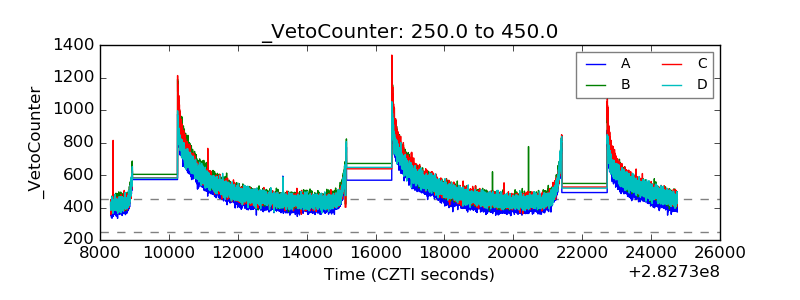 |