| Param | Original file | Final file |
|---|---|---|
| Filename | modeM0/AS1A05_182T03_9000002576_17411cztM0_level2.evt | modeM0/AS1A05_182T03_9000002576_17411cztM0_level2_quad_clean.evt |
| Size (bytes) | 192,692,160 | 32,751,360 |
| Size | 183.8 MB | 31.2 MB |
| Events in quadrant A | 1,078,456 | 230,040 |
| Events in quadrant B | 1,096,756 | 232,277 |
| Events in quadrant C | 1,086,938 | 212,682 |
| Events in quadrant D | 2,440,081 | 175,424 |
| Mode M0 | |||
|---|---|---|---|
| Quadrant | BADHDUFLAG | Total packets | Discarded packets |
| A | 0 | 4447 | 1 |
| B | 0 | 4482 | 1 |
| C | 0 | 4383 | 1 |
| D | 0 | 8579 | 1 |
| Mode SS | |||
|---|---|---|---|
| Quadrant | BADHDUFLAG | Total packets | Discarded packets |
| A | 0 | 40 | 0 |
| B | 0 | 40 | 0 |
| C | 0 | 40 | 0 |
| D | 0 | 40 | 0 |
| Mode M9 | |||
|---|---|---|---|
| Quadrant | BADHDUFLAG | Total packets | Discarded packets |
| A | 0 | 13 | 0 |
| B | 0 | 13 | 0 |
| C | 0 | 13 | 0 |
| D | 0 | 13 | 0 |
| Quadrant | Total seconds | Saturated seconds | Saturation percentage |
|---|---|---|---|
| A | 1933 | 27 | 1.396793% |
| B | 1933 | 35 | 1.810657% |
| C | 1933 | 36 | 1.862390% |
| D | 1933 | 552 | 28.556648% |
Noise dominated data is calculated using 1-second bins in cleaned event files. If a bin has >2000 counts, and if more than 50% of those come from <1% of pixels, then it is considered to be noise-dominated and hence unusable.
| Quadrant | # 1 sec bins | Bins with >0 counts | Bins with >2000 counts | High rate bins dominated by noise | Noise dominated (total time) | Noise dominated (detector-on time) | Marked lightcurve |
|---|---|---|---|---|---|---|---|
| A | 3243 | 1934 | 0 | 0 | 0.00% | 0.00% | 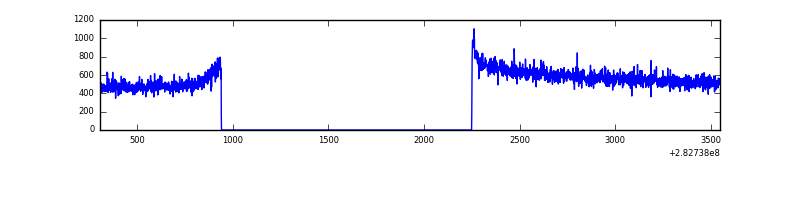 |
| B | 3243 | 1934 | 0 | 0 | 0.00% | 0.00% | 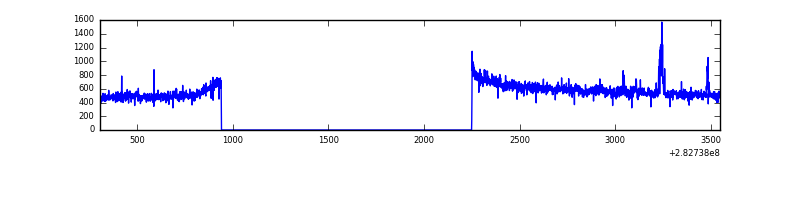 |
| C | 3243 | 1934 | 0 | 0 | 0.00% | 0.00% | 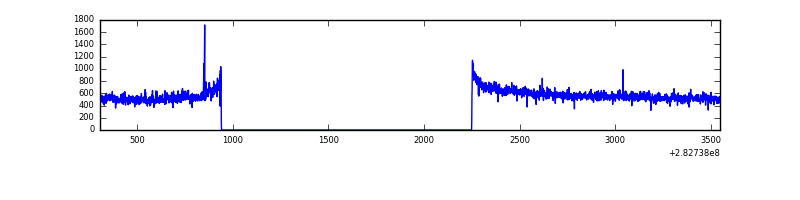 |
| D | 3243 | 1934 | 463 | 463 | 14.28% | 23.94% | 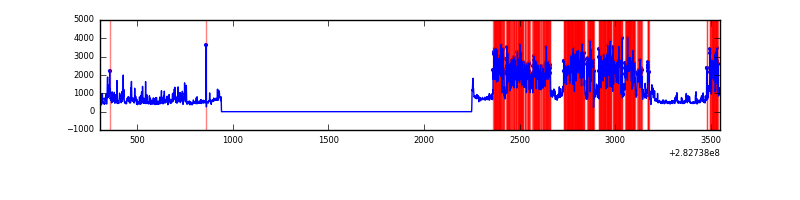 |
Top three noisy pixels from each quadrant. If the there are fewer than three noisy pixels in the level2.evt file, extra rows are filled as -1
| Pixel properties | Quadrant properties | ||||||
|---|---|---|---|---|---|---|---|
| Quadrant | DetID | PixID | Counts | Sigma | Mean | Median | Sigma |
| A | 0 | 226 | 2470 | 38.61 | 280 | 274 | 56.9 |
| A | 12 | 194 | 2048 | 31.19 | 280 | 274 | 56.9 |
| A | 3 | 137 | 1945 | 29.38 | 280 | 274 | 56.9 |
| B | 0 | 230 | 16666 | 315.35 | 274 | 269 | 52.0 |
| B | 12 | 111 | 5844 | 107.22 | 274 | 269 | 52.0 |
| B | 11 | 111 | 5046 | 91.87 | 274 | 269 | 52.0 |
| C | 14 | 238 | 40829 | 667.04 | 258 | 259 | 60.8 |
| C | 5 | 218 | 13319 | 214.73 | 258 | 259 | 60.8 |
| C | 3 | 233 | 12360 | 198.96 | 258 | 259 | 60.8 |
| D | 11 | 176 | 1370415 | 22902.04 | 241 | 234 | 59.8 |
| D | 13 | 232 | 83165 | 1386.16 | 241 | 234 | 59.8 |
| D | 10 | 70 | 33396 | 554.29 | 241 | 234 | 59.8 |
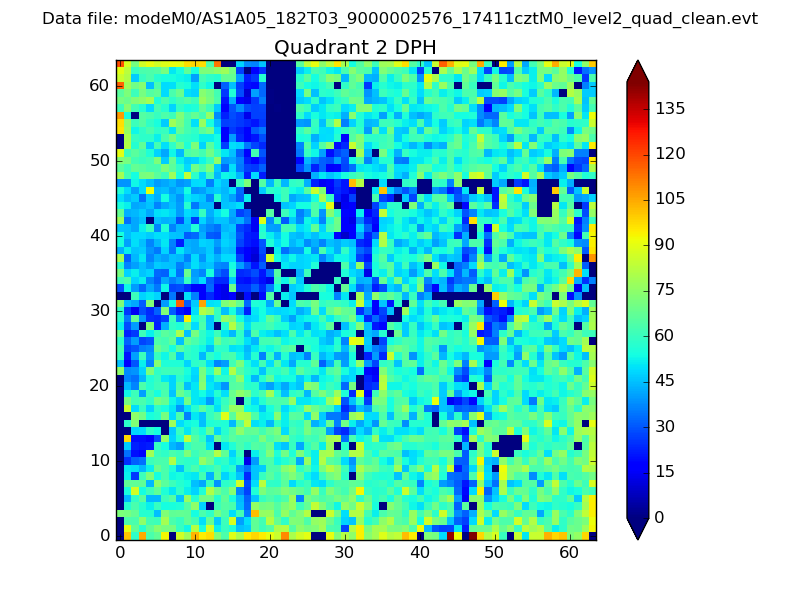
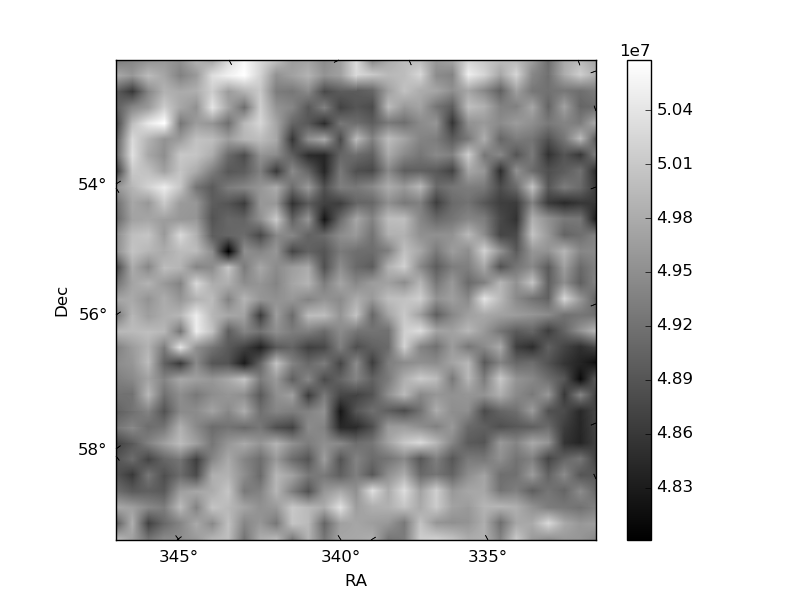
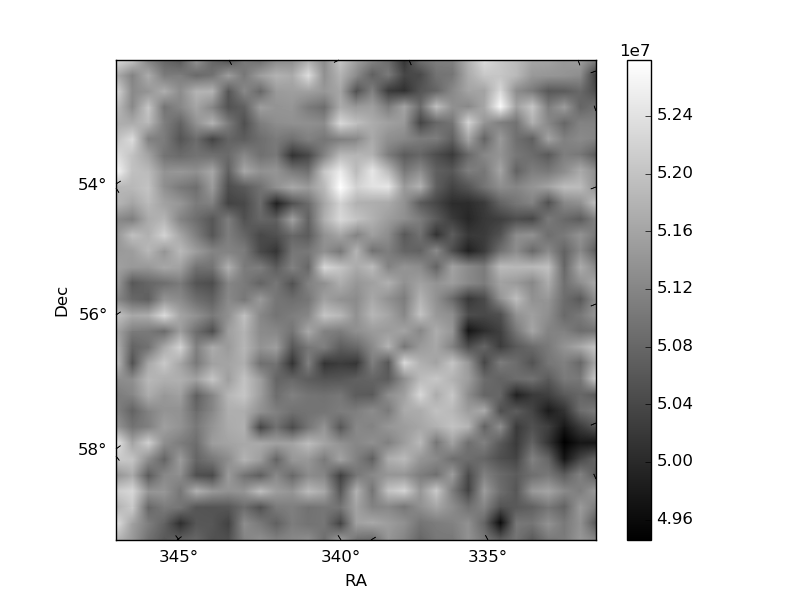
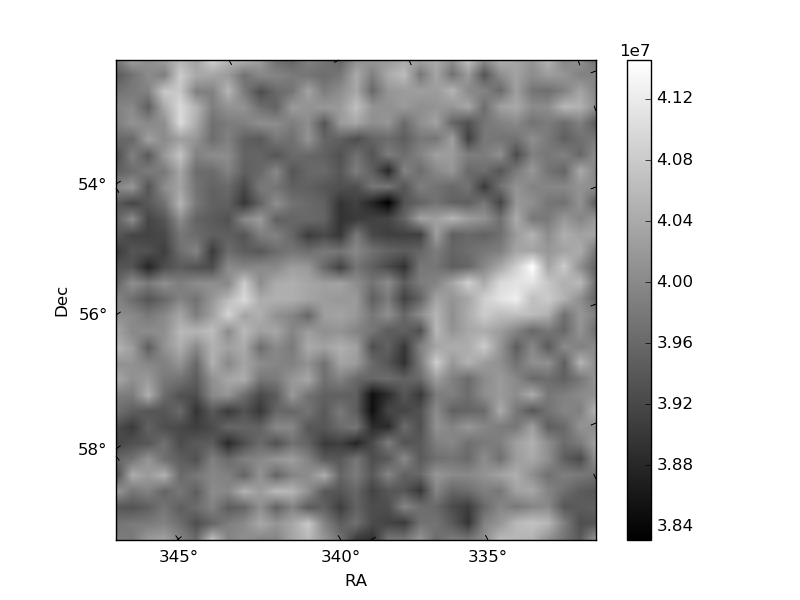
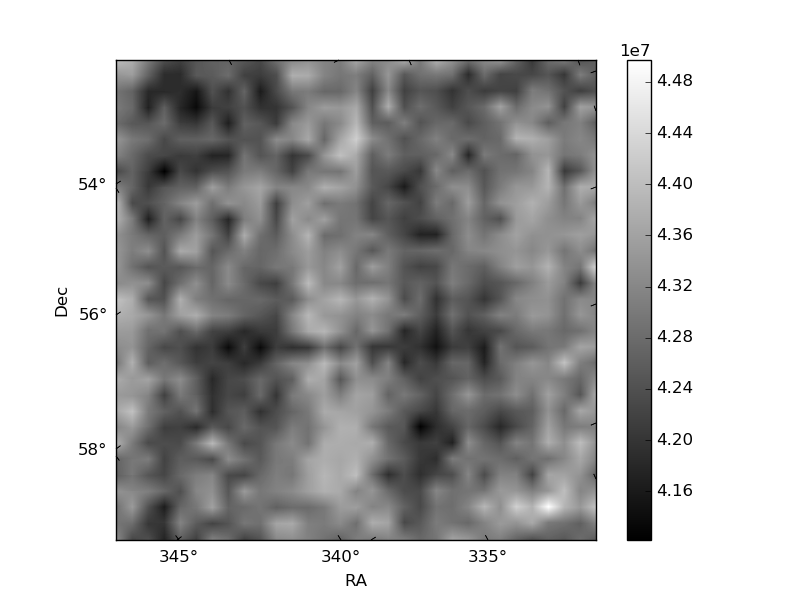
Histogram calculated using DETX and DETY for each event in the final _common_clean file
| Quadrant A | 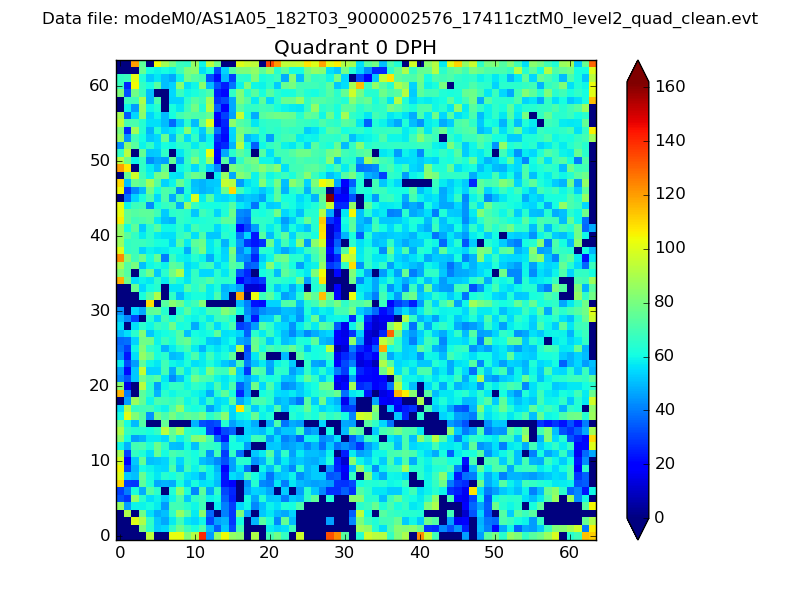 |
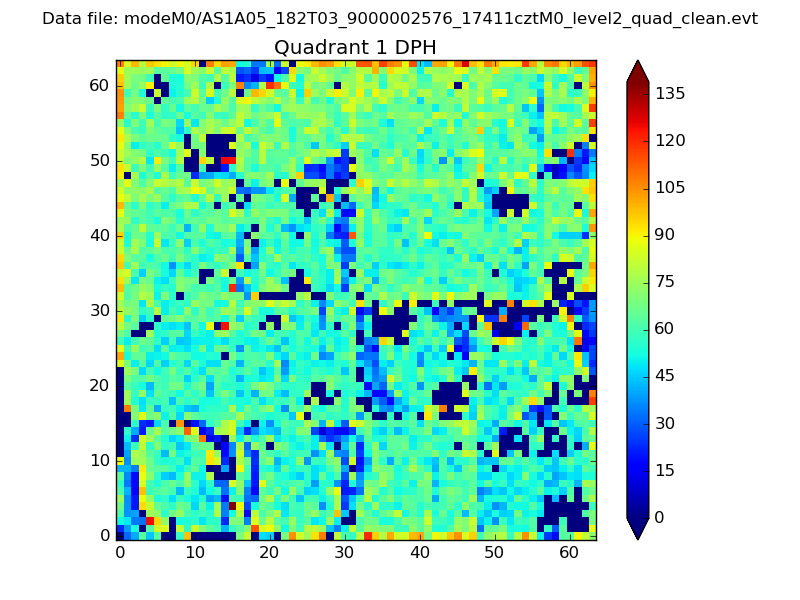 |
Quadrant B |
|---|---|---|---|
| Quadrant D | 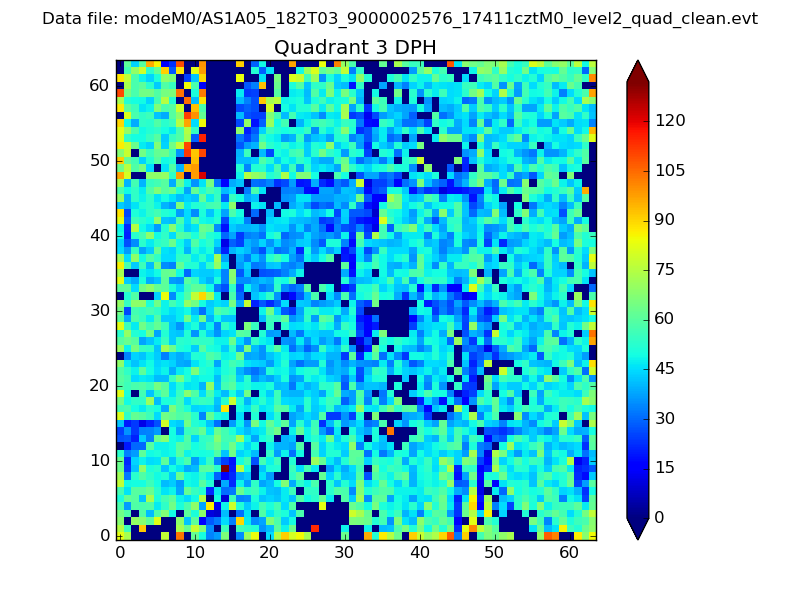 |
 |
Quadrant C |
| Plot type | Count rate plots | Images |
|---|---|---|
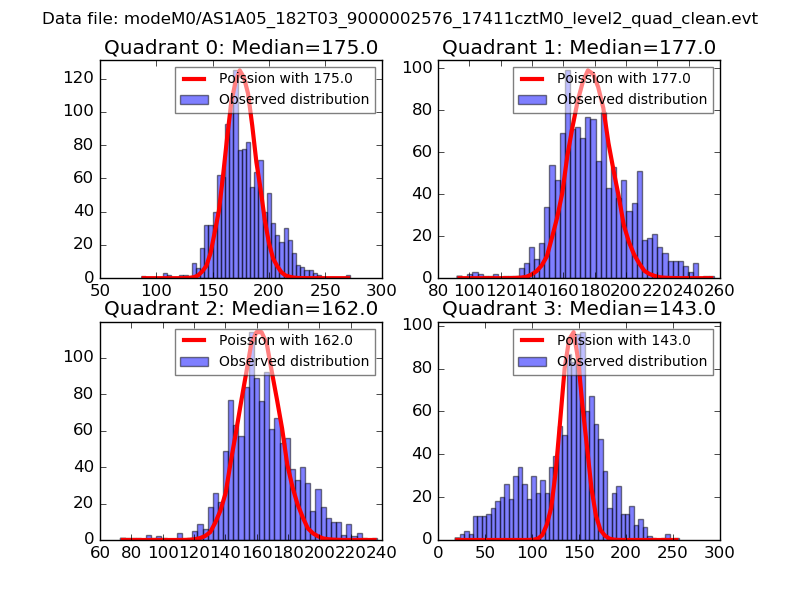
| Comparison with Poisson distribution Blue bars denote a histogram of data divided into 1 sec bins. Red curve is a Poisson curve with rate = median count rate of data. |
 |
 |
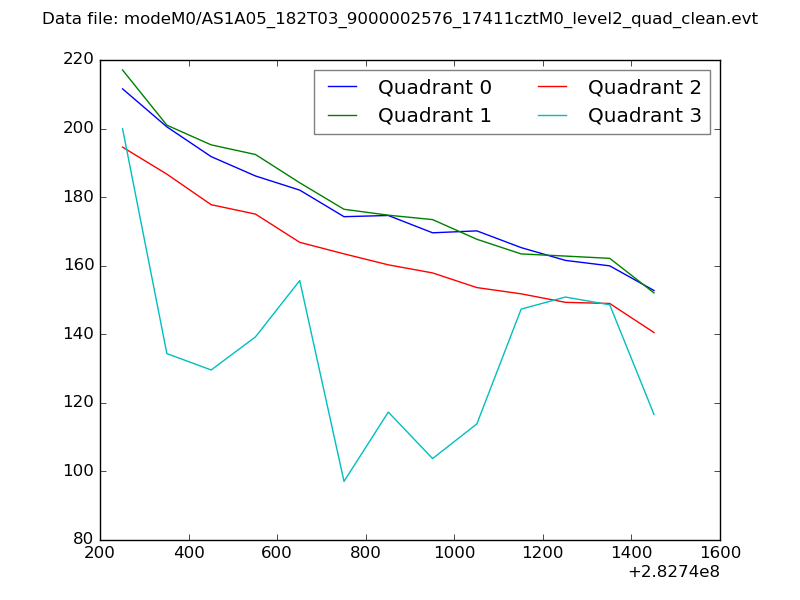
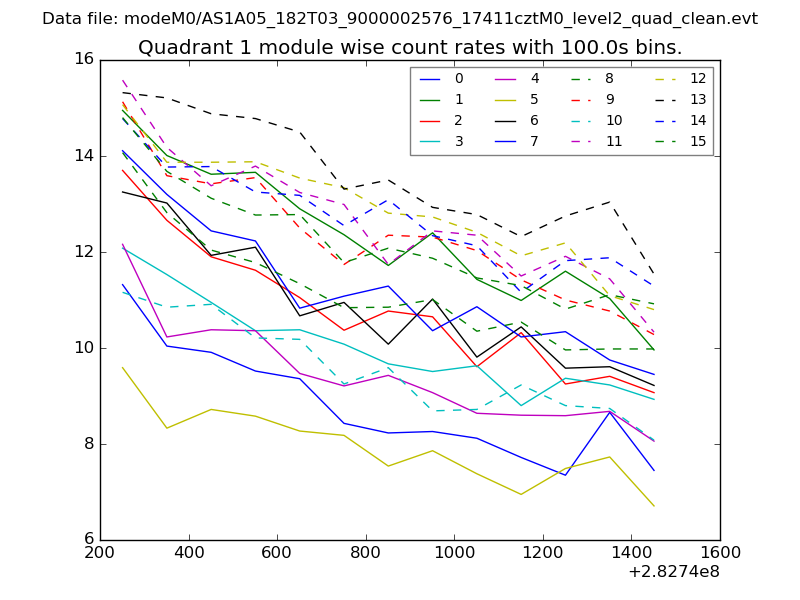
| Quadrant-wise count rates Data is divided into 100 sec bins |
 |
|
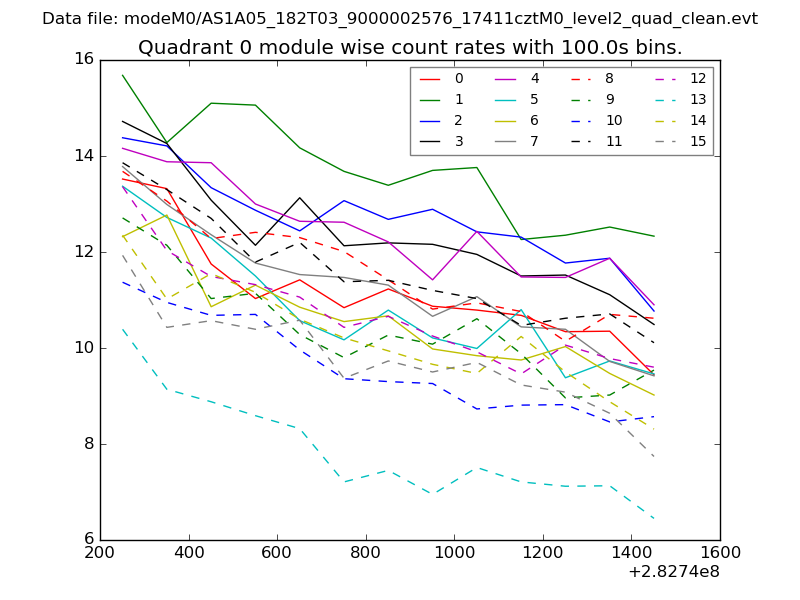
| Module-wise count rates for Quadrant A Data is divided into 100 sec bins |
 |
 |
| Module-wise count rates for Quadrant B Data is divided into 100 sec bins |
 |
 |
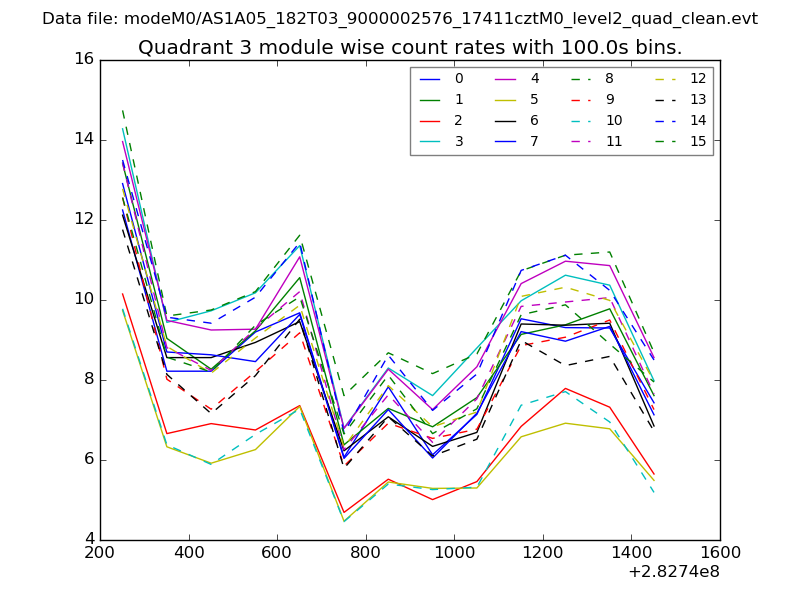
| Module-wise count rates for Quadrant C Data is divided into 100 sec bins |
 |
 |
| Module-wise count rates for Quadrant D Data is divided into 100 sec bins |
 |
 |
| Parameter | Plot |
|---|---|
| CZT HV Monitor | 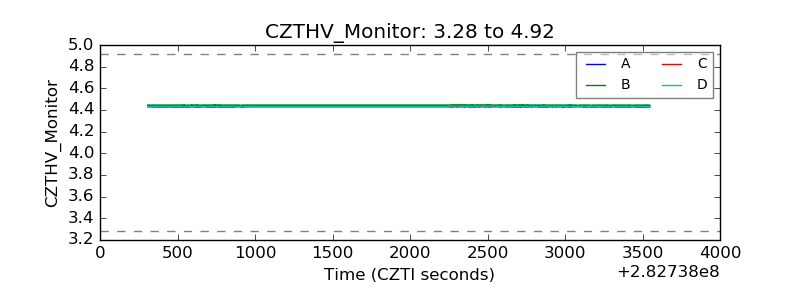 |
| D_VDD | 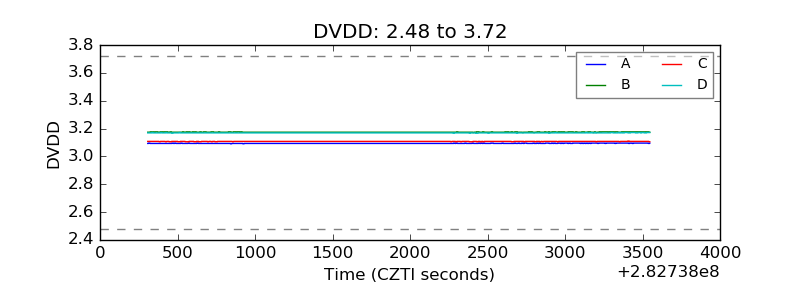 |
| Temperature 1 | 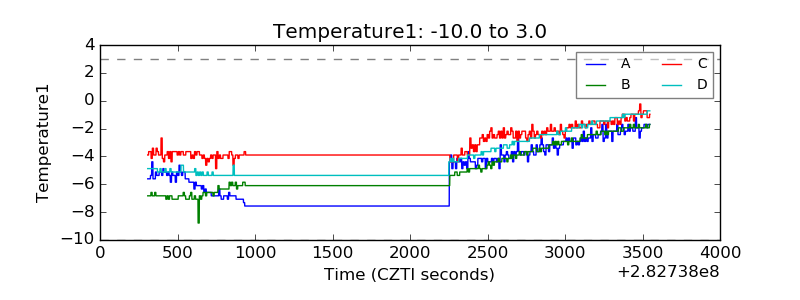 |
| Veto HV Monitor | 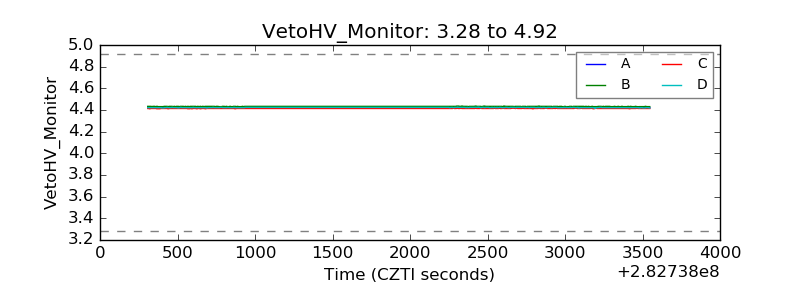 |
| Veto LLD | 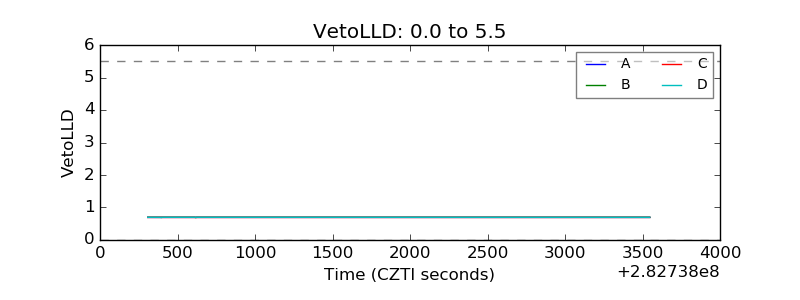 |
| Alpha Counter | 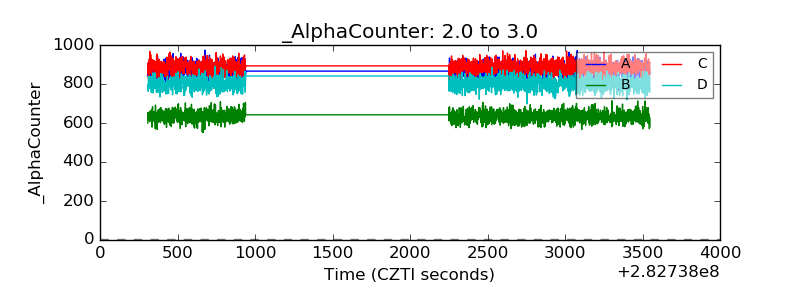 |
| _CPM_Rate | 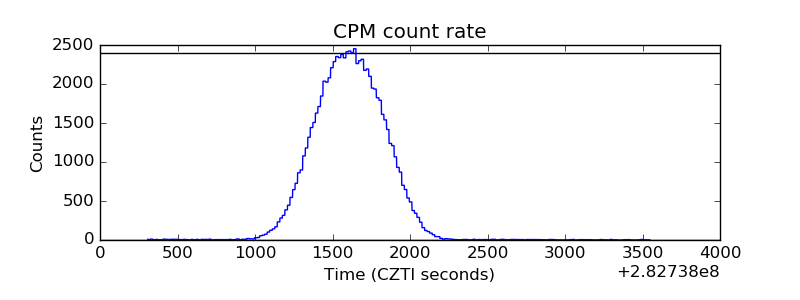 |
| CZT Counter | 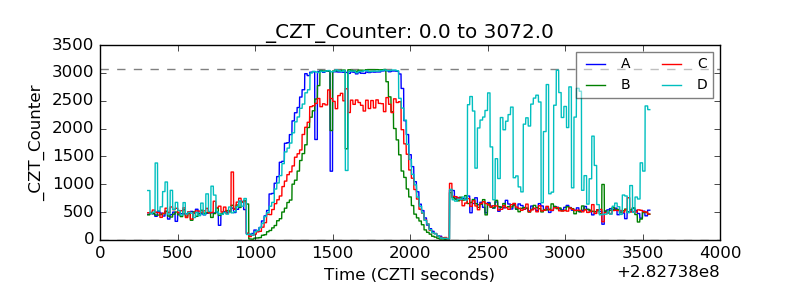 |
| +2.5 Volts monitor | 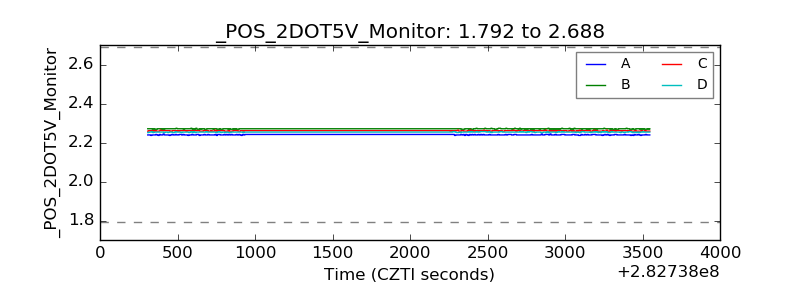 |
| +5 Volts monitor |  |
| _ROLL_ROT | 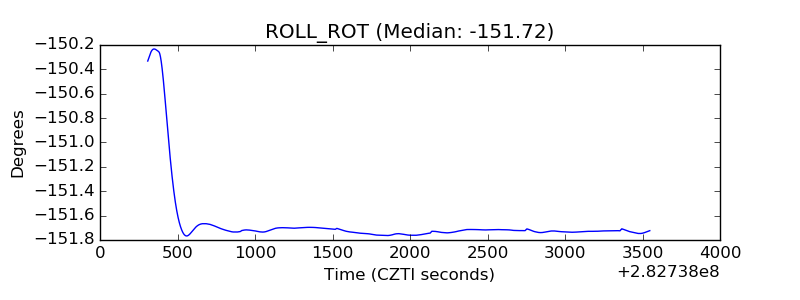 |
| _Roll_DEC | 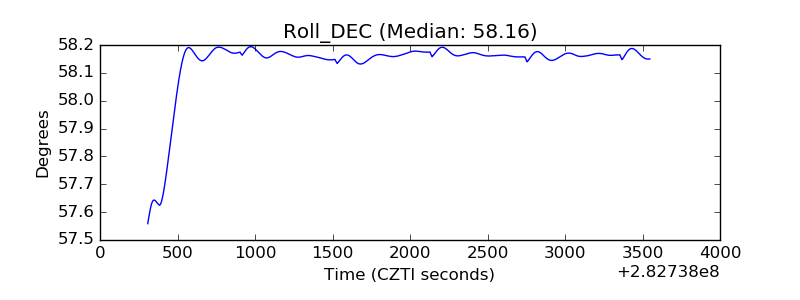 |
| _Roll_RA | 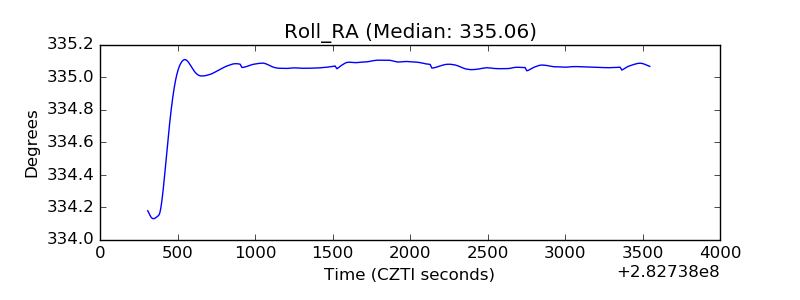 |
| Veto Counter | 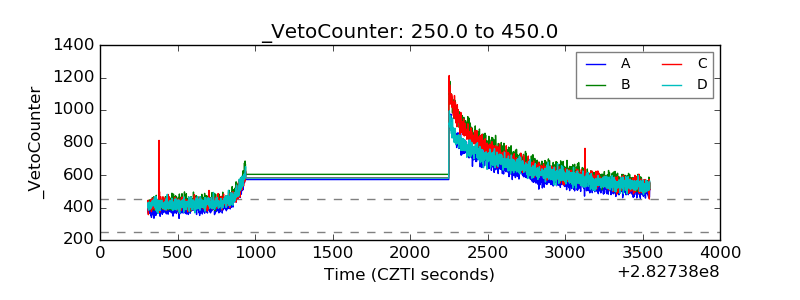 |