| Param | Original file | Final file |
|---|---|---|
| Filename | modeM0/AS1A05_182T03_9000002576_17412cztM0_level2.evt | modeM0/AS1A05_182T03_9000002576_17412cztM0_level2_quad_clean.evt |
| Size (bytes) | 531,469,440 | 105,436,800 |
| Size | 506.8 MB | 100.6 MB |
| Events in quadrant A | 2,997,359 | 740,912 |
| Events in quadrant B | 3,129,461 | 736,549 |
| Events in quadrant C | 3,061,612 | 686,929 |
| Events in quadrant D | 6,509,770 | 618,906 |
| Mode M0 | |||
|---|---|---|---|
| Quadrant | BADHDUFLAG | Total packets | Discarded packets |
| A | 0 | 12477 | 1 |
| B | 0 | 12844 | 1 |
| C | 0 | 12391 | 1 |
| D | 0 | 23368 | 1 |
| Mode SS | |||
|---|---|---|---|
| Quadrant | BADHDUFLAG | Total packets | Discarded packets |
| A | 0 | 120 | 0 |
| B | 0 | 120 | 0 |
| C | 0 | 120 | 0 |
| D | 0 | 120 | 0 |
| Mode M9 | |||
|---|---|---|---|
| Quadrant | BADHDUFLAG | Total packets | Discarded packets |
| A | 0 | 13 | 0 |
| B | 0 | 13 | 0 |
| C | 0 | 13 | 0 |
| D | 0 | 13 | 0 |
| Quadrant | Total seconds | Saturated seconds | Saturation percentage |
|---|---|---|---|
| A | 5858 | 63 | 1.075452% |
| B | 5859 | 61 | 1.041133% |
| C | 5859 | 66 | 1.126472% |
| D | 5859 | 1035 | 17.665131% |
Noise dominated data is calculated using 1-second bins in cleaned event files. If a bin has >2000 counts, and if more than 50% of those come from <1% of pixels, then it is considered to be noise-dominated and hence unusable.
| Quadrant | # 1 sec bins | Bins with >0 counts | Bins with >2000 counts | High rate bins dominated by noise | Noise dominated (total time) | Noise dominated (detector-on time) | Marked lightcurve |
|---|---|---|---|---|---|---|---|
| A | 7198 | 5859 | 1 | 1 | 0.01% | 0.02% | 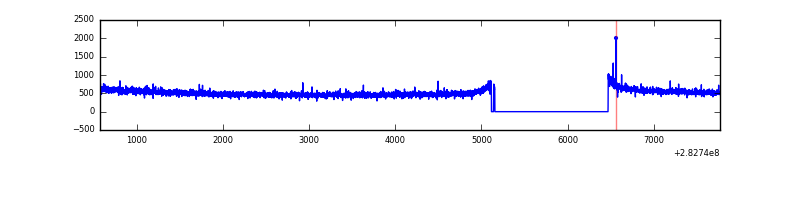 |
| B | 7199 | 5861 | 5 | 5 | 0.07% | 0.09% | 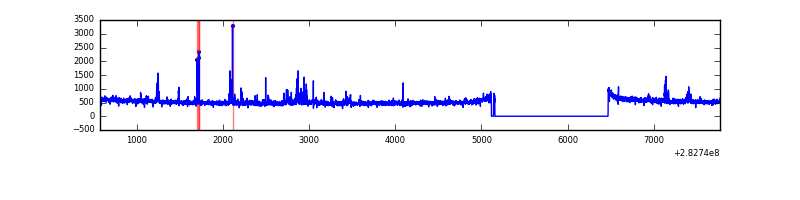 |
| C | 7199 | 5861 | 0 | 0 | 0.00% | 0.00% | 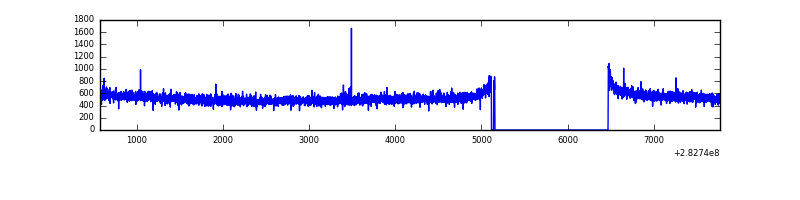 |
| D | 7199 | 5861 | 933 | 933 | 12.96% | 15.92% | 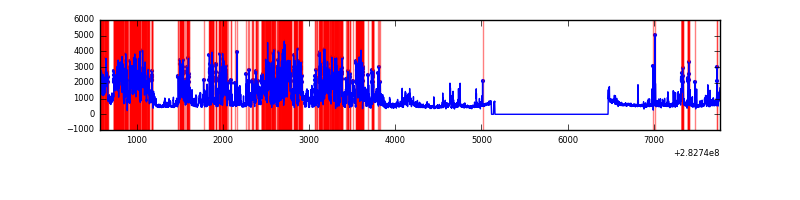 |
Top three noisy pixels from each quadrant. If the there are fewer than three noisy pixels in the level2.evt file, extra rows are filled as -1
| Pixel properties | Quadrant properties | ||||||
|---|---|---|---|---|---|---|---|
| Quadrant | DetID | PixID | Counts | Sigma | Mean | Median | Sigma |
| A | 6 | 16 | 7039 | 40.76 | 778 | 763 | 154.0 |
| A | 0 | 226 | 6964 | 40.27 | 778 | 763 | 154.0 |
| A | 12 | 194 | 5889 | 33.29 | 778 | 763 | 154.0 |
| B | 0 | 197 | 45065 | 313.58 | 764 | 749 | 141.3 |
| B | 4 | 216 | 43984 | 305.93 | 764 | 749 | 141.3 |
| B | 0 | 230 | 39782 | 276.2 | 764 | 749 | 141.3 |
| C | 14 | 238 | 115578 | 690.54 | 725 | 730 | 166.3 |
| C | 5 | 218 | 64394 | 382.79 | 725 | 730 | 166.3 |
| C | 5 | 219 | 31272 | 183.64 | 725 | 730 | 166.3 |
| D | 11 | 176 | 3424968 | 20138.21 | 709 | 690 | 170.0 |
| D | 13 | 189 | 141713 | 829.36 | 709 | 690 | 170.0 |
| D | 13 | 232 | 123939 | 724.83 | 709 | 690 | 170.0 |
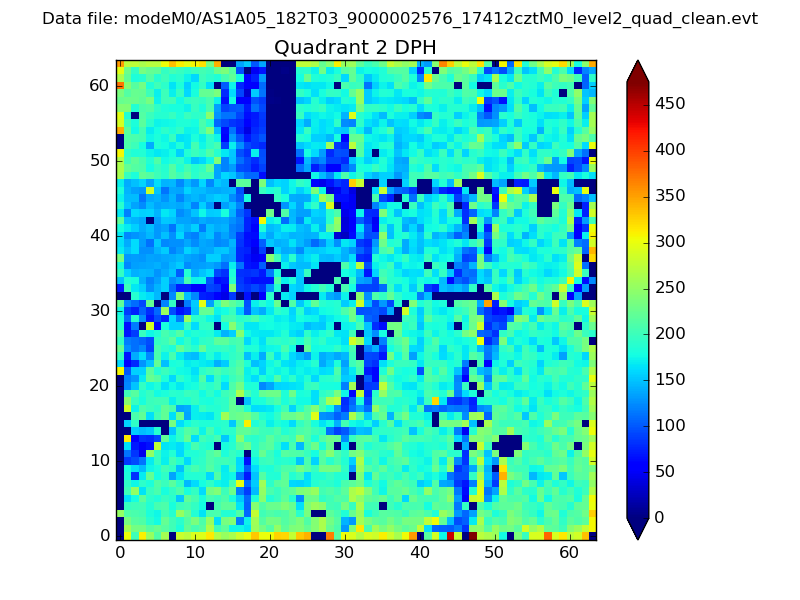
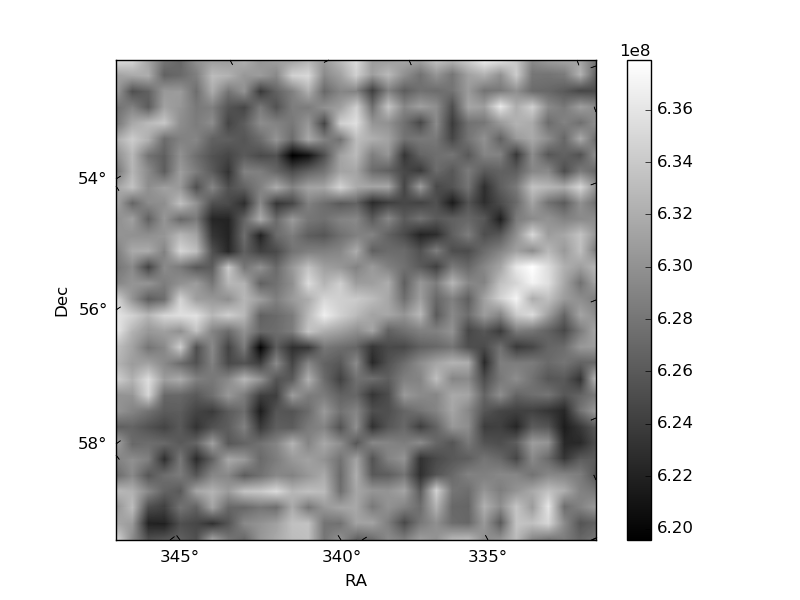
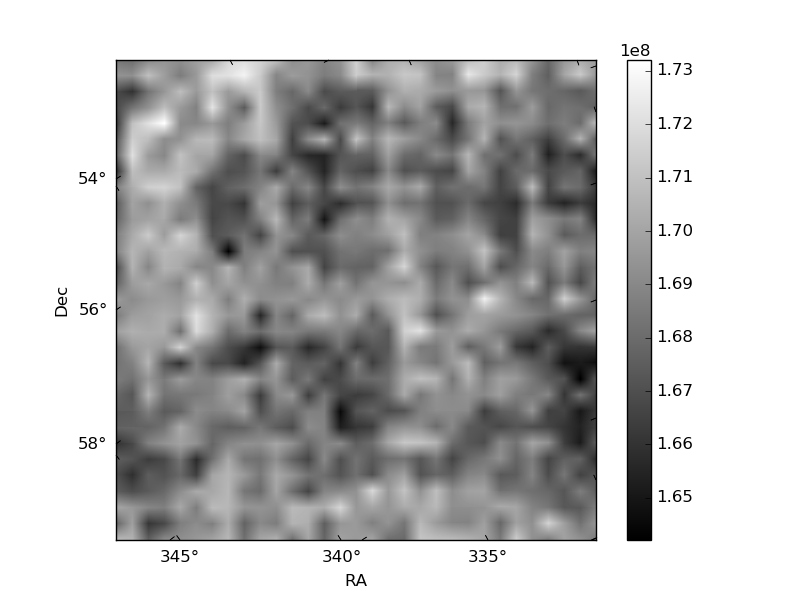
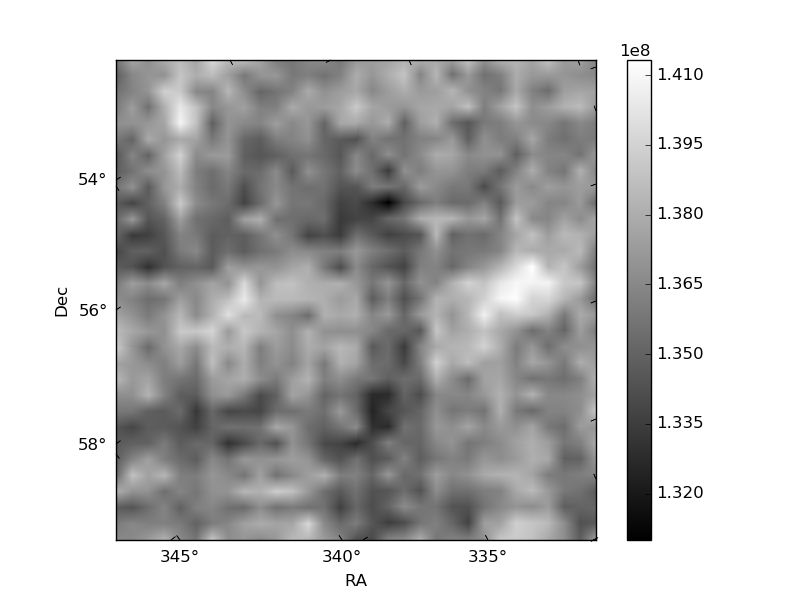
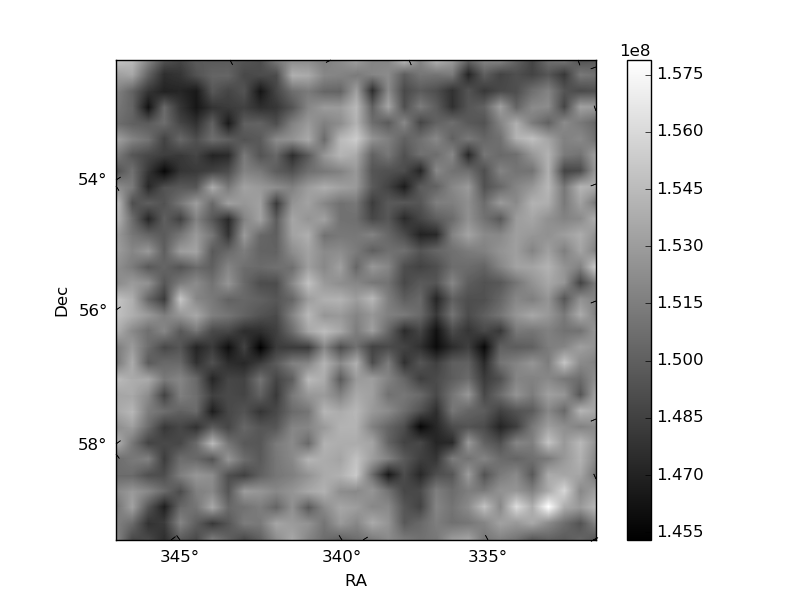
Histogram calculated using DETX and DETY for each event in the final _common_clean file
| Quadrant A | 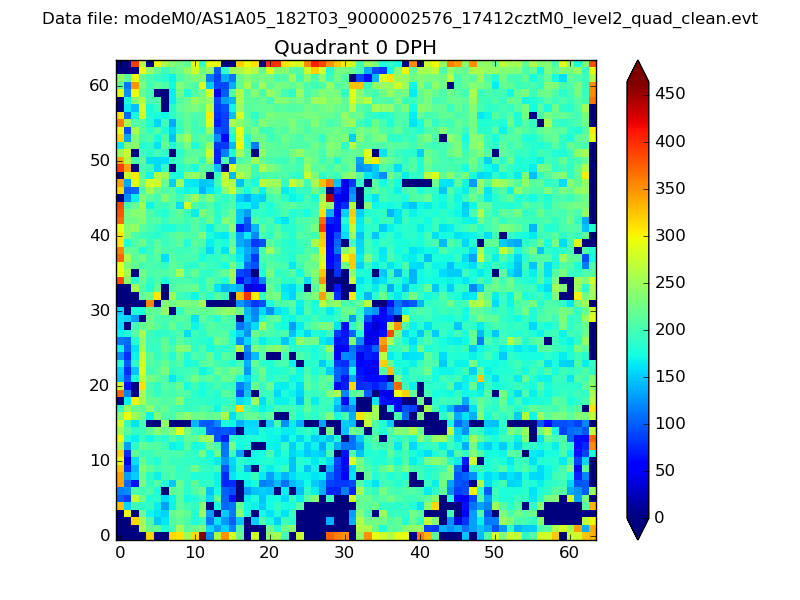 |
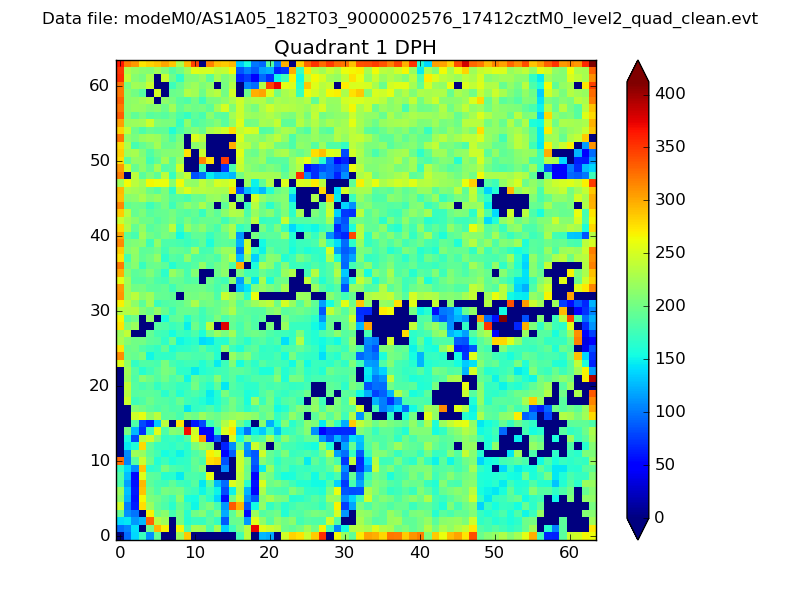 |
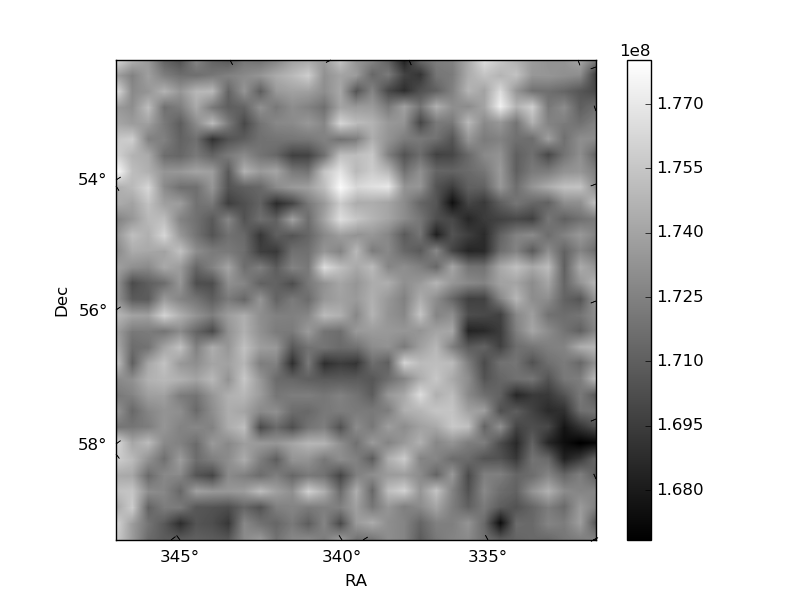
Quadrant B |
|---|---|---|---|
| Quadrant D | 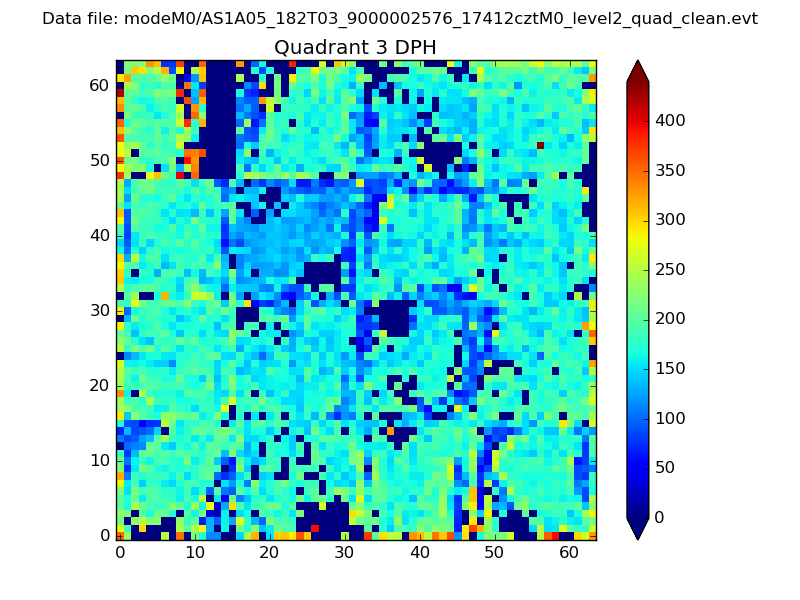 |
 |
Quadrant C |
| Plot type | Count rate plots | Images |
|---|---|---|
| Comparison with Poisson distribution Blue bars denote a histogram of data divided into 1 sec bins. Red curve is a Poisson curve with rate = median count rate of data. |
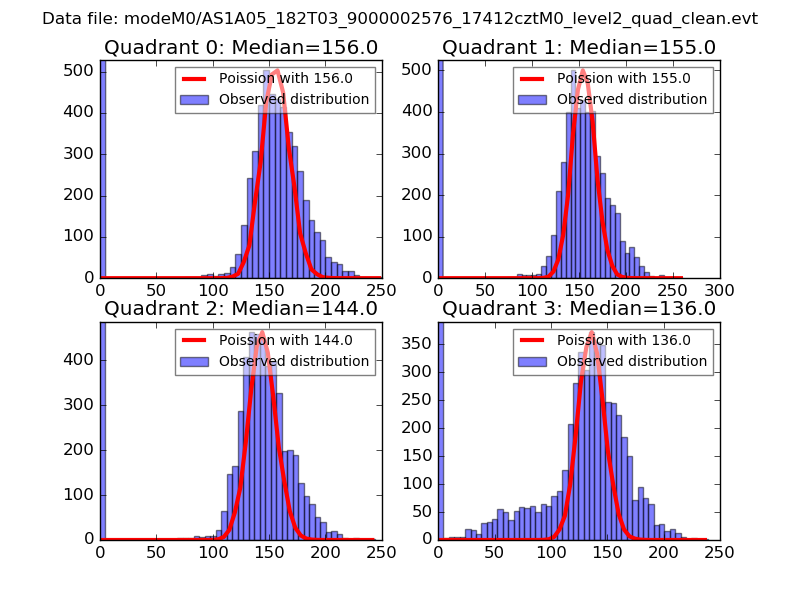 |
 |
| Quadrant-wise count rates Data is divided into 100 sec bins |
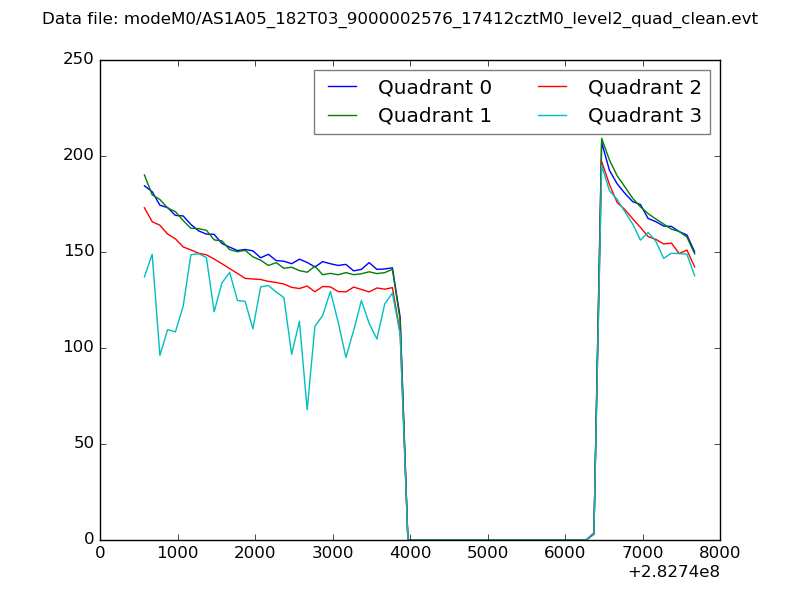 |
|
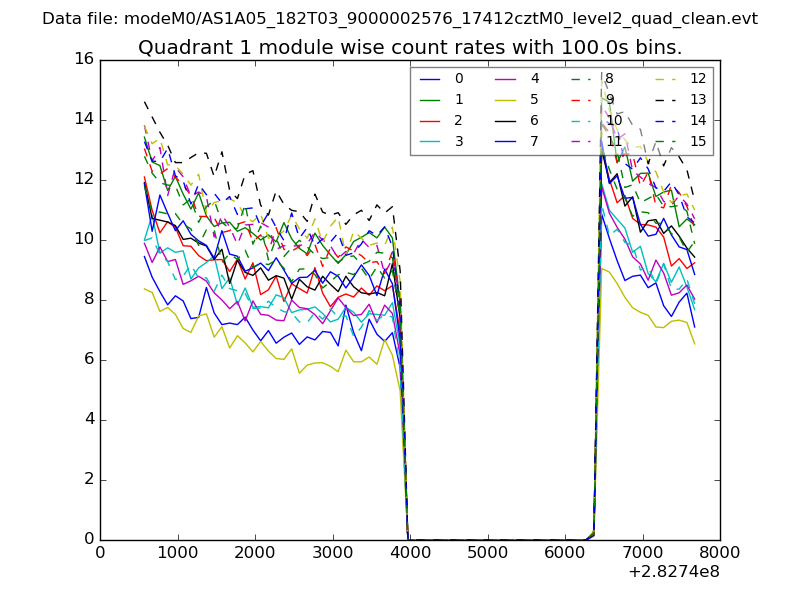
| Module-wise count rates for Quadrant A Data is divided into 100 sec bins |
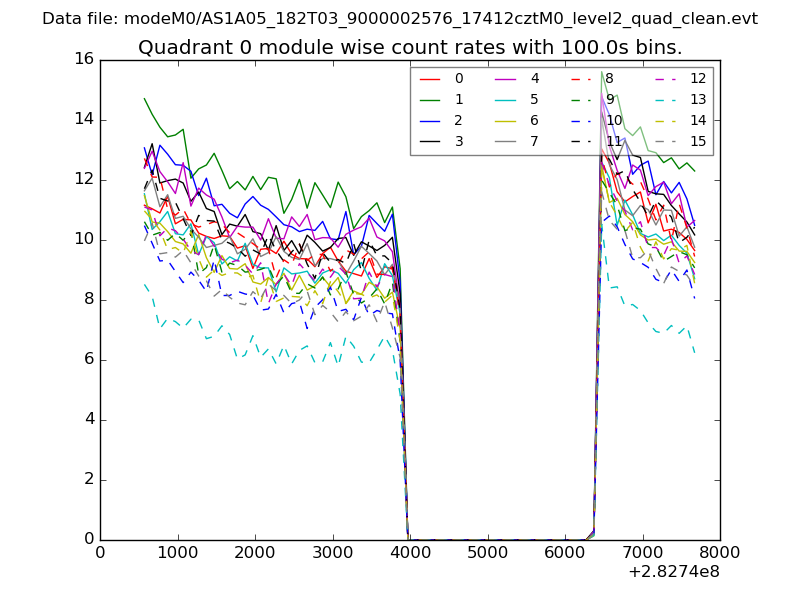 |
 |
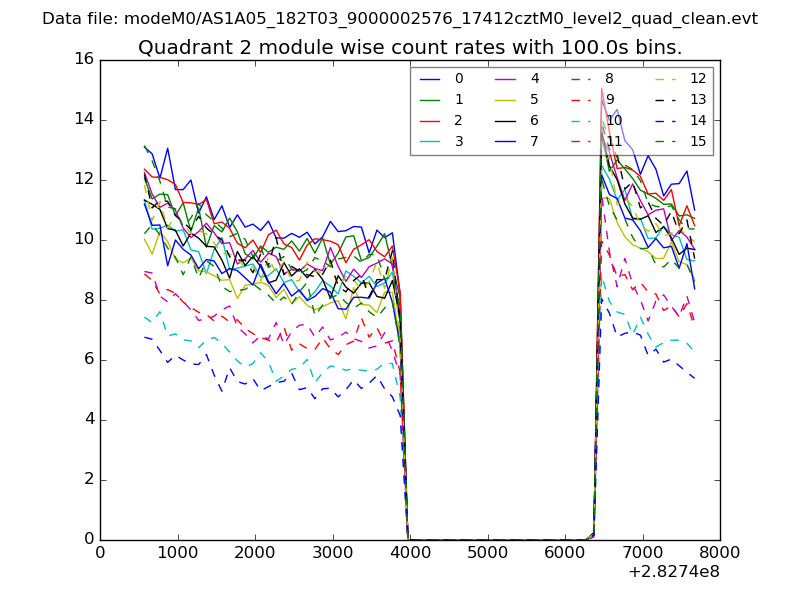
| Module-wise count rates for Quadrant B Data is divided into 100 sec bins |
 |
 |
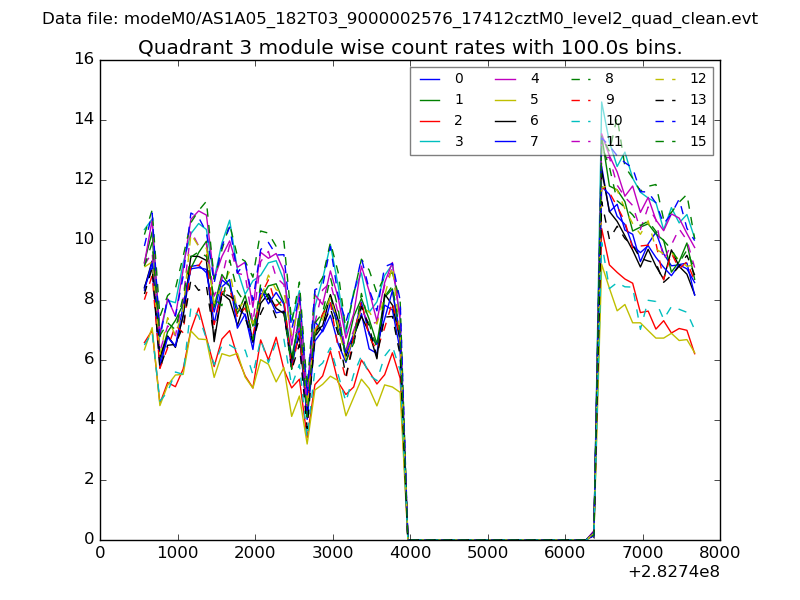
| Module-wise count rates for Quadrant C Data is divided into 100 sec bins |
 |
 |
| Module-wise count rates for Quadrant D Data is divided into 100 sec bins |
 |
 |
| Parameter | Plot |
|---|---|
| CZT HV Monitor | 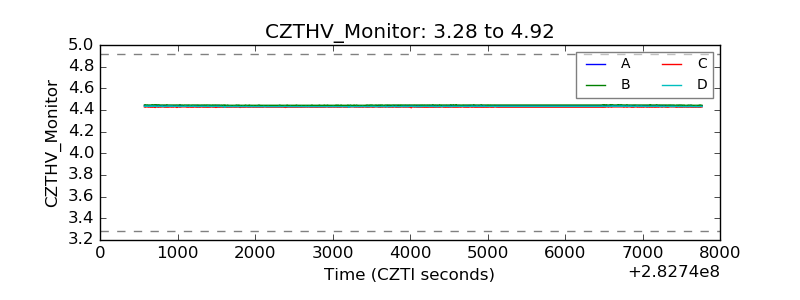 |
| D_VDD | 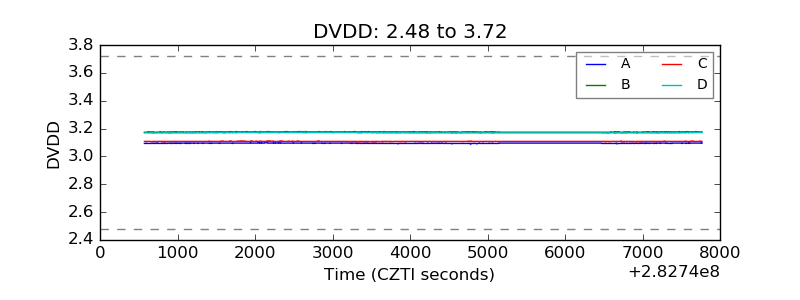 |
| Temperature 1 | 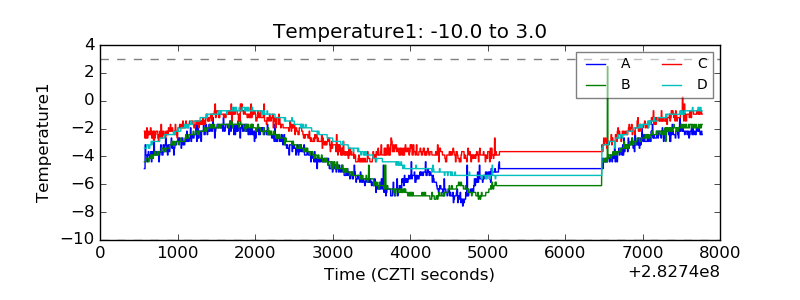 |
| Veto HV Monitor | 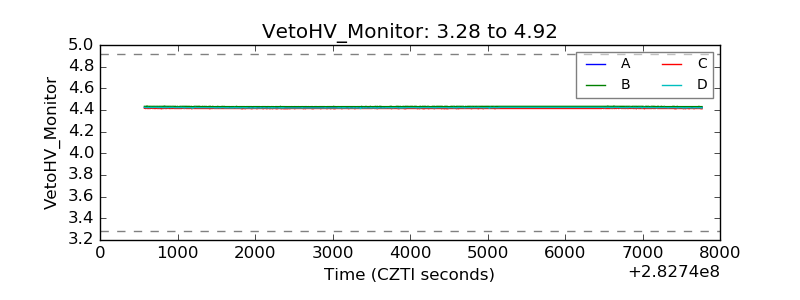 |
| Veto LLD | 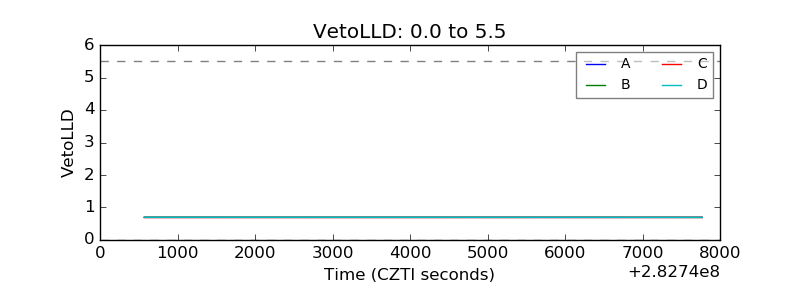 |
| Alpha Counter | 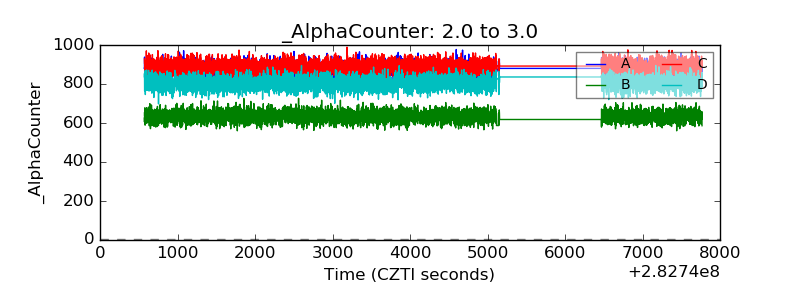 |
| _CPM_Rate | 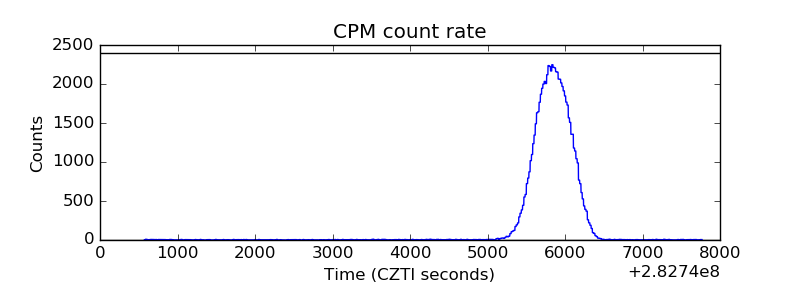 |
| CZT Counter | 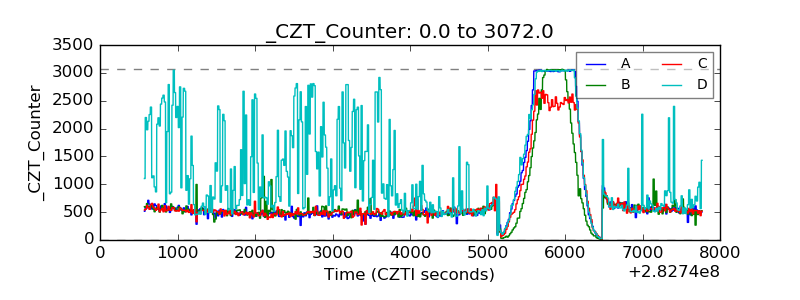 |
| +2.5 Volts monitor |  |
| +5 Volts monitor |  |
| _ROLL_ROT | 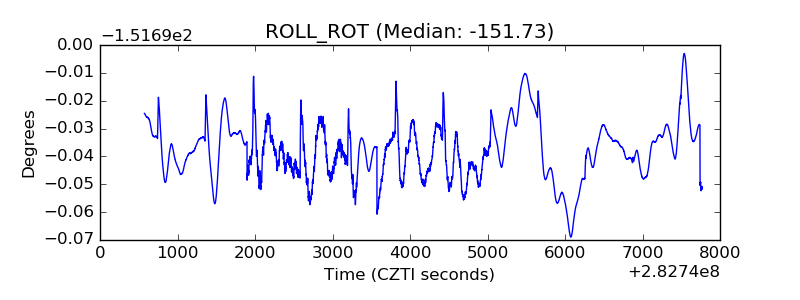 |
| _Roll_DEC | 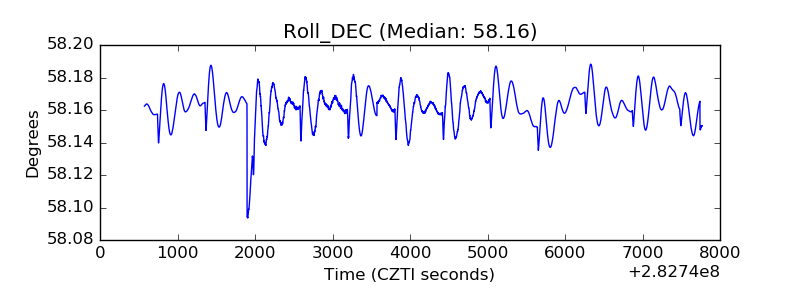 |
| _Roll_RA | 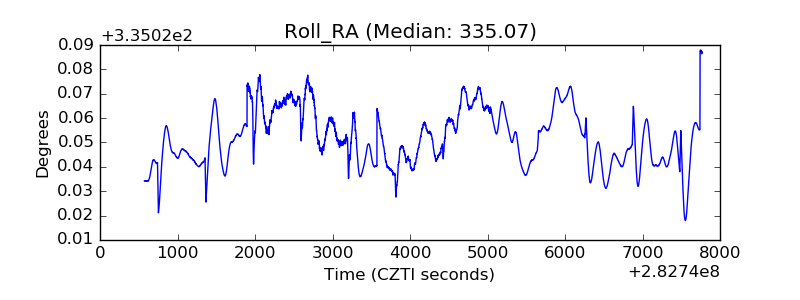 |
| Veto Counter | 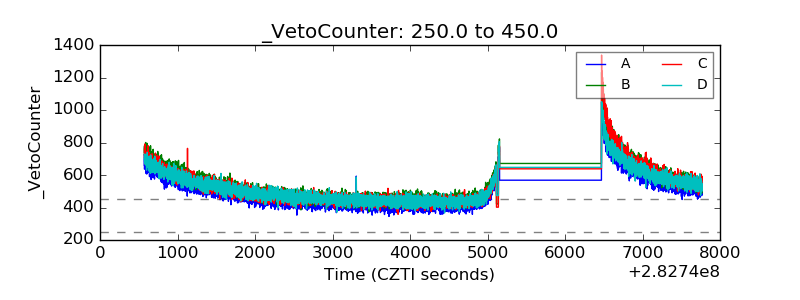 |