| Param | Original file | Final file |
|---|---|---|
| Filename | modeM0/AS1A05_182T03_9000002576_17413cztM0_level2.evt | modeM0/AS1A05_182T03_9000002576_17413cztM0_level2_quad_clean.evt |
| Size (bytes) | 551,324,160 | 96,955,200 |
| Size | 525.8 MB | 92.5 MB |
| Events in quadrant A | 3,024,242 | 661,444 |
| Events in quadrant B | 3,212,132 | 661,010 |
| Events in quadrant C | 3,056,850 | 624,835 |
| Events in quadrant D | 7,000,934 | 573,319 |
| Mode M0 | |||
|---|---|---|---|
| Quadrant | BADHDUFLAG | Total packets | Discarded packets |
| A | 0 | 12635 | 1 |
| B | 0 | 13149 | 1 |
| C | 0 | 12405 | 1 |
| D | 0 | 24851 | 1 |
| Mode SS | |||
|---|---|---|---|
| Quadrant | BADHDUFLAG | Total packets | Discarded packets |
| A | 0 | 120 | 0 |
| B | 0 | 120 | 0 |
| C | 0 | 120 | 0 |
| D | 0 | 120 | 0 |
| Mode M9 | |||
|---|---|---|---|
| Quadrant | BADHDUFLAG | Total packets | Discarded packets |
| A | 0 | 13 | 0 |
| B | 0 | 13 | 0 |
| C | 0 | 13 | 0 |
| D | 0 | 13 | 0 |
| Quadrant | Total seconds | Saturated seconds | Saturation percentage |
|---|---|---|---|
| A | 5946 | 86 | 1.446350% |
| B | 5947 | 98 | 1.647890% |
| C | 5947 | 102 | 1.715150% |
| D | 5946 | 1080 | 18.163471% |
Noise dominated data is calculated using 1-second bins in cleaned event files. If a bin has >2000 counts, and if more than 50% of those come from <1% of pixels, then it is considered to be noise-dominated and hence unusable.
| Quadrant | # 1 sec bins | Bins with >0 counts | Bins with >2000 counts | High rate bins dominated by noise | Noise dominated (total time) | Noise dominated (detector-on time) | Marked lightcurve |
|---|---|---|---|---|---|---|---|
| A | 7266 | 5947 | 2 | 2 | 0.03% | 0.03% | 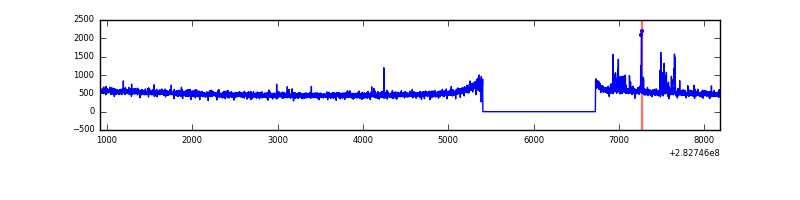 |
| B | 7267 | 5948 | 16 | 16 | 0.22% | 0.27% | 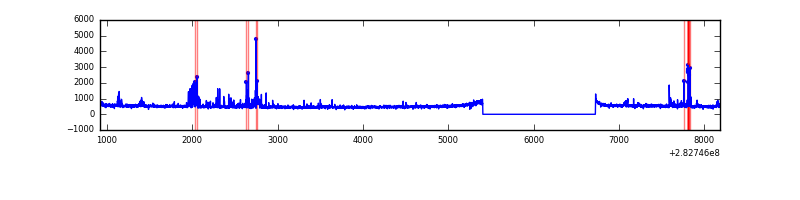 |
| C | 7267 | 5948 | 0 | 0 | 0.00% | 0.00% | 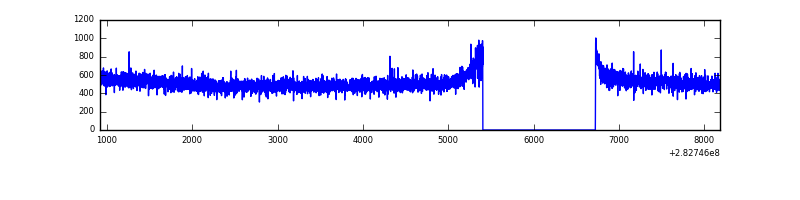 |
| D | 7266 | 5947 | 1010 | 1010 | 13.90% | 16.98% | 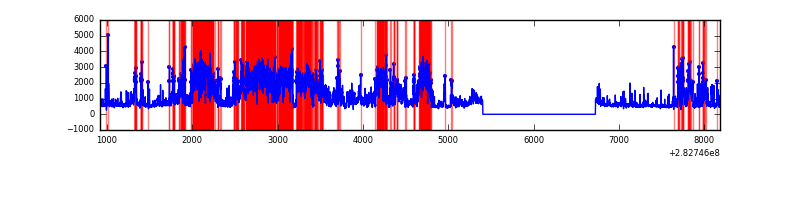 |
Top three noisy pixels from each quadrant. If the there are fewer than three noisy pixels in the level2.evt file, extra rows are filled as -1
| Pixel properties | Quadrant properties | ||||||
|---|---|---|---|---|---|---|---|
| Quadrant | DetID | PixID | Counts | Sigma | Mean | Median | Sigma |
| A | 6 | 16 | 67610 | 438.41 | 768 | 752 | 152.5 |
| A | 0 | 226 | 6682 | 38.89 | 768 | 752 | 152.5 |
| A | 12 | 194 | 5964 | 34.18 | 768 | 752 | 152.5 |
| B | 0 | 197 | 147297 | 1041.64 | 757 | 740 | 140.7 |
| B | 4 | 216 | 47527 | 332.53 | 757 | 740 | 140.7 |
| B | 5 | 172 | 30768 | 213.42 | 757 | 740 | 140.7 |
| C | 14 | 238 | 114990 | 675.42 | 731 | 738 | 169.2 |
| C | 5 | 218 | 56685 | 330.74 | 731 | 738 | 169.2 |
| C | 5 | 219 | 24056 | 137.85 | 731 | 738 | 169.2 |
| D | 11 | 176 | 3519001 | 20657.81 | 717 | 698 | 170.3 |
| D | 13 | 232 | 479219 | 2809.65 | 717 | 698 | 170.3 |
| D | 13 | 189 | 119816 | 699.4 | 717 | 698 | 170.3 |
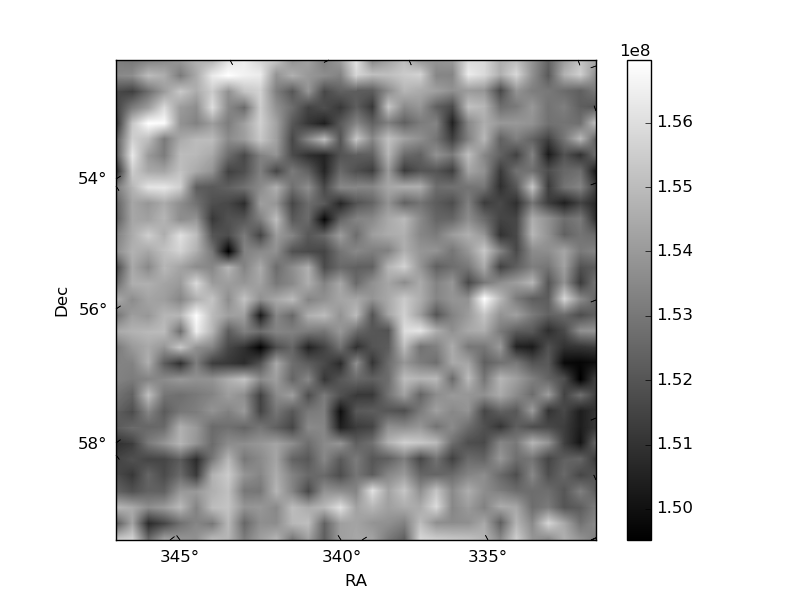
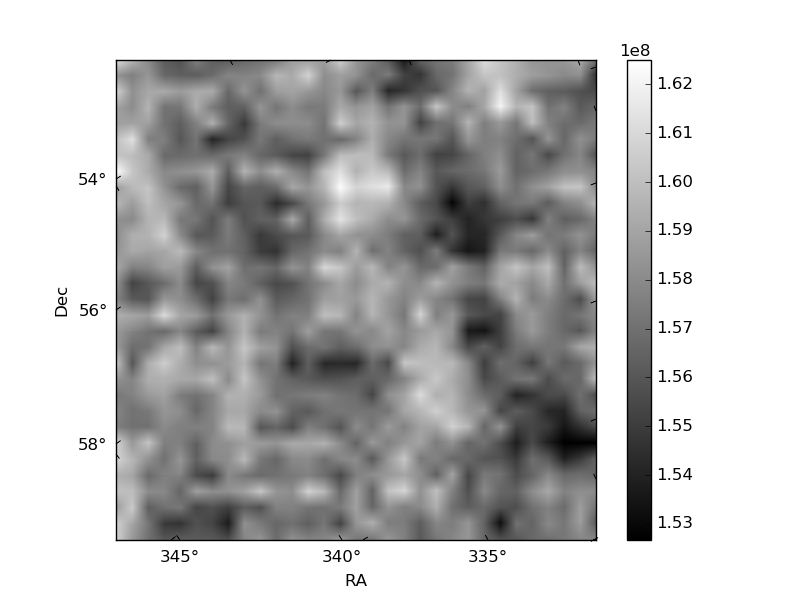
Histogram calculated using DETX and DETY for each event in the final _common_clean file
| Quadrant A |  |
 |
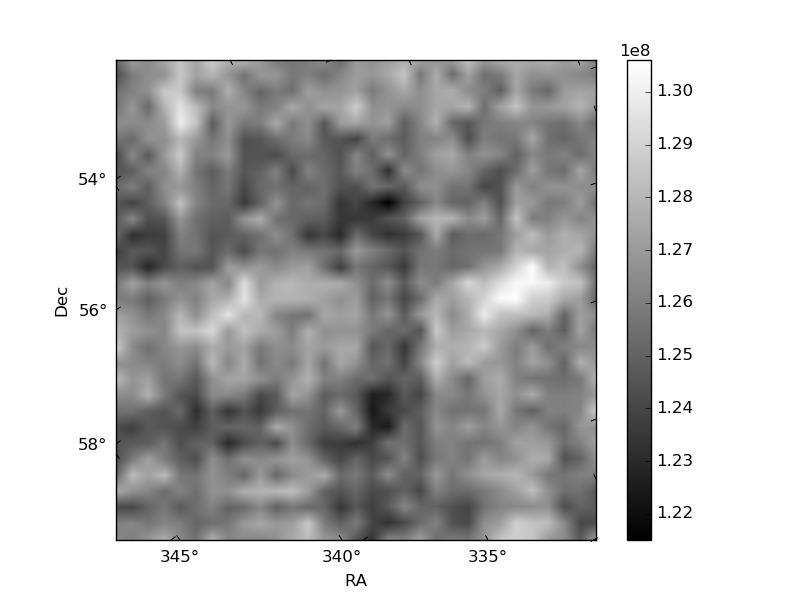
Quadrant B |
|---|---|---|---|
| Quadrant D |  |
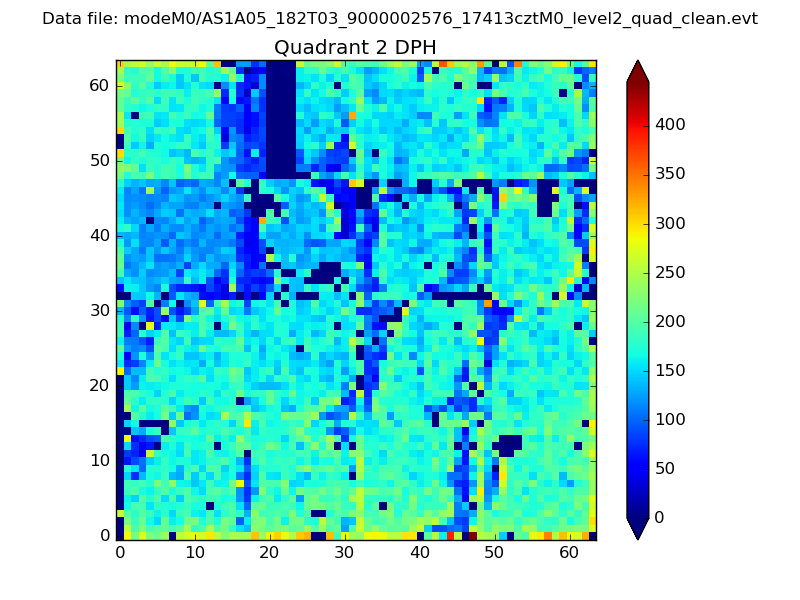 |
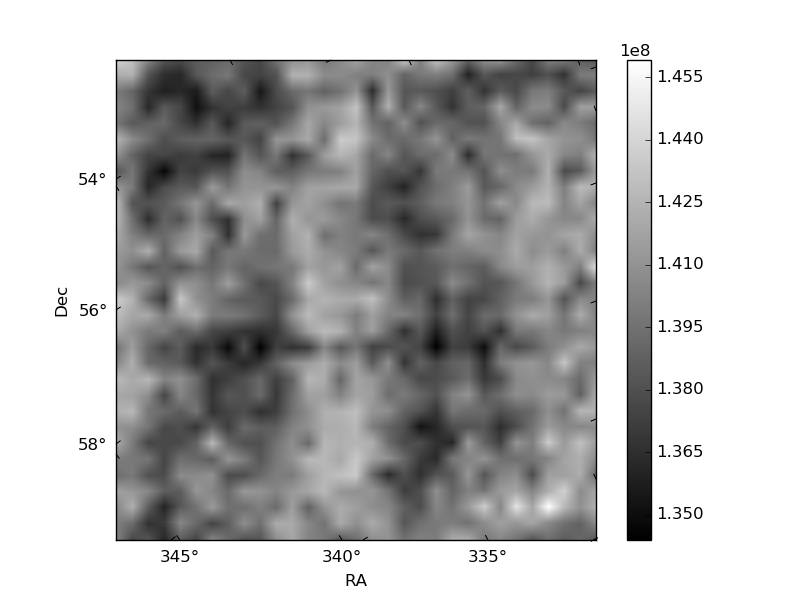
Quadrant C |
| Plot type | Count rate plots | Images |
|---|---|---|
| Comparison with Poisson distribution Blue bars denote a histogram of data divided into 1 sec bins. Red curve is a Poisson curve with rate = median count rate of data. |
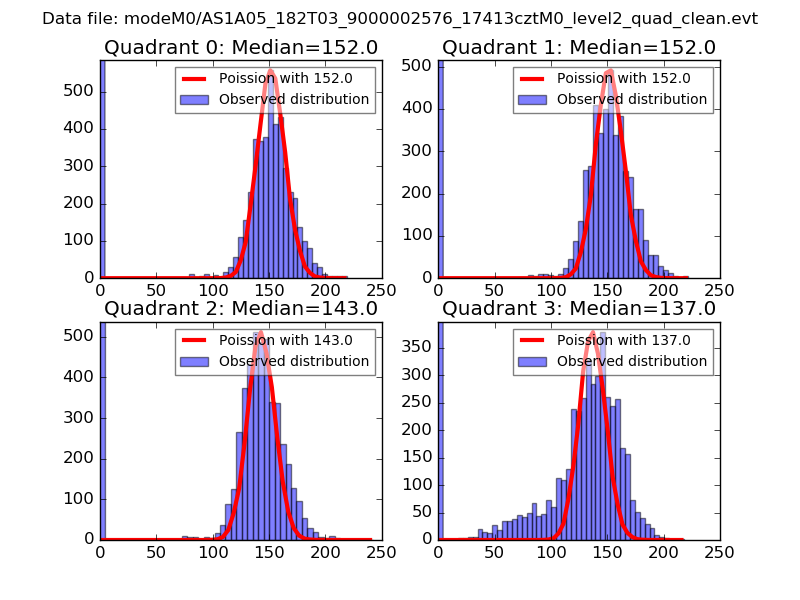 |
 |
| Quadrant-wise count rates Data is divided into 100 sec bins |
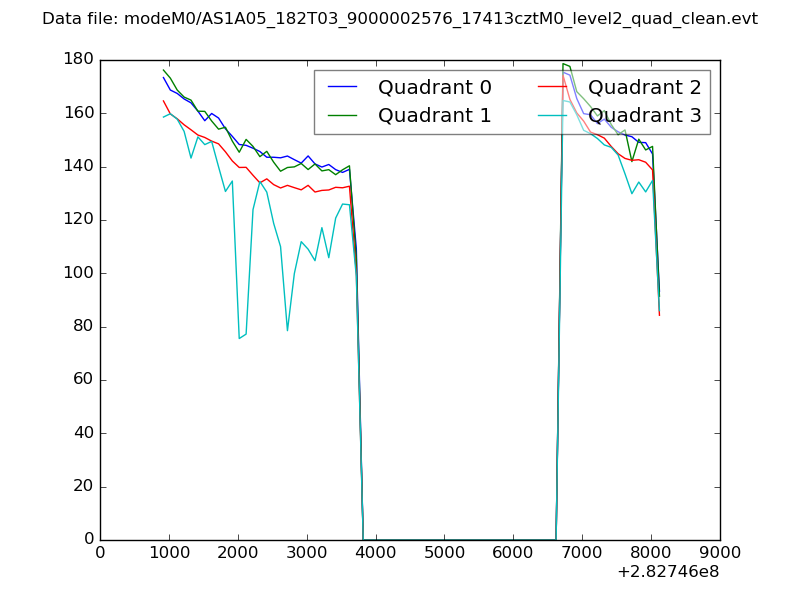 |
|
| Module-wise count rates for Quadrant A Data is divided into 100 sec bins |
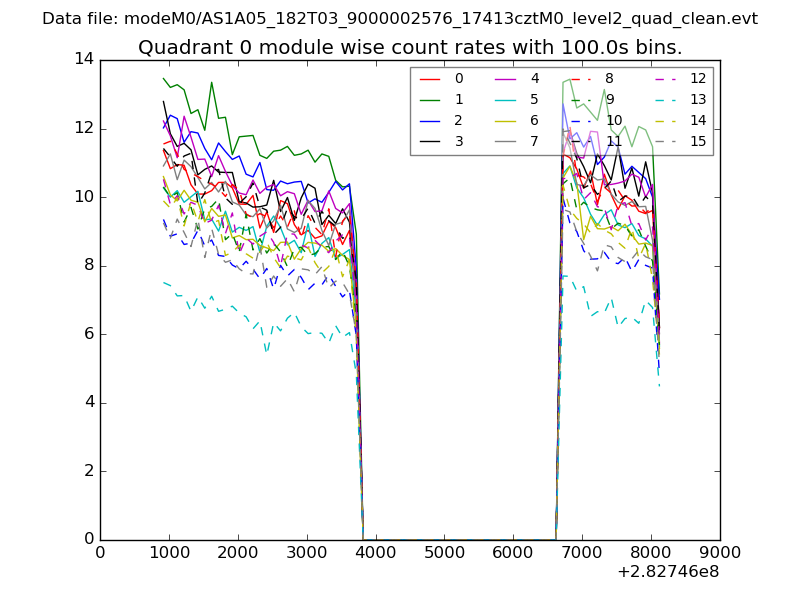 |
 |
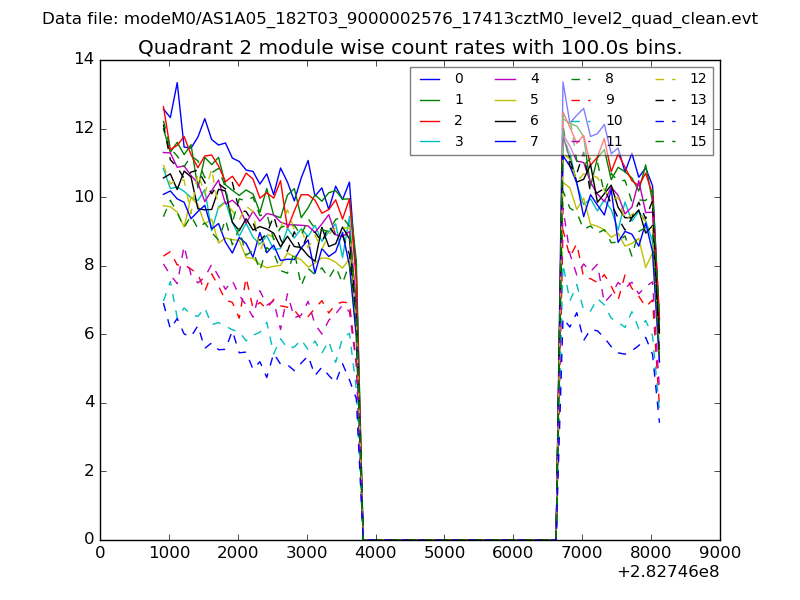
| Module-wise count rates for Quadrant B Data is divided into 100 sec bins |
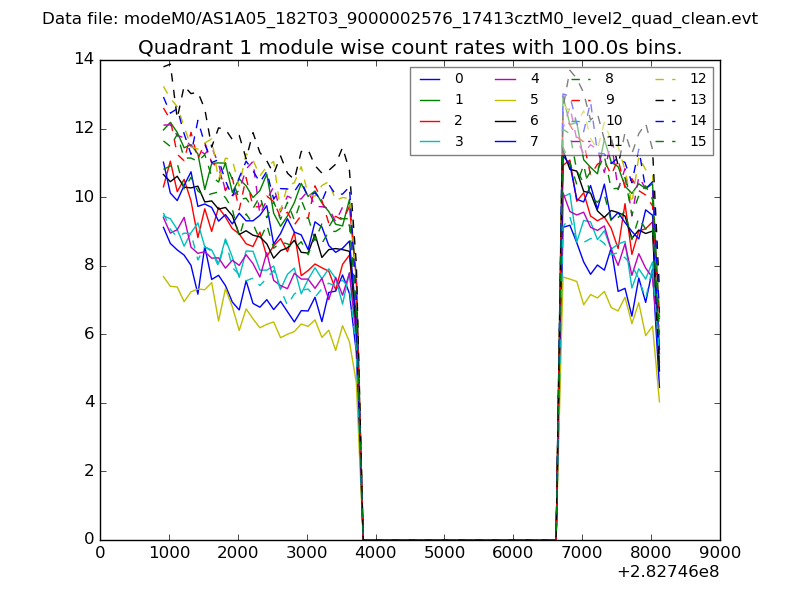 |
 |
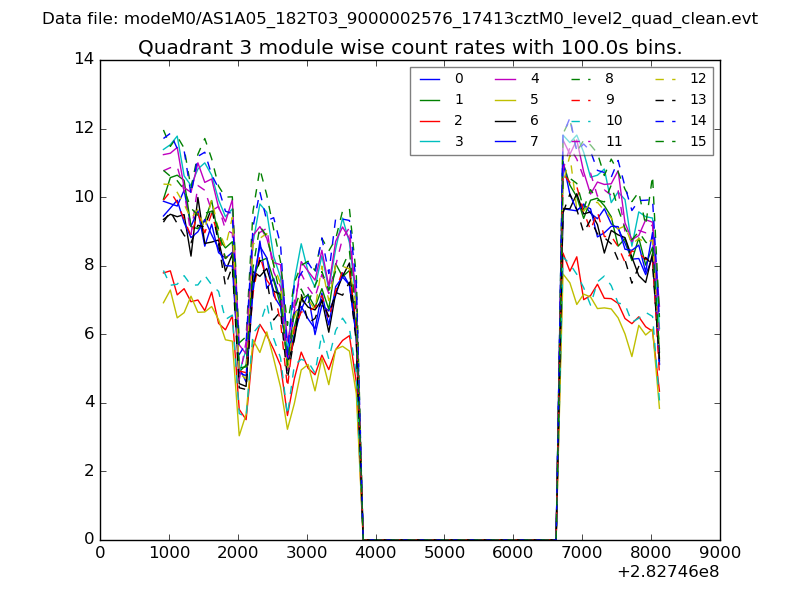
| Module-wise count rates for Quadrant C Data is divided into 100 sec bins |
 |
 |
| Module-wise count rates for Quadrant D Data is divided into 100 sec bins |
 |
 |
| Parameter | Plot |
|---|---|
| CZT HV Monitor | 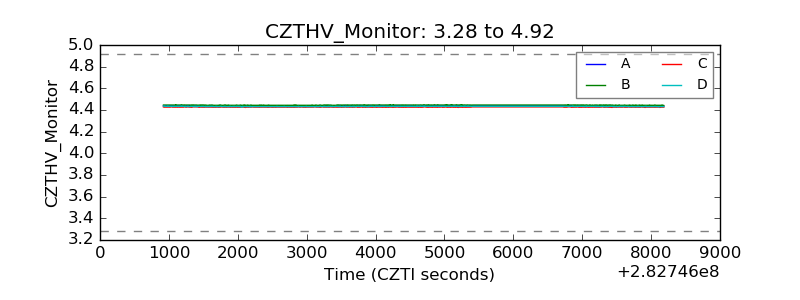 |
| D_VDD | 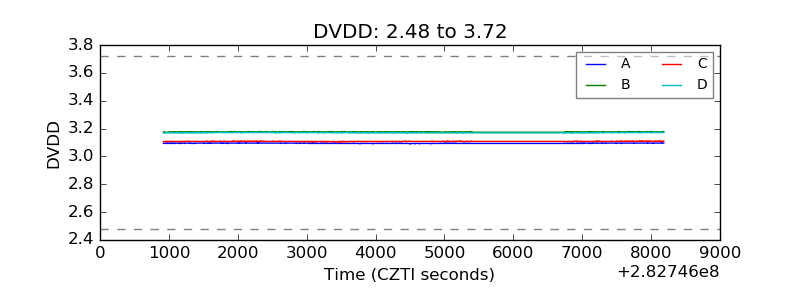 |
| Temperature 1 | 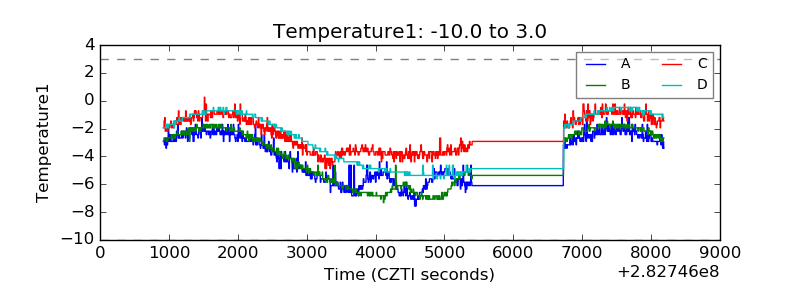 |
| Veto HV Monitor | 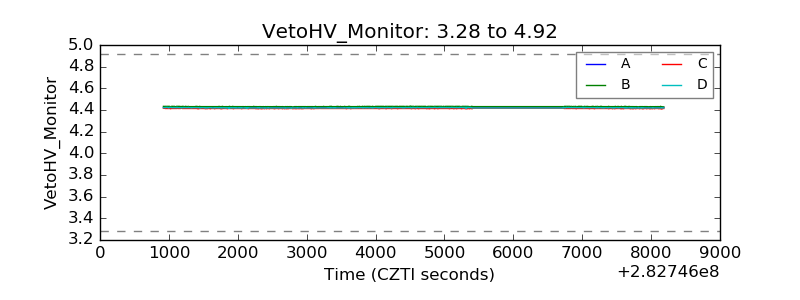 |
| Veto LLD | 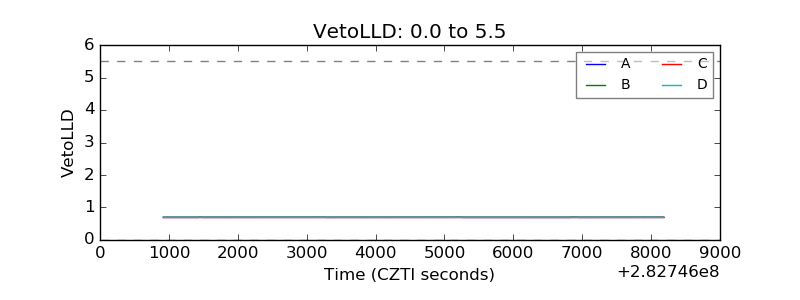 |
| Alpha Counter | 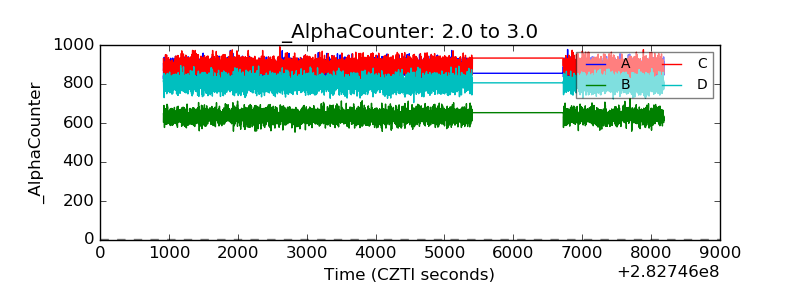 |
| _CPM_Rate | 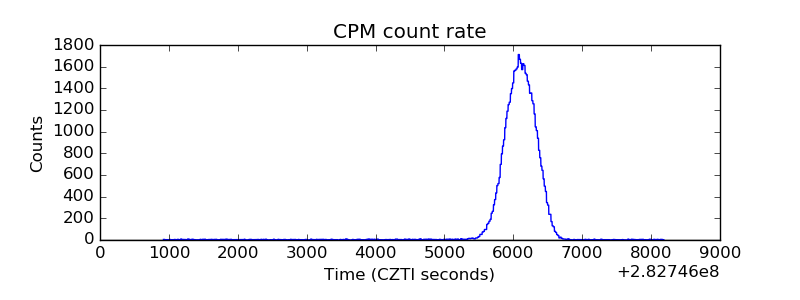 |
| CZT Counter | 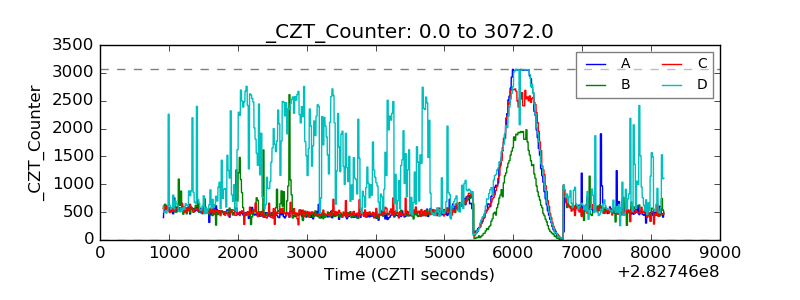 |
| +2.5 Volts monitor |  |
| +5 Volts monitor | 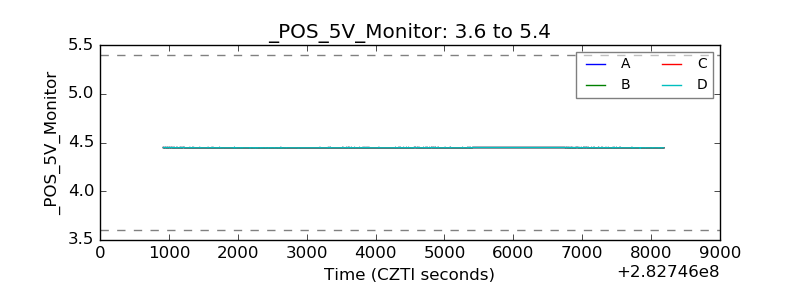 |
| _ROLL_ROT | 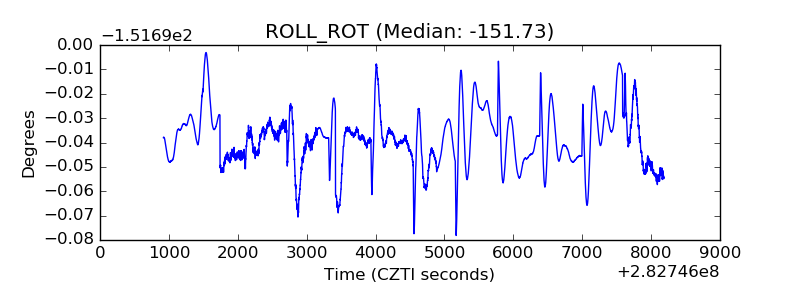 |
| _Roll_DEC | 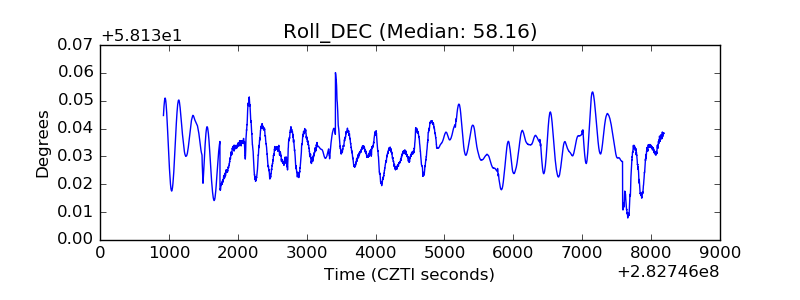 |
| _Roll_RA | 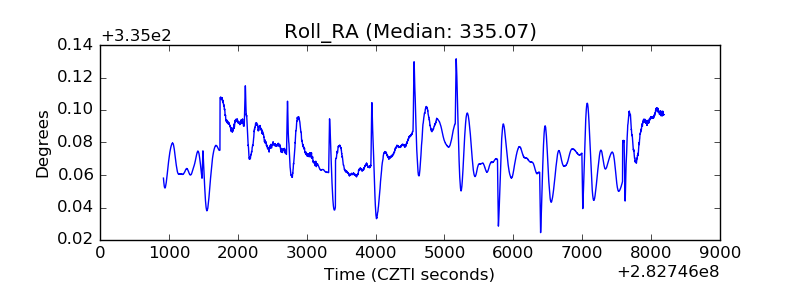 |
| Veto Counter | 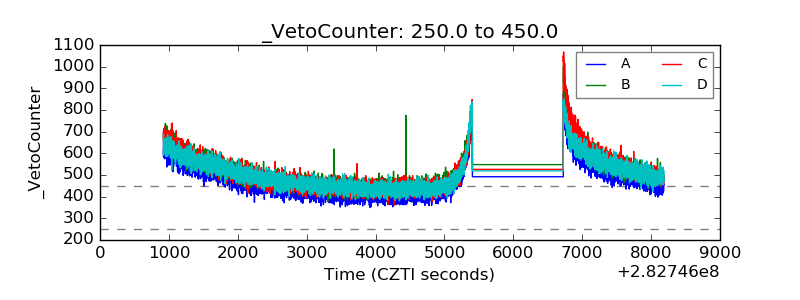 |