| Param | Original file | Final file |
|---|---|---|
| Filename | modeM0/AS1A05_182T03_9000002576_17414cztM0_level2.evt | modeM0/AS1A05_182T03_9000002576_17414cztM0_level2_quad_clean.evt |
| Size (bytes) | 126,904,320 | 32,256,000 |
| Size | 121.0 MB | 30.8 MB |
| Events in quadrant A | 784,888 | 224,032 |
| Events in quadrant B | 810,324 | 223,556 |
| Events in quadrant C | 761,659 | 211,202 |
| Events in quadrant D | 1,380,530 | 204,987 |
| Mode M0 | |||
|---|---|---|---|
| Quadrant | BADHDUFLAG | Total packets | Discarded packets |
| A | 0 | 3249 | 0 |
| B | 0 | 3295 | 0 |
| C | 0 | 3085 | 0 |
| D | 0 | 5093 | 0 |
| Mode SS | |||
|---|---|---|---|
| Quadrant | BADHDUFLAG | Total packets | Discarded packets |
| A | 0 | 30 | 0 |
| B | 0 | 30 | 0 |
| C | 0 | 30 | 0 |
| D | 0 | 30 | 0 |
| Quadrant | Total seconds | Saturated seconds | Saturation percentage |
|---|---|---|---|
| A | 1521 | 3 | 0.197239% |
| B | 1522 | 10 | 0.657030% |
| C | 1522 | 6 | 0.394218% |
| D | 1522 | 84 | 5.519054% |
Noise dominated data is calculated using 1-second bins in cleaned event files. If a bin has >2000 counts, and if more than 50% of those come from <1% of pixels, then it is considered to be noise-dominated and hence unusable.
| Quadrant | # 1 sec bins | Bins with >0 counts | Bins with >2000 counts | High rate bins dominated by noise | Noise dominated (total time) | Noise dominated (detector-on time) | Marked lightcurve |
|---|---|---|---|---|---|---|---|
| A | 1521 | 1521 | 2 | 2 | 0.13% | 0.13% | 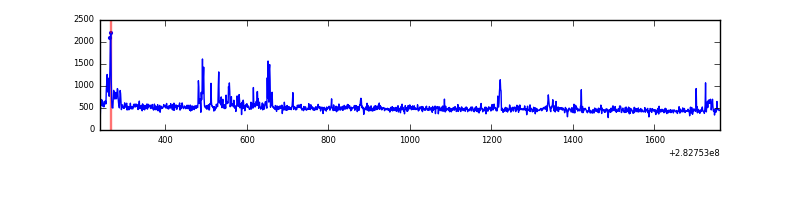 |
| B | 1522 | 1522 | 10 | 10 | 0.66% | 0.66% | 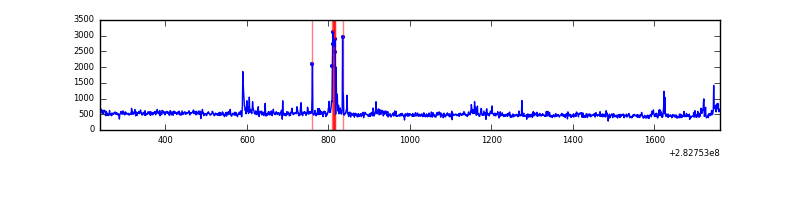 |
| C | 1522 | 1522 | 0 | 0 | 0.00% | 0.00% | 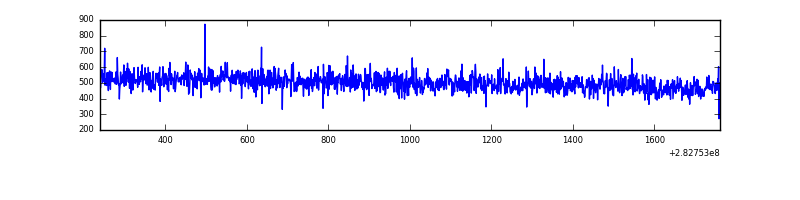 |
| D | 1522 | 1522 | 69 | 69 | 4.53% | 4.53% | 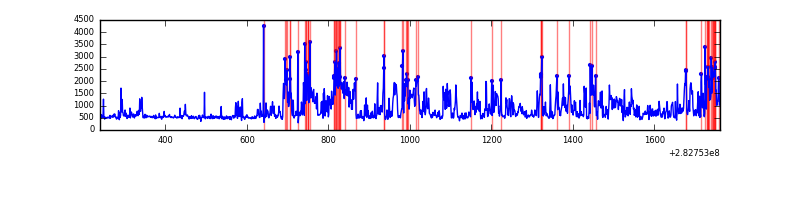 |
Top three noisy pixels from each quadrant. If the there are fewer than three noisy pixels in the level2.evt file, extra rows are filled as -1
| Pixel properties | Quadrant properties | ||||||
|---|---|---|---|---|---|---|---|
| Quadrant | DetID | PixID | Counts | Sigma | Mean | Median | Sigma |
| A | 6 | 16 | 51515 | 1289.96 | 190 | 187 | 39.8 |
| A | 0 | 226 | 1698 | 37.97 | 190 | 187 | 39.8 |
| A | 12 | 194 | 1538 | 33.95 | 190 | 187 | 39.8 |
| B | 5 | 172 | 30133 | 827.85 | 186 | 182 | 36.2 |
| B | 0 | 197 | 24757 | 679.25 | 186 | 182 | 36.2 |
| B | 4 | 216 | 10657 | 289.52 | 186 | 182 | 36.2 |
| C | 14 | 238 | 28936 | 665.57 | 181 | 182 | 43.2 |
| C | 5 | 218 | 16269 | 372.37 | 181 | 182 | 43.2 |
| C | 3 | 233 | 7555 | 170.66 | 181 | 182 | 43.2 |
| D | 11 | 176 | 413697 | 8977.33 | 185 | 180 | 46.1 |
| D | 13 | 232 | 159023 | 3448.43 | 185 | 180 | 46.1 |
| D | 13 | 189 | 50495 | 1092.32 | 185 | 180 | 46.1 |
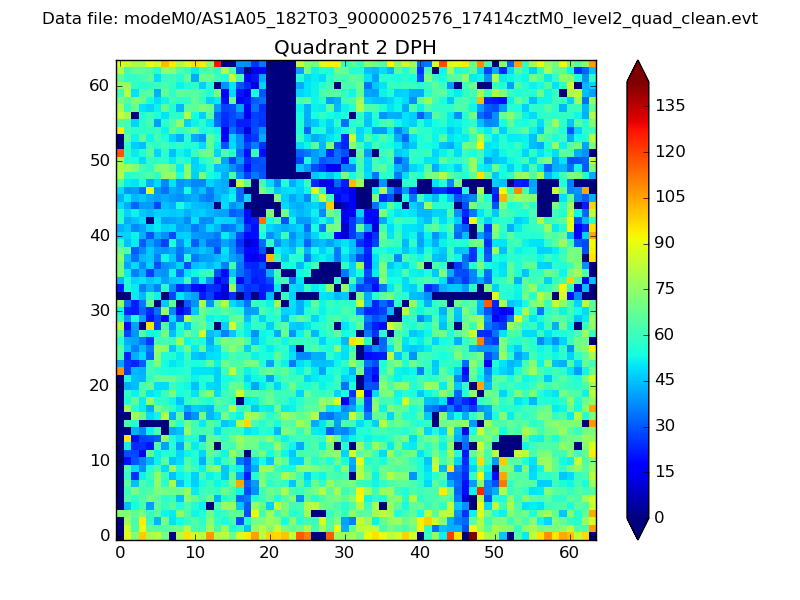
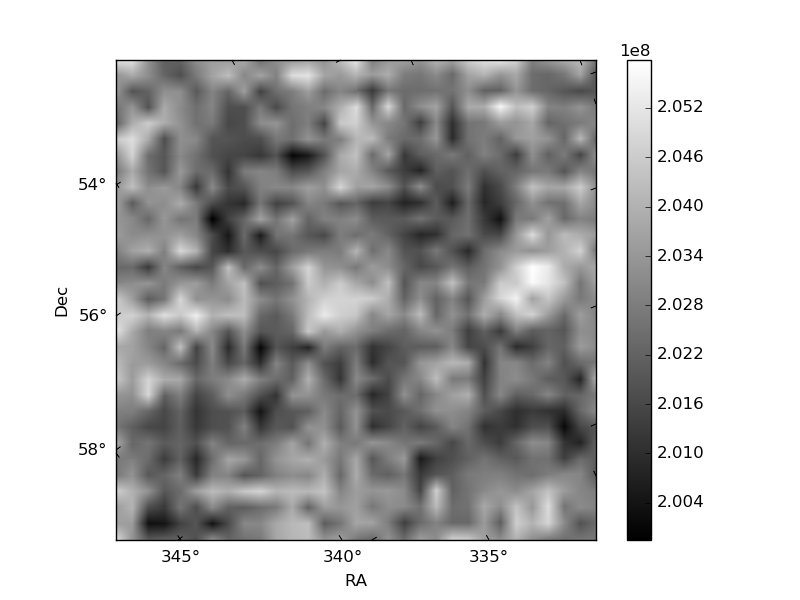
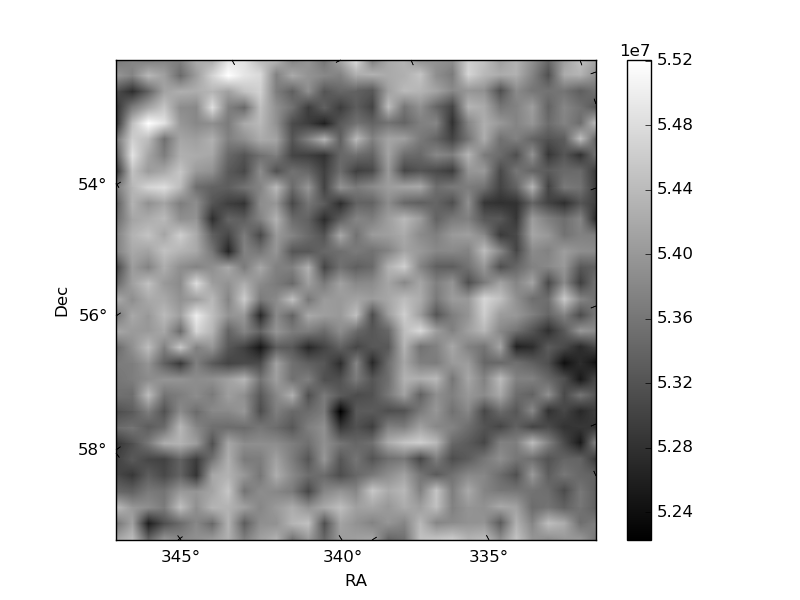
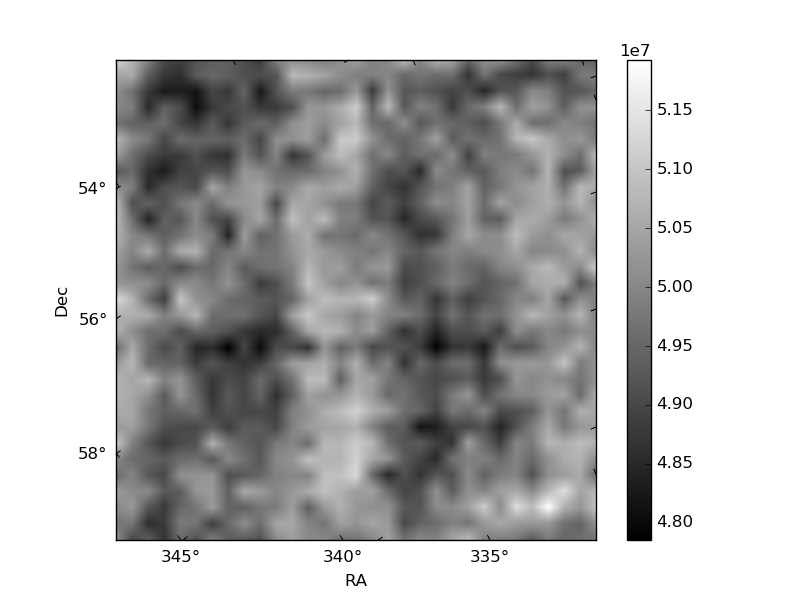
Histogram calculated using DETX and DETY for each event in the final _common_clean file
| Quadrant A | 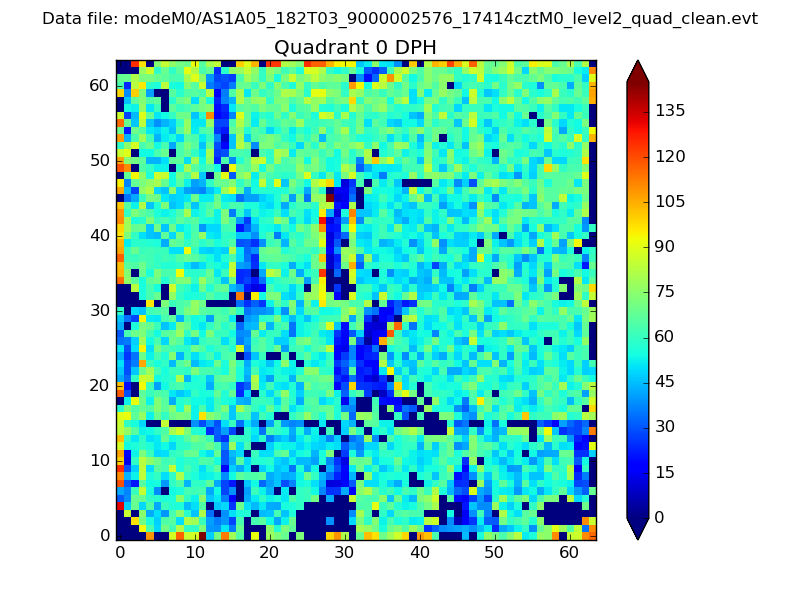 |
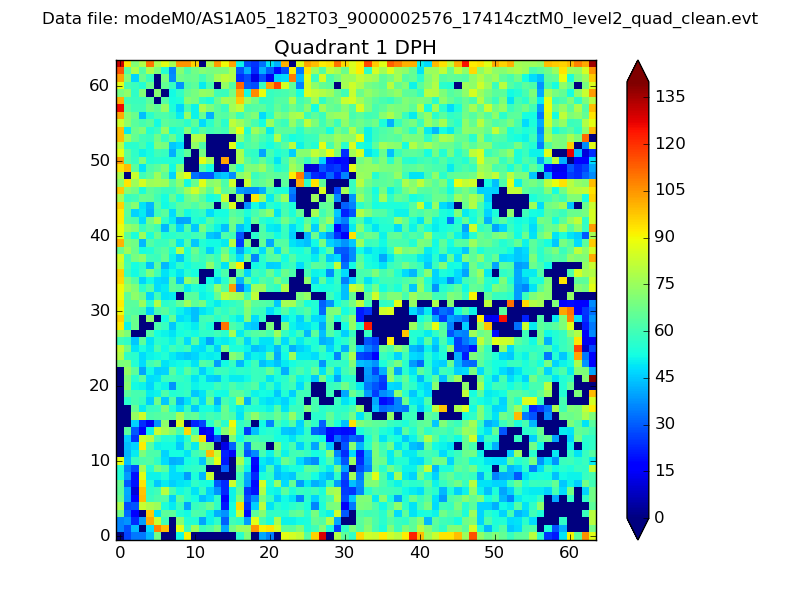 |
Quadrant B |
|---|---|---|---|
| Quadrant D | 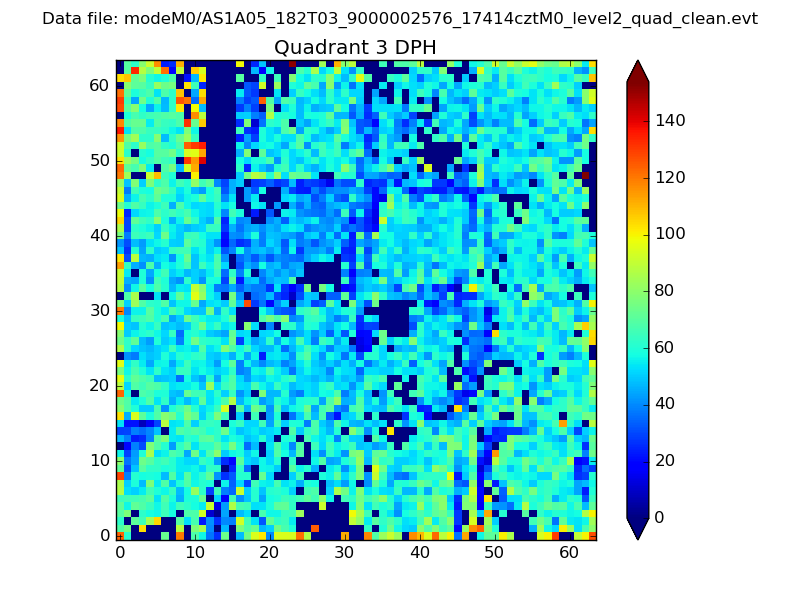 |
 |
Quadrant C |
| Plot type | Count rate plots | Images |
|---|---|---|
| Comparison with Poisson distribution Blue bars denote a histogram of data divided into 1 sec bins. Red curve is a Poisson curve with rate = median count rate of data. |
 |
 |
| Quadrant-wise count rates Data is divided into 100 sec bins |
 |
|
| Module-wise count rates for Quadrant A Data is divided into 100 sec bins |
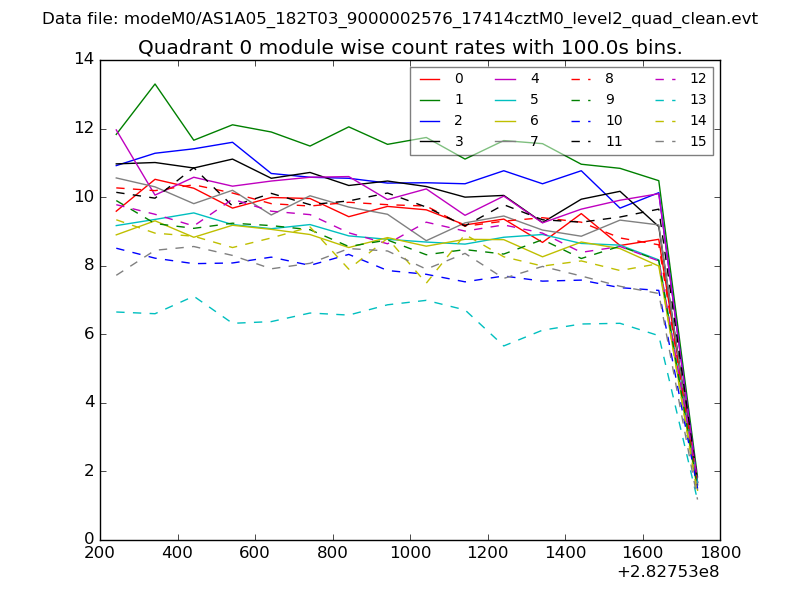 |
 |
| Module-wise count rates for Quadrant B Data is divided into 100 sec bins |
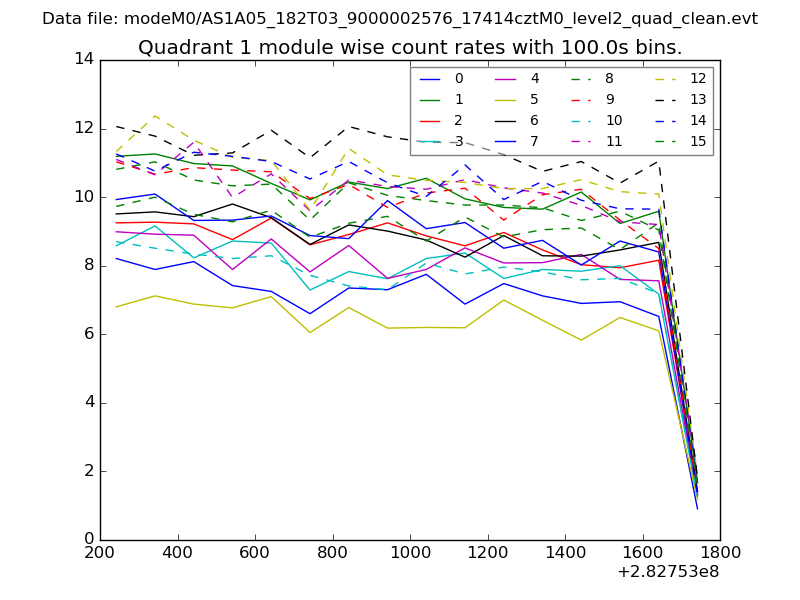 |
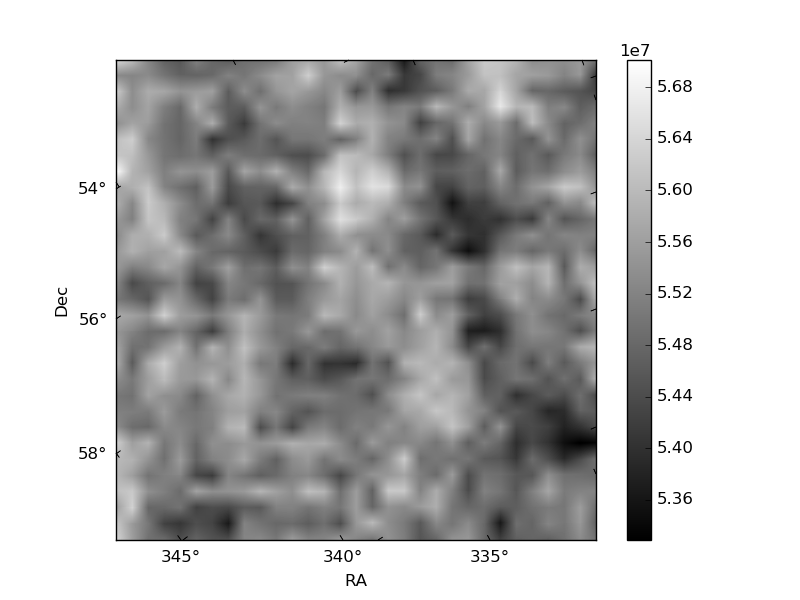 |
| Module-wise count rates for Quadrant C Data is divided into 100 sec bins |
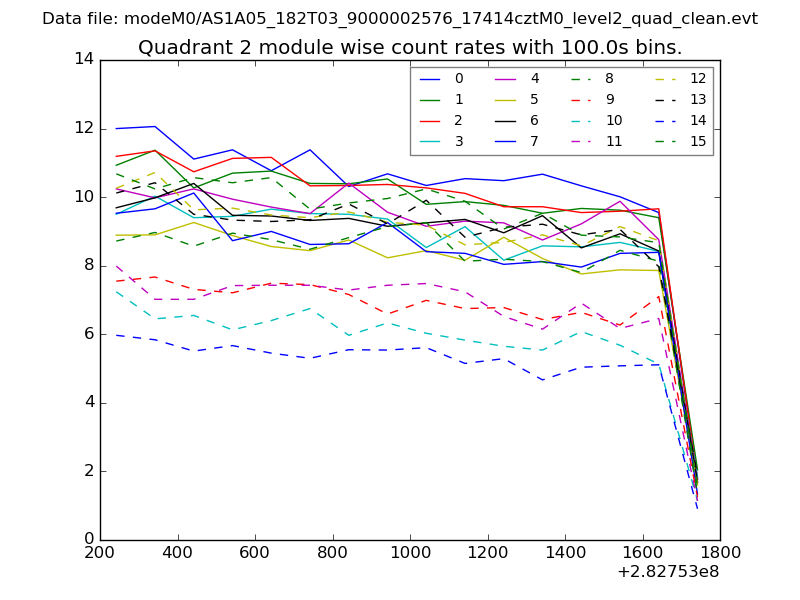 |
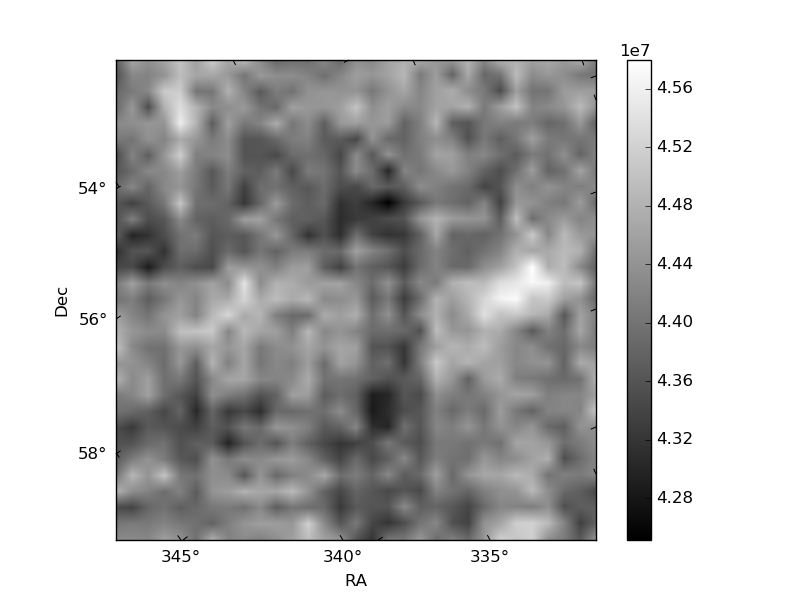 |
| Module-wise count rates for Quadrant D Data is divided into 100 sec bins |
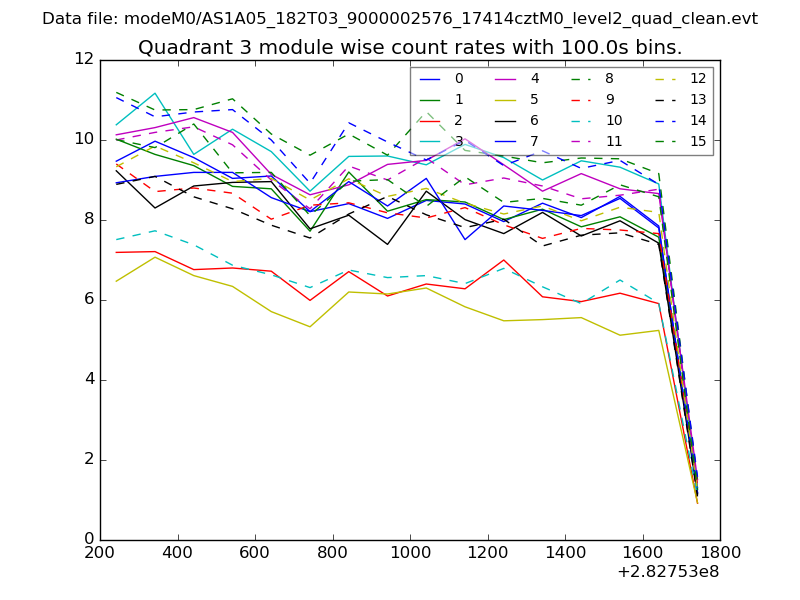 |
 |
| Parameter | Plot |
|---|---|
| CZT HV Monitor | 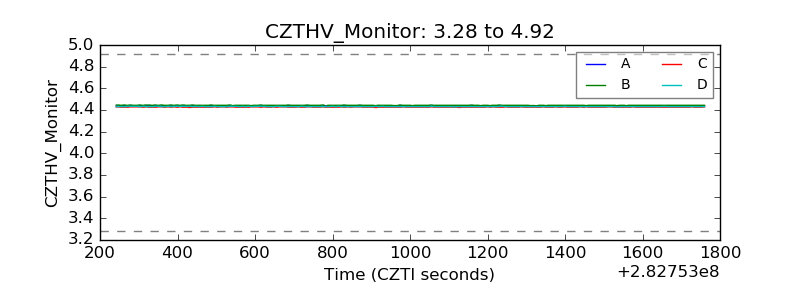 |
| D_VDD | 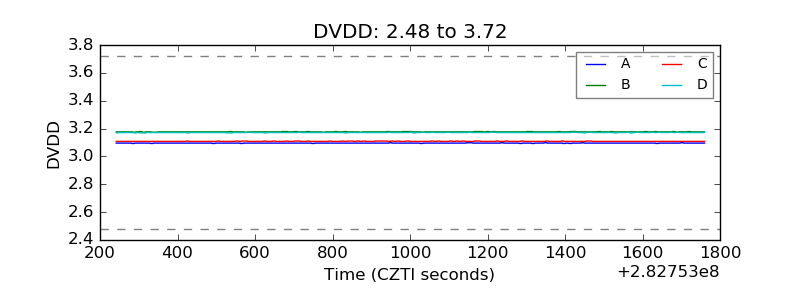 |
| Temperature 1 |  |
| Veto HV Monitor | 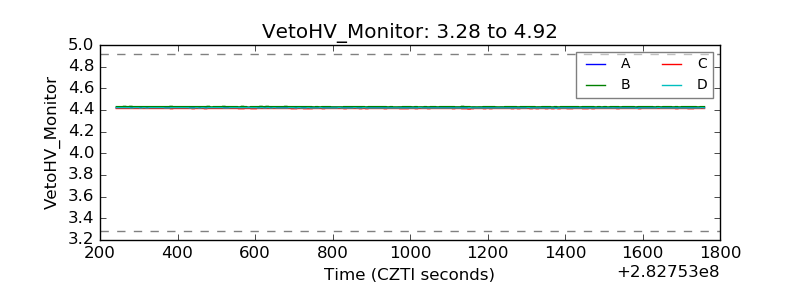 |
| Veto LLD | 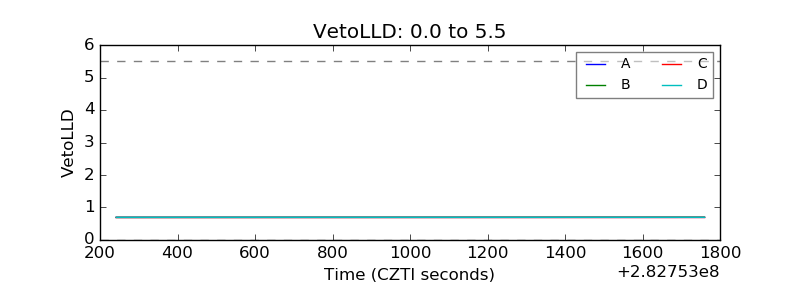 |
| Alpha Counter | 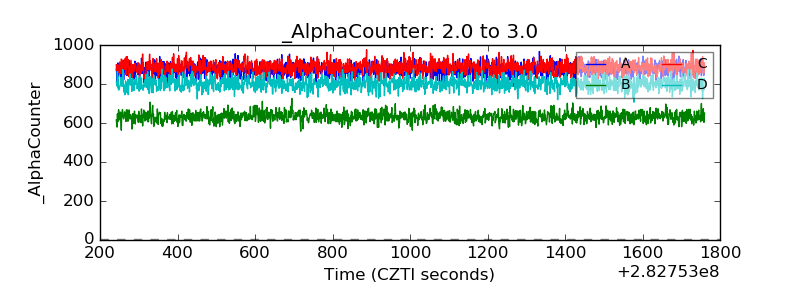 |
| _CPM_Rate | 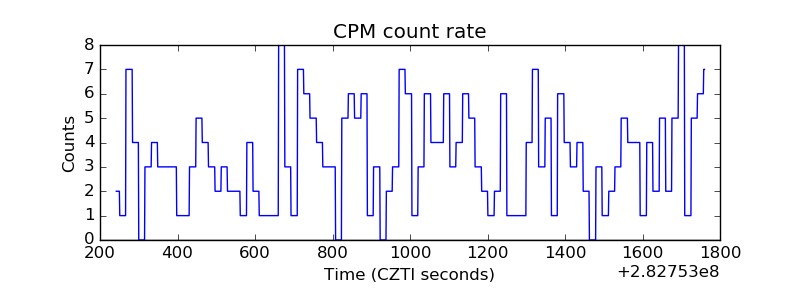 |
| CZT Counter | 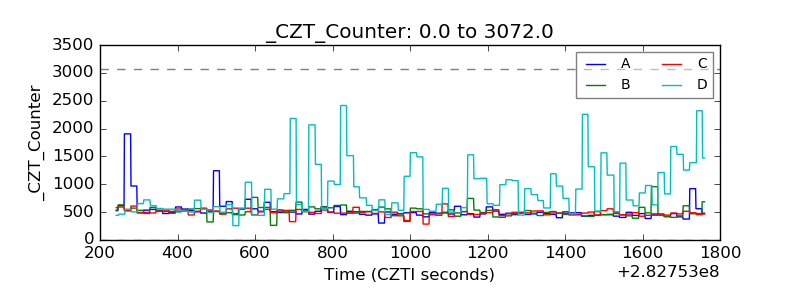 |
| +2.5 Volts monitor |  |
| +5 Volts monitor | 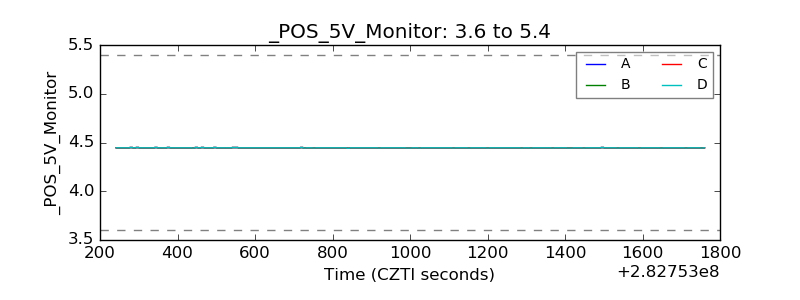 |
| _ROLL_ROT |  |
| _Roll_DEC |  |
| _Roll_RA | 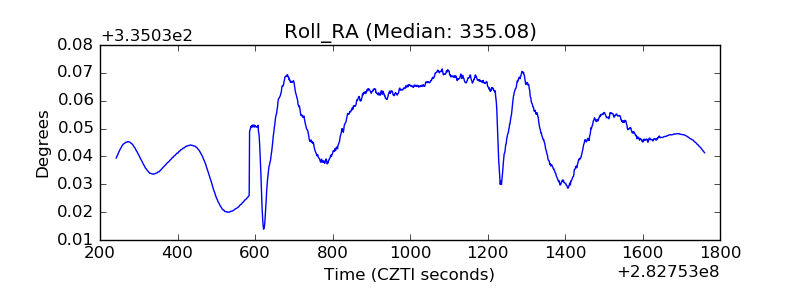 |
| Veto Counter | 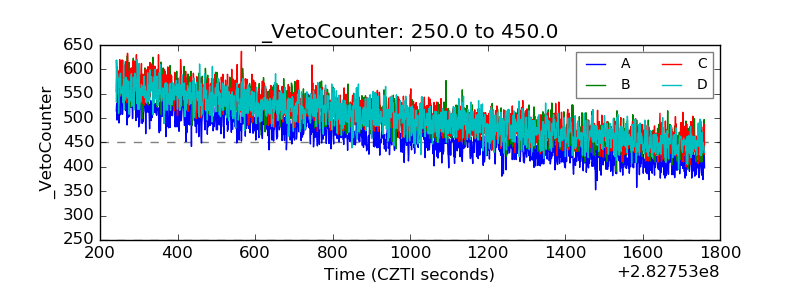 |