| Param | Original file | Final file |
|---|---|---|
| Filename | modeM0/AS1A05_198T01_9000002578cztM0_level2.fits | modeM0/AS1A05_198T01_9000002578cztM0_level2_quad_clean.evt |
| Size (bytes) | 1,181,842,560 | 1,089,423,360 |
| Size | 1.1 GB | 1.0 GB |
| Events in quadrant A | 7,197,478 | 6,330,526 |
| Events in quadrant B | 6,994,988 | 6,462,966 |
| Events in quadrant C | 7,029,548 | 6,137,742 |
| Events in quadrant D | 6,151,620 | 5,645,338 |
| Mode M9 | |||
|---|---|---|---|
| Quadrant | BADHDUFLAG | Total packets | Discarded packets |
| A | 0 | 173 | 0 |
| B | 0 | 173 | 0 |
| C | 0 | 173 | 0 |
| D | 0 | 173 | 0 |
| Mode M0 | |||
|---|---|---|---|
| Quadrant | BADHDUFLAG | Total packets | Discarded packets |
| A | 0 | 278407 | 0 |
| B | 0 | 269641 | 0 |
| C | 0 | 256273 | 0 |
| D | 0 | 296525 | 0 |
| Mode SS | |||
|---|---|---|---|
| Quadrant | BADHDUFLAG | Total packets | Discarded packets |
| A | 0 | 2498 | 0 |
| B | 0 | 2498 | 0 |
| C | 0 | 2498 | 0 |
| D | 0 | 2498 | 0 |
| Quadrant | Total seconds | Saturated seconds | Saturation percentage |
|---|---|---|---|
| A | 122852 | 3648 | 2.969427% |
| B | 122852 | 2046 | 1.665419% |
| C | 122852 | 1873 | 1.524599% |
| D | 122852 | 3047 | 2.480220% |
Noise dominated data is calculated using 1-second bins in cleaned event files. If a bin has >2000 counts, and if more than 50% of those come from <1% of pixels, then it is considered to be noise-dominated and hence unusable.
| Quadrant | # 1 sec bins | Bins with >0 counts | Bins with >2000 counts | High rate bins dominated by noise | Noise dominated (total time) | Noise dominated (detector-on time) | Marked lightcurve |
|---|---|---|---|---|---|---|---|
| A | 139762 | 122824 | 0 | 0 | 0.00% | 0.00% | 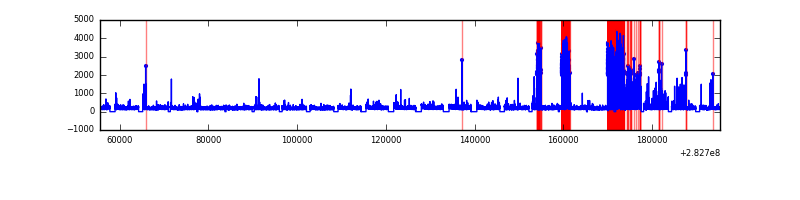 |
| B | 139762 | 122840 | 0 | 0 | 0.00% | 0.00% | 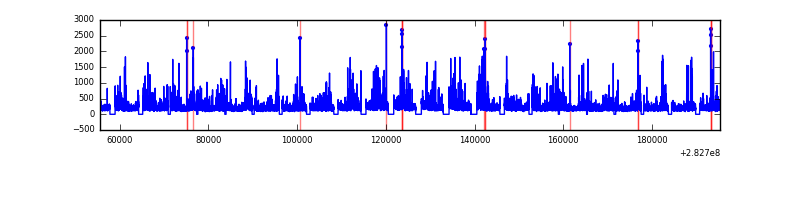 |
| C | 139762 | 122844 | 0 | 0 | 0.00% | 0.00% |  |
| D | 139762 | 122824 | 0 | 0 | 0.00% | 0.00% |  |
Top three noisy pixels from each quadrant. If the there are fewer than three noisy pixels in the level2.evt file, extra rows are filled as -1
| Pixel properties | Quadrant properties | ||||||
|---|---|---|---|---|---|---|---|
| Quadrant | DetID | PixID | Counts | Sigma | Mean | Median | Sigma |
| A | 0 | 29 | 6037 | 9.34 | 1877 | 1760 | 458.1 |
| A | 7 | 110 | 5784 | 8.79 | 1877 | 1760 | 458.1 |
| A | 9 | 19 | 5369 | 7.88 | 1877 | 1760 | 458.1 |
| B | 2 | 9 | 5773 | 10.9 | 1852 | 1760 | 368.2 |
| B | 2 | 8 | 4838 | 8.36 | 1852 | 1760 | 368.2 |
| B | 3 | 17 | 4625 | 7.78 | 1852 | 1760 | 368.2 |
| C | 1 | 80 | 5284 | 7.55 | 1855 | 1729 | 471.2 |
| C | 1 | 81 | 5238 | 7.45 | 1855 | 1729 | 471.2 |
| C | 12 | 241 | 4933 | 6.8 | 1855 | 1729 | 471.2 |
| D | 3 | 14 | 4580 | 6.4 | 1755 | 1593 | 467.1 |
| D | 3 | 31 | 4367 | 5.94 | 1755 | 1593 | 467.1 |
| D | 6 | 231 | 4351 | 5.9 | 1755 | 1593 | 467.1 |
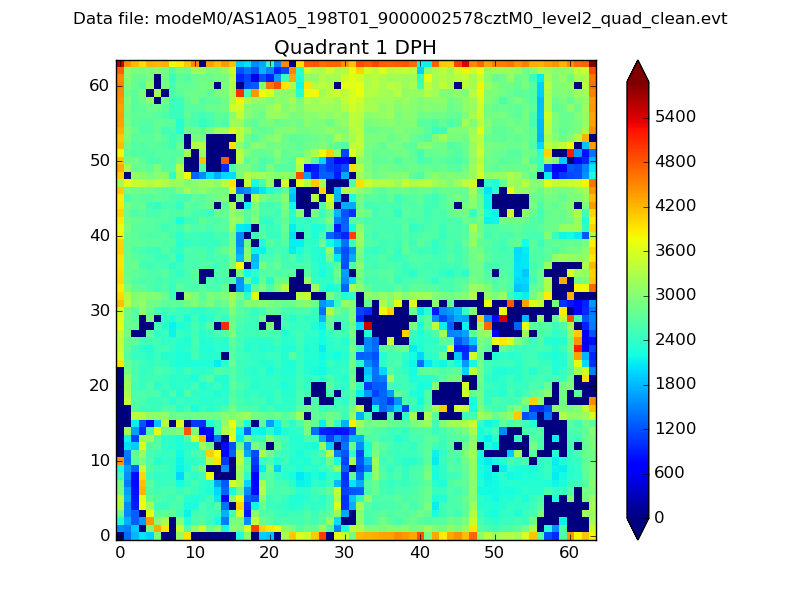
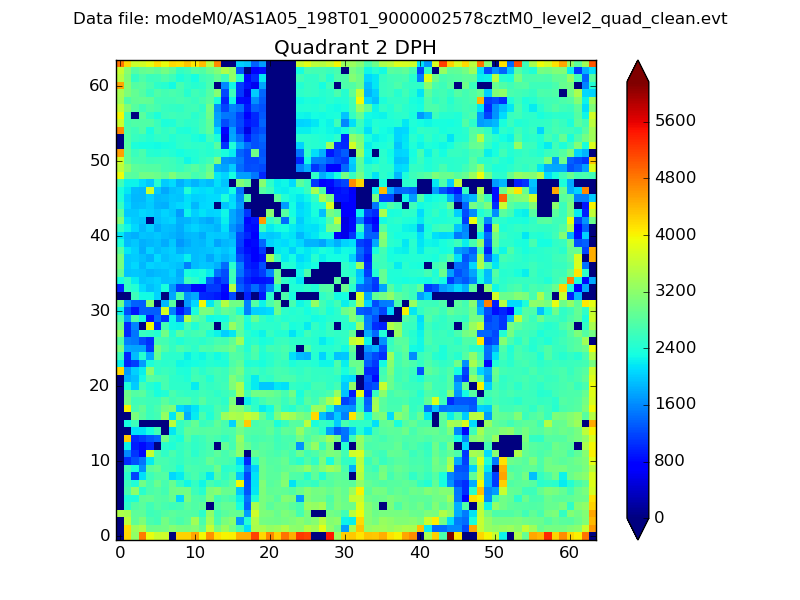
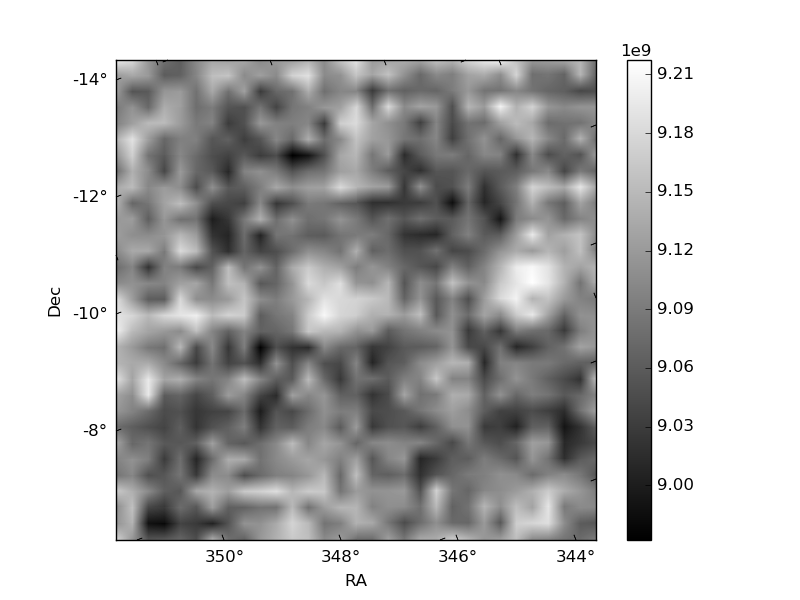
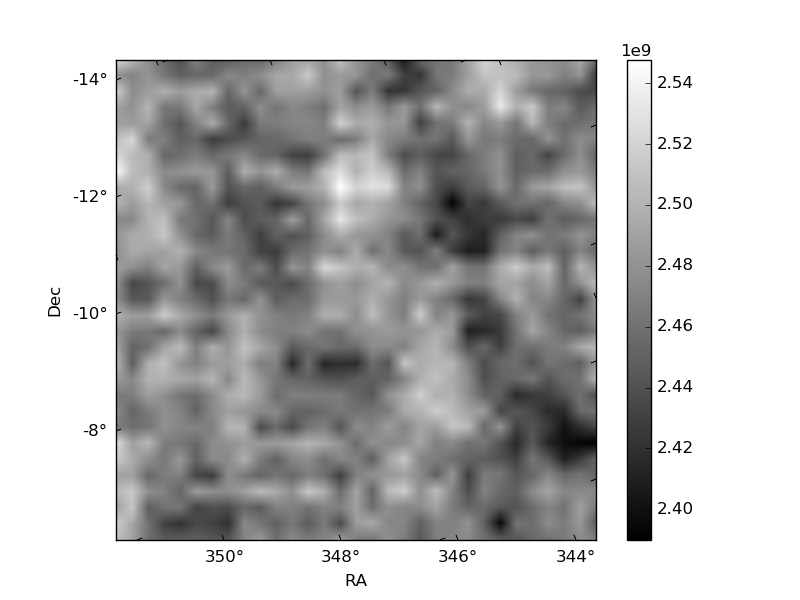
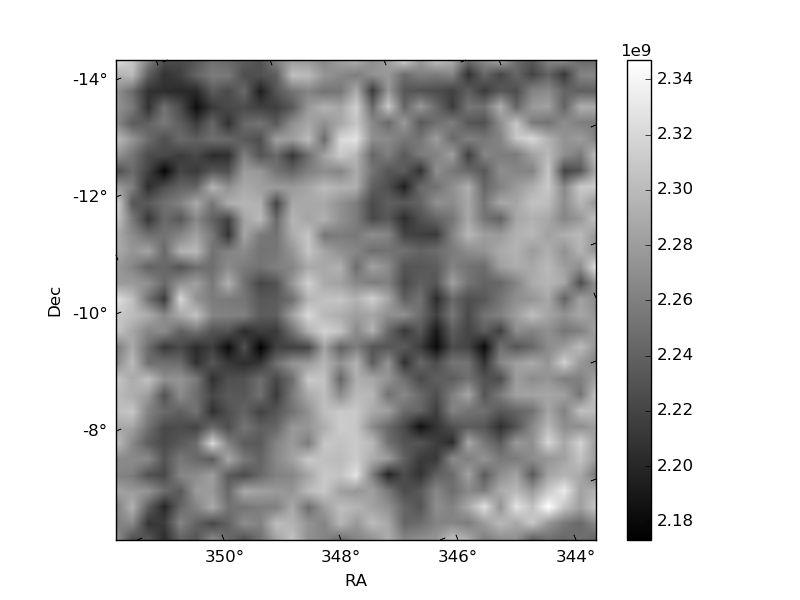
Histogram calculated using DETX and DETY for each event in the final _common_clean file
| Quadrant A |  |
 |
Quadrant B |
|---|---|---|---|
| Quadrant D |  |
 |
Quadrant C |
| Plot type | Count rate plots | Images |
|---|---|---|
| Comparison with Poisson distribution Blue bars denote a histogram of data divided into 1 sec bins. Red curve is a Poisson curve with rate = median count rate of data. |
 |
 |
| Quadrant-wise count rates Data is divided into 100 sec bins |
 |
|
| Module-wise count rates for Quadrant A Data is divided into 100 sec bins |
 |
 |
| Module-wise count rates for Quadrant B Data is divided into 100 sec bins |
 |
 |
| Module-wise count rates for Quadrant C Data is divided into 100 sec bins |
 |
 |
| Module-wise count rates for Quadrant D Data is divided into 100 sec bins |
 |
 |
| Parameter | Plot |
|---|---|
| CZT HV Monitor | 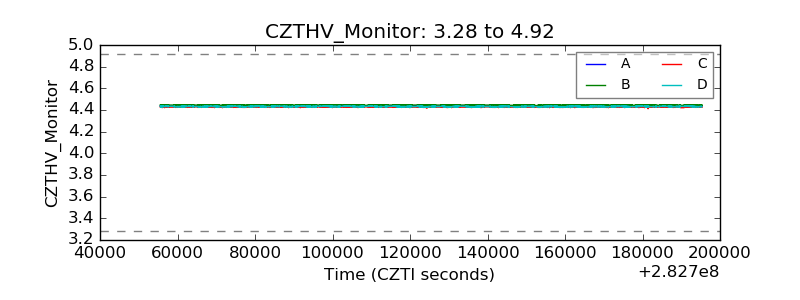 |
| D_VDD | 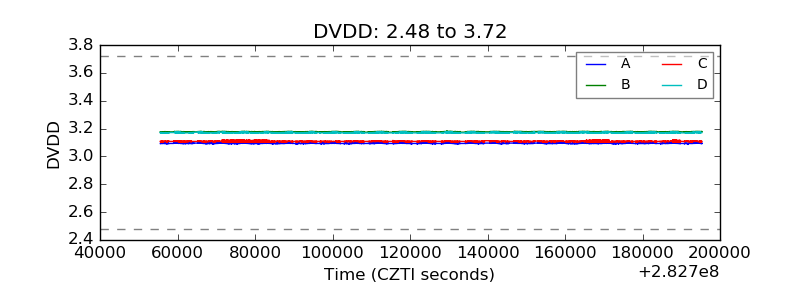 |
| Temperature 1 |  |
| Veto HV Monitor | 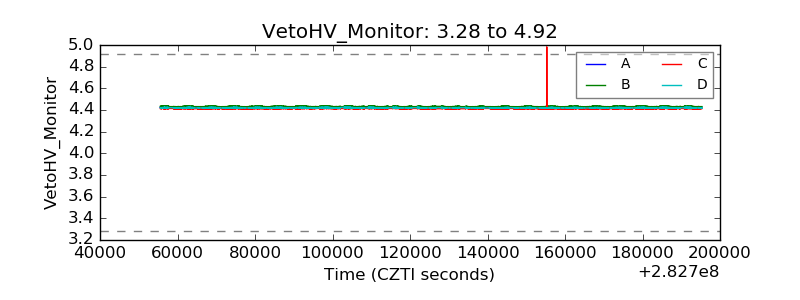 |
| Veto LLD |  |
| Alpha Counter | 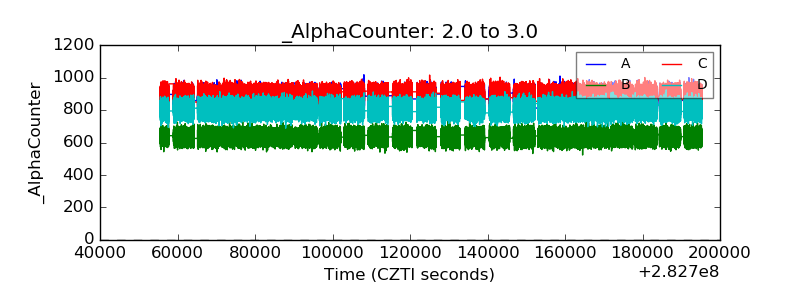 |
| _CPM_Rate |  |
| CZT Counter |  |
| +2.5 Volts monitor |  |
| +5 Volts monitor |  |
| _ROLL_ROT |  |
| _Roll_DEC |  |
| _Roll_RA |  |
| Veto Counter |  |