| Param | Original file | Final file |
|---|---|---|
| Filename | modeM0/AS1A05_198T01_9000002578_17414cztM0_level2.evt | modeM0/AS1A05_198T01_9000002578_17414cztM0_level2_quad_clean.evt |
| Size (bytes) | 288,224,640 | 34,709,760 |
| Size | 274.9 MB | 33.1 MB |
| Events in quadrant A | 1,872,118 | 203,057 |
| Events in quadrant B | 2,014,778 | 204,837 |
| Events in quadrant C | 1,938,274 | 195,412 |
| Events in quadrant D | 2,654,995 | 189,268 |
| Mode M9 | |||
|---|---|---|---|
| Quadrant | BADHDUFLAG | Total packets | Discarded packets |
| A | 0 | 12 | 0 |
| B | 0 | 12 | 0 |
| C | 0 | 12 | 0 |
| D | 0 | 12 | 0 |
| Mode M0 | |||
|---|---|---|---|
| Quadrant | BADHDUFLAG | Total packets | Discarded packets |
| A | 0 | 7873 | 1 |
| B | 0 | 8255 | 2 |
| C | 0 | 7940 | 1 |
| D | 0 | 10366 | 1 |
| Mode SS | |||
|---|---|---|---|
| Quadrant | BADHDUFLAG | Total packets | Discarded packets |
| A | 0 | 74 | 0 |
| B | 0 | 74 | 0 |
| C | 0 | 74 | 0 |
| D | 0 | 74 | 0 |
| Quadrant | Total seconds | Saturated seconds | Saturation percentage |
|---|---|---|---|
| A | 3646 | 99 | 2.715304% |
| B | 3645 | 126 | 3.456790% |
| C | 3645 | 95 | 2.606310% |
| D | 3645 | 155 | 4.252401% |
Noise dominated data is calculated using 1-second bins in cleaned event files. If a bin has >2000 counts, and if more than 50% of those come from <1% of pixels, then it is considered to be noise-dominated and hence unusable.
| Quadrant | # 1 sec bins | Bins with >0 counts | Bins with >2000 counts | High rate bins dominated by noise | Noise dominated (total time) | Noise dominated (detector-on time) | Marked lightcurve |
|---|---|---|---|---|---|---|---|
| A | 4826 | 3647 | 0 | 0 | 0.00% | 0.00% | 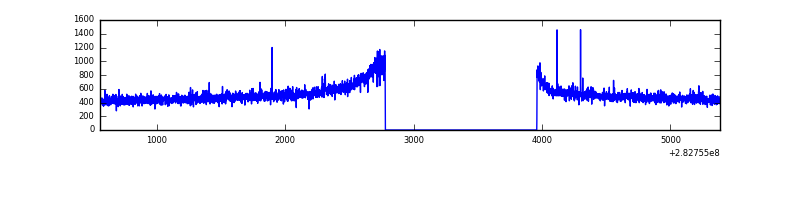 |
| B | 4825 | 3646 | 2 | 2 | 0.04% | 0.05% | 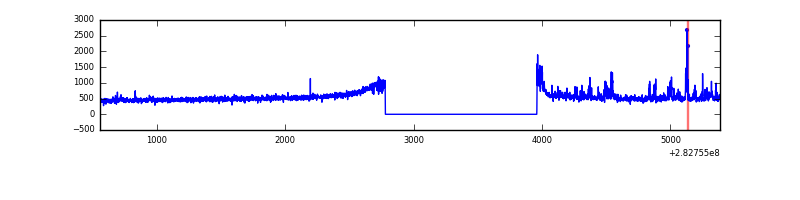 |
| C | 4825 | 3646 | 0 | 0 | 0.00% | 0.00% | 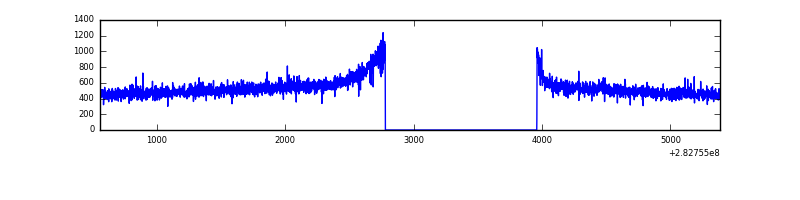 |
| D | 4825 | 3646 | 72 | 72 | 1.49% | 1.97% | 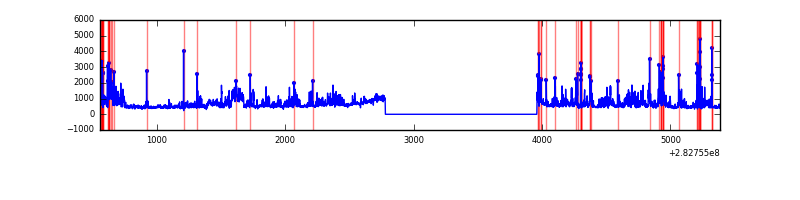 |
Top three noisy pixels from each quadrant. If the there are fewer than three noisy pixels in the level2.evt file, extra rows are filled as -1
| Pixel properties | Quadrant properties | ||||||
|---|---|---|---|---|---|---|---|
| Quadrant | DetID | PixID | Counts | Sigma | Mean | Median | Sigma |
| A | 6 | 16 | 6839 | 64.35 | 485 | 473 | 98.9 |
| A | 0 | 226 | 4422 | 39.92 | 485 | 473 | 98.9 |
| A | 12 | 194 | 3589 | 31.5 | 485 | 473 | 98.9 |
| B | 15 | 35 | 28017 | 289.45 | 484 | 472 | 95.2 |
| B | 7 | 220 | 27273 | 281.63 | 484 | 472 | 95.2 |
| B | 4 | 216 | 23872 | 245.89 | 484 | 472 | 95.2 |
| C | 14 | 238 | 71217 | 642.4 | 460 | 464 | 110.1 |
| C | 5 | 218 | 32648 | 292.22 | 460 | 464 | 110.1 |
| C | 3 | 233 | 26026 | 232.09 | 460 | 464 | 110.1 |
| D | 13 | 232 | 396208 | 3401.79 | 466 | 454 | 116.3 |
| D | 11 | 176 | 289264 | 2482.53 | 466 | 454 | 116.3 |
| D | 13 | 189 | 68692 | 586.55 | 466 | 454 | 116.3 |
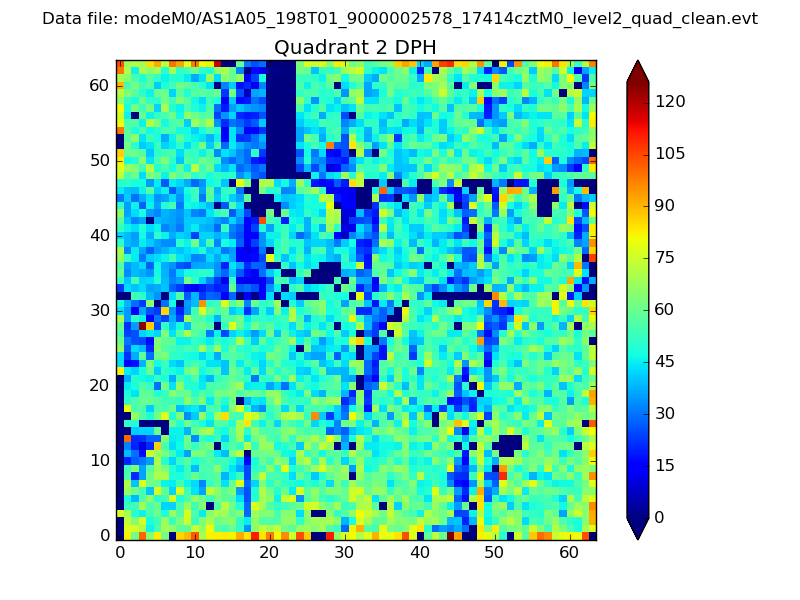
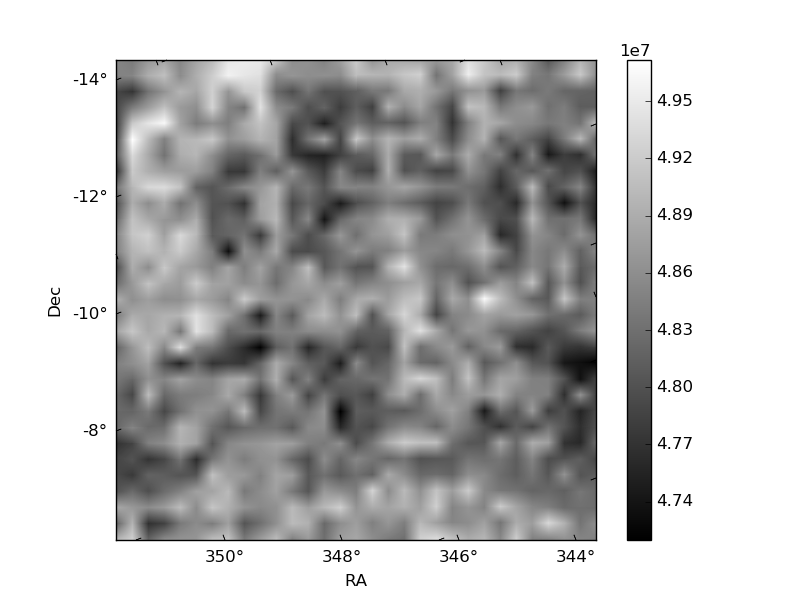
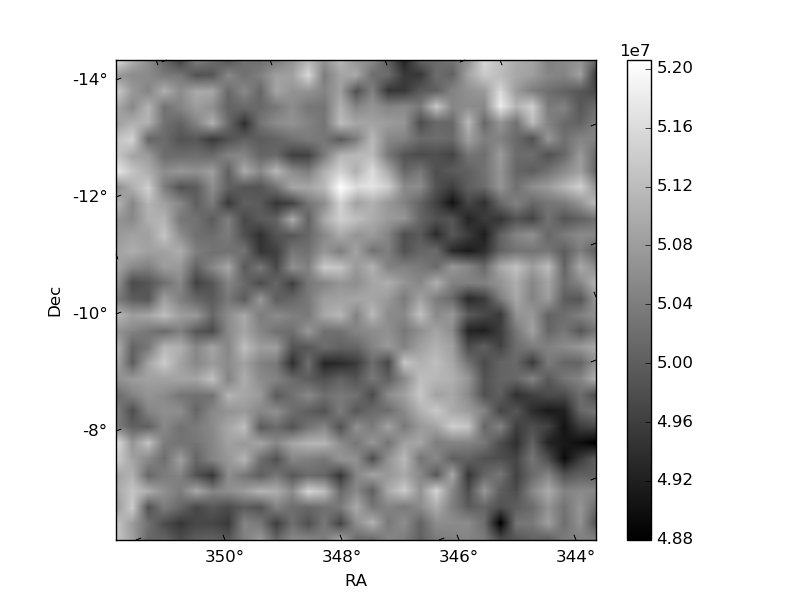
Histogram calculated using DETX and DETY for each event in the final _common_clean file
| Quadrant A | 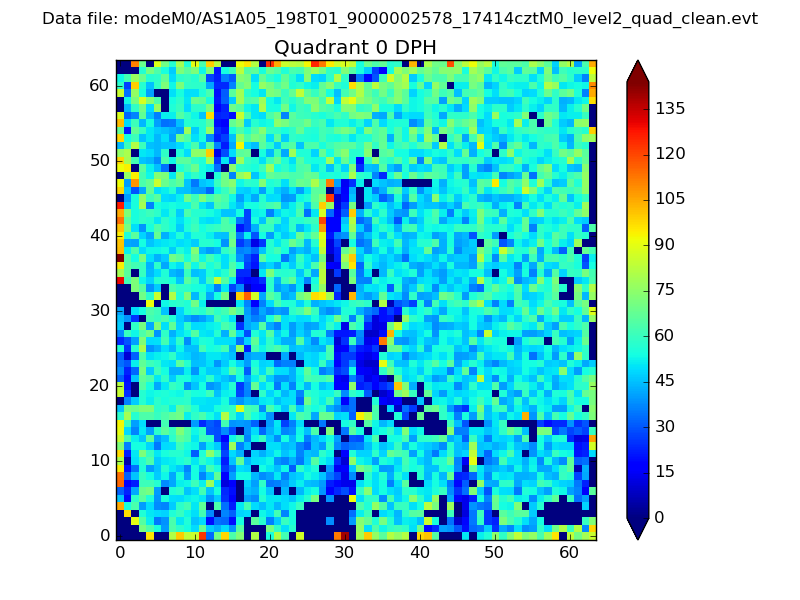 |
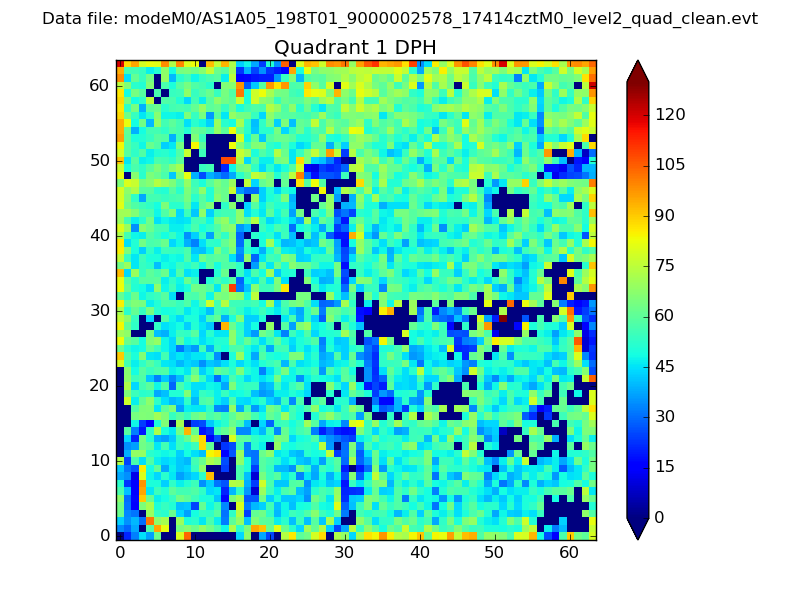 |
Quadrant B |
|---|---|---|---|
| Quadrant D | 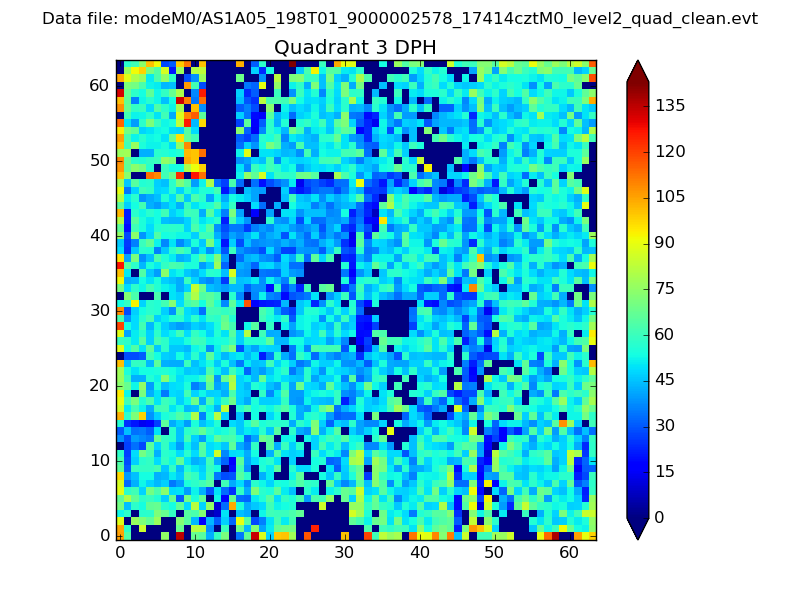 |
 |
Quadrant C |
| Plot type | Count rate plots | Images |
|---|---|---|
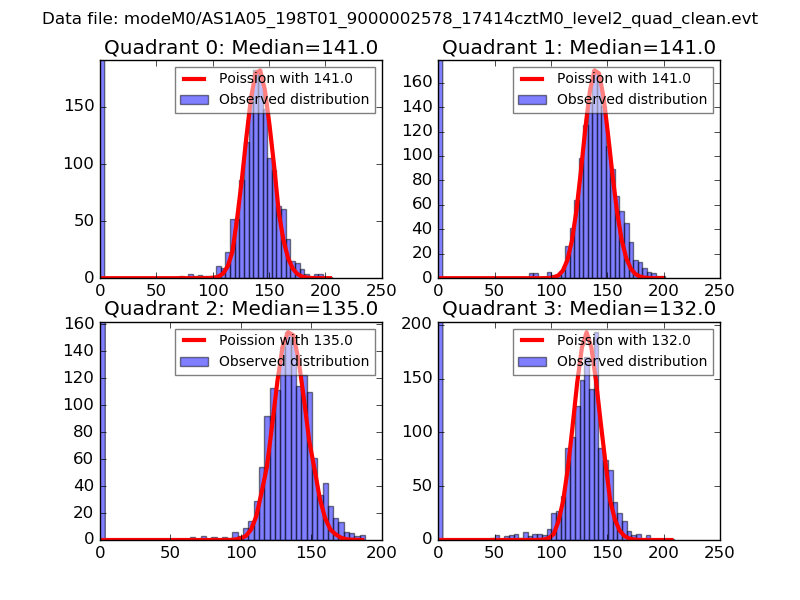
| Comparison with Poisson distribution Blue bars denote a histogram of data divided into 1 sec bins. Red curve is a Poisson curve with rate = median count rate of data. |
 |
 |
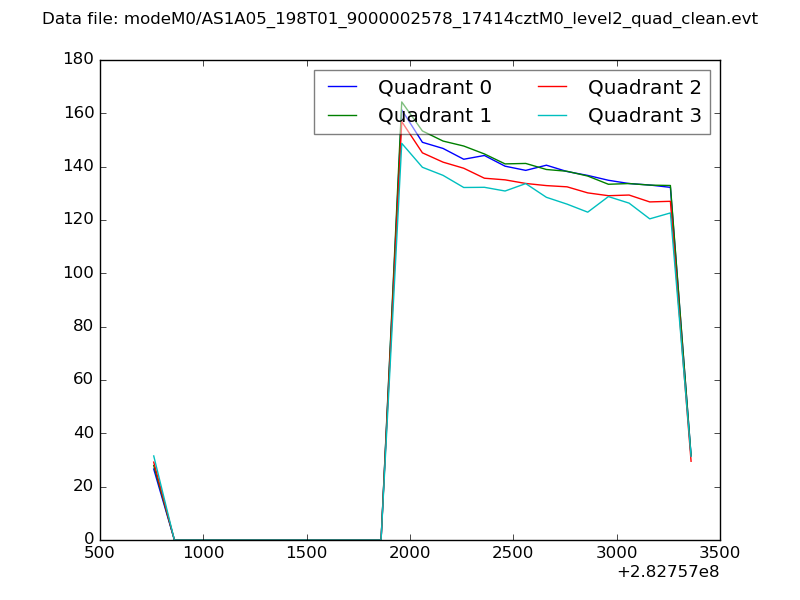
| Quadrant-wise count rates Data is divided into 100 sec bins |
 |
|
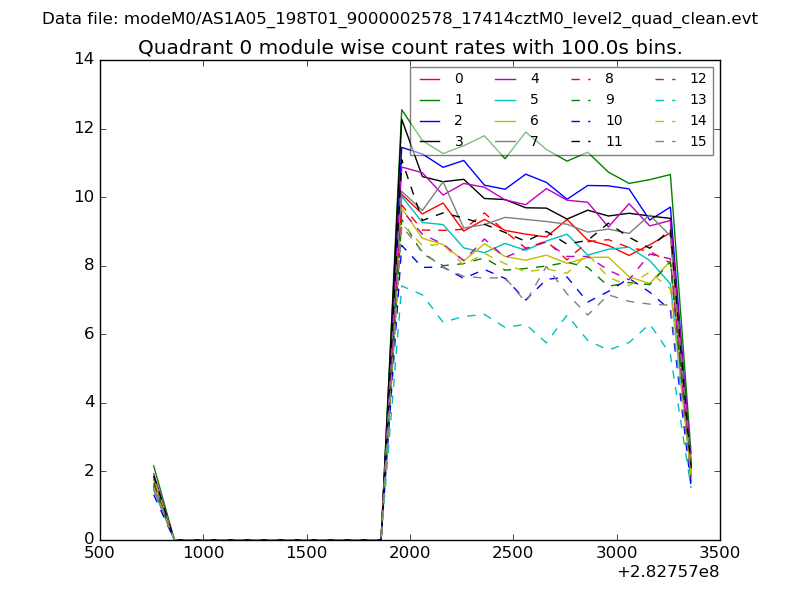
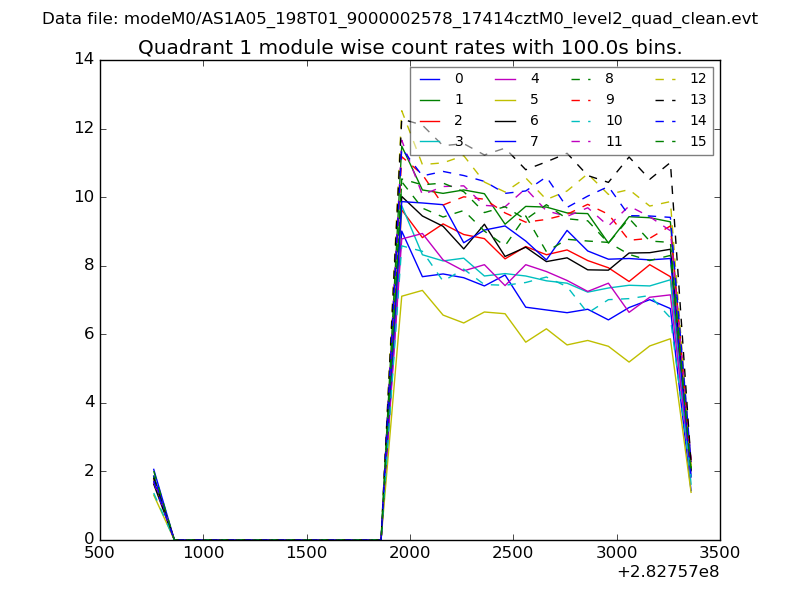
| Module-wise count rates for Quadrant A Data is divided into 100 sec bins |
 |
 |
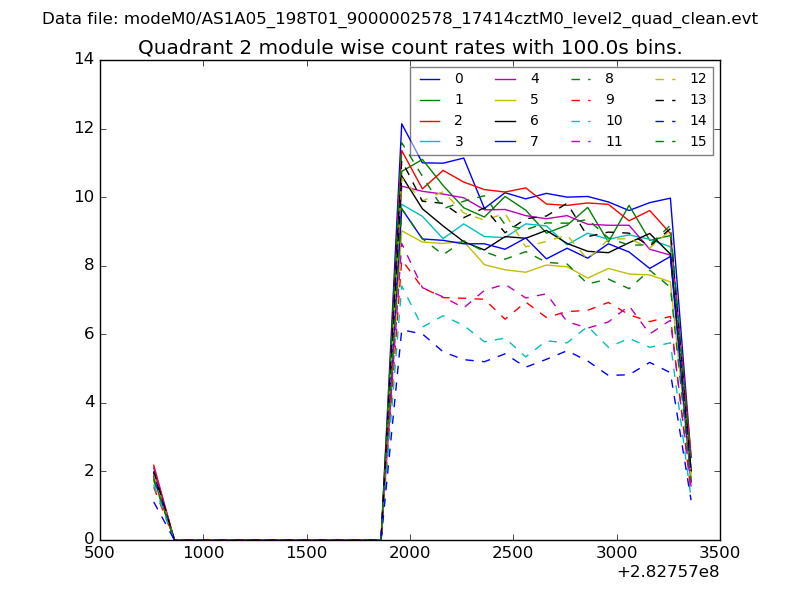
| Module-wise count rates for Quadrant B Data is divided into 100 sec bins |
 |
 |
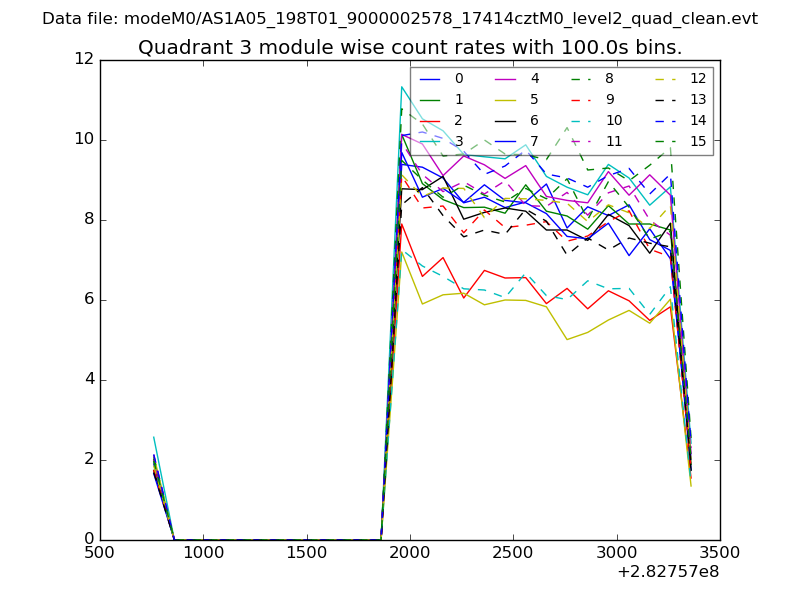
| Module-wise count rates for Quadrant C Data is divided into 100 sec bins |
 |
 |
| Module-wise count rates for Quadrant D Data is divided into 100 sec bins |
 |
 |
| Parameter | Plot |
|---|---|
| CZT HV Monitor | 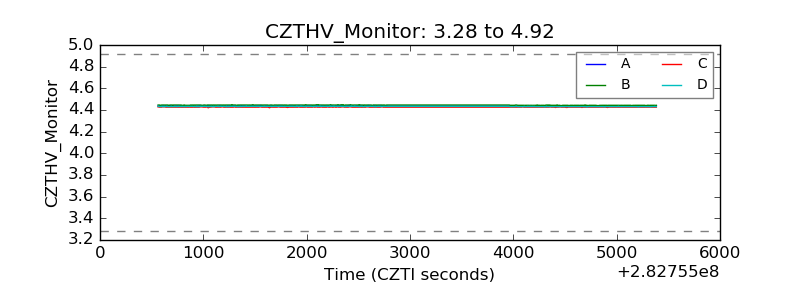 |
| D_VDD | 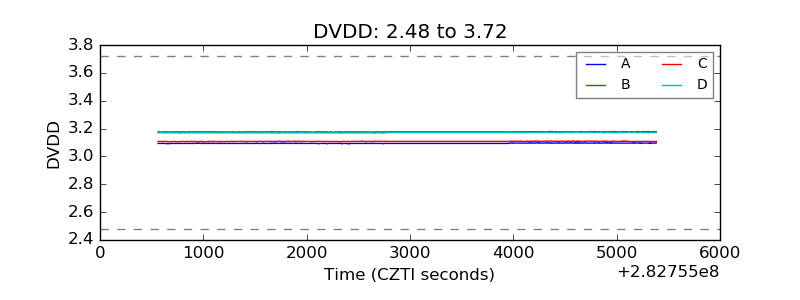 |
| Temperature 1 |  |
| Veto HV Monitor | 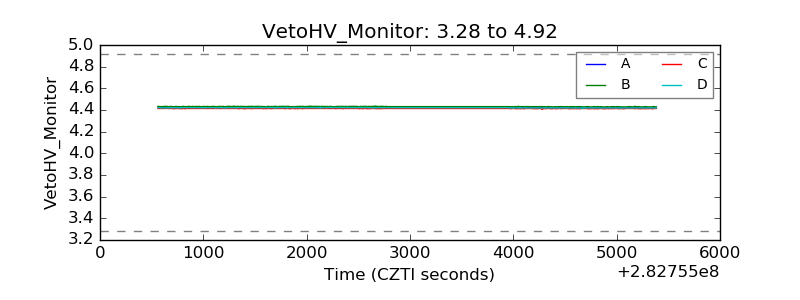 |
| Veto LLD | 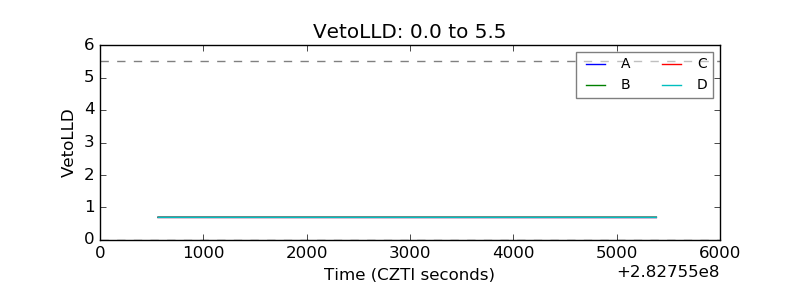 |
| Alpha Counter | 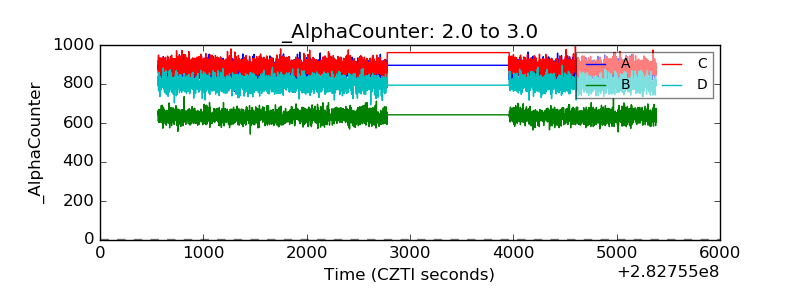 |
| _CPM_Rate | 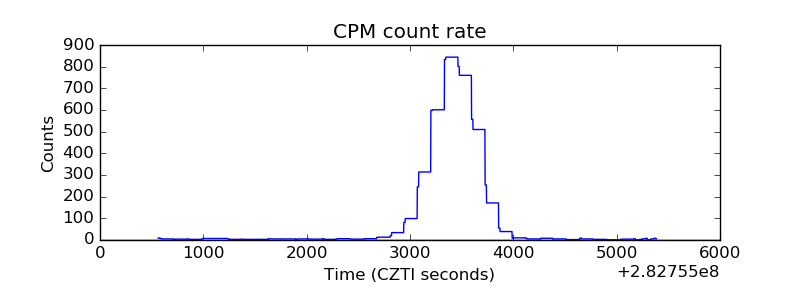 |
| CZT Counter | 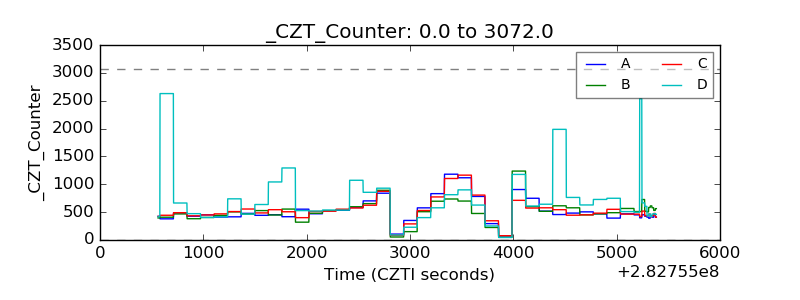 |
| +2.5 Volts monitor |  |
| +5 Volts monitor |  |
| _ROLL_ROT | 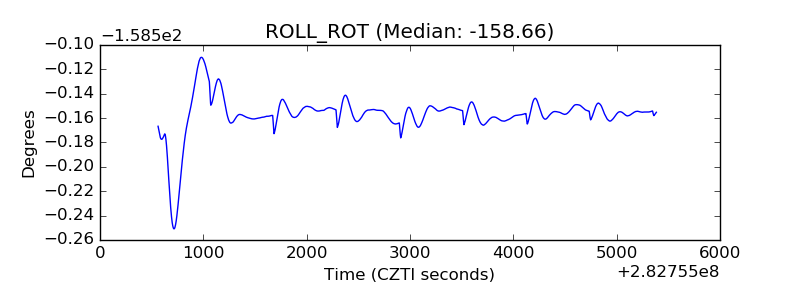 |
| _Roll_DEC | 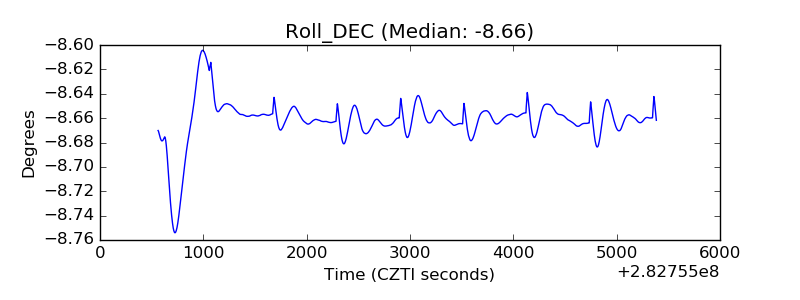 |
| _Roll_RA | 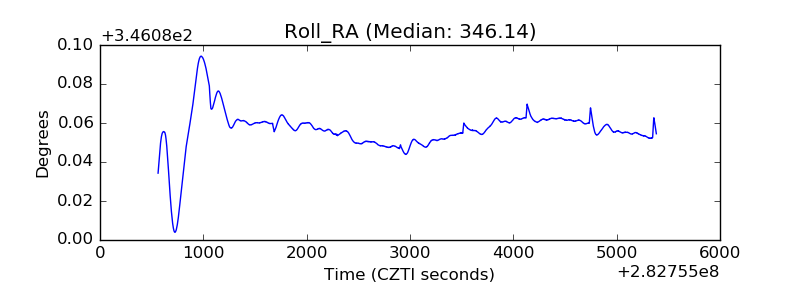 |
| Veto Counter |  |