| Param | Original file | Final file |
|---|---|---|
| Filename | modeM0/AS1A05_198T01_9000002578_17415cztM0_level2.evt | modeM0/AS1A05_198T01_9000002578_17415cztM0_level2_quad_clean.evt |
| Size (bytes) | 478,607,040 | 90,532,800 |
| Size | 456.4 MB | 86.3 MB |
| Events in quadrant A | 3,173,491 | 582,944 |
| Events in quadrant B | 3,498,307 | 588,918 |
| Events in quadrant C | 3,234,754 | 560,578 |
| Events in quadrant D | 4,139,771 | 548,567 |
| Mode M9 | |||
|---|---|---|---|
| Quadrant | BADHDUFLAG | Total packets | Discarded packets |
| A | 0 | 9 | 0 |
| B | 0 | 9 | 0 |
| C | 0 | 9 | 0 |
| D | 0 | 9 | 0 |
| Mode M0 | |||
|---|---|---|---|
| Quadrant | BADHDUFLAG | Total packets | Discarded packets |
| A | 0 | 13764 | 1 |
| B | 0 | 14580 | 1 |
| C | 0 | 13787 | 1 |
| D | 0 | 16755 | 1 |
| Mode SS | |||
|---|---|---|---|
| Quadrant | BADHDUFLAG | Total packets | Discarded packets |
| A | 0 | 134 | 0 |
| B | 0 | 134 | 0 |
| C | 0 | 134 | 0 |
| D | 0 | 134 | 0 |
| Quadrant | Total seconds | Saturated seconds | Saturation percentage |
|---|---|---|---|
| A | 6606 | 40 | 0.605510% |
| B | 6606 | 64 | 0.968816% |
| C | 6606 | 55 | 0.832576% |
| D | 6607 | 101 | 1.528682% |
Noise dominated data is calculated using 1-second bins in cleaned event files. If a bin has >2000 counts, and if more than 50% of those come from <1% of pixels, then it is considered to be noise-dominated and hence unusable.
| Quadrant | # 1 sec bins | Bins with >0 counts | Bins with >2000 counts | High rate bins dominated by noise | Noise dominated (total time) | Noise dominated (detector-on time) | Marked lightcurve |
|---|---|---|---|---|---|---|---|
| A | 7531 | 6607 | 2 | 2 | 0.03% | 0.03% | 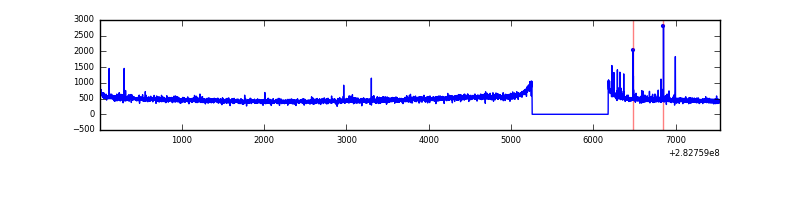 |
| B | 7531 | 6607 | 9 | 9 | 0.12% | 0.14% | 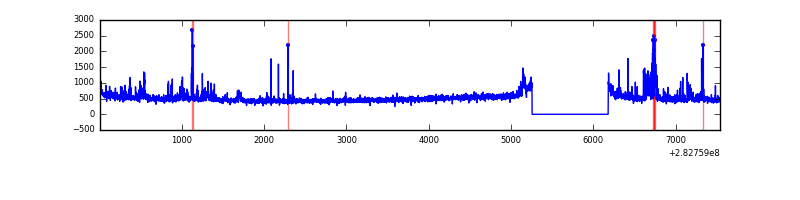 |
| C | 7531 | 6607 | 0 | 0 | 0.00% | 0.00% | 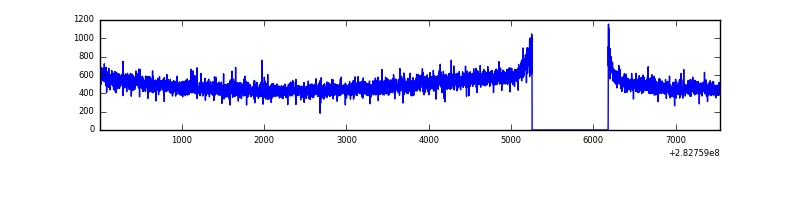 |
| D | 7532 | 6608 | 63 | 63 | 0.84% | 0.95% | 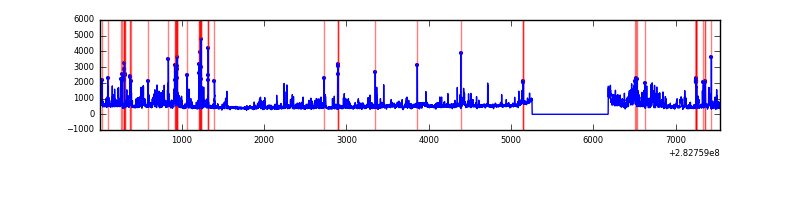 |
Top three noisy pixels from each quadrant. If the there are fewer than three noisy pixels in the level2.evt file, extra rows are filled as -1
| Pixel properties | Quadrant properties | ||||||
|---|---|---|---|---|---|---|---|
| Quadrant | DetID | PixID | Counts | Sigma | Mean | Median | Sigma |
| A | 4 | 2 | 35246 | 206.74 | 816 | 799 | 166.6 |
| A | 0 | 226 | 7259 | 38.77 | 816 | 799 | 166.6 |
| A | 12 | 194 | 6098 | 31.8 | 816 | 799 | 166.6 |
| B | 15 | 35 | 123365 | 787.14 | 815 | 797 | 155.7 |
| B | 7 | 220 | 45512 | 287.16 | 815 | 797 | 155.7 |
| B | 4 | 216 | 42898 | 270.38 | 815 | 797 | 155.7 |
| C | 14 | 238 | 122556 | 676.51 | 771 | 776 | 180.0 |
| C | 3 | 233 | 56900 | 311.78 | 771 | 776 | 180.0 |
| C | 5 | 218 | 34002 | 184.58 | 771 | 776 | 180.0 |
| D | 13 | 232 | 498528 | 2601.07 | 781 | 761 | 191.4 |
| D | 11 | 176 | 355870 | 1855.61 | 781 | 761 | 191.4 |
| D | 13 | 189 | 133209 | 692.1 | 781 | 761 | 191.4 |
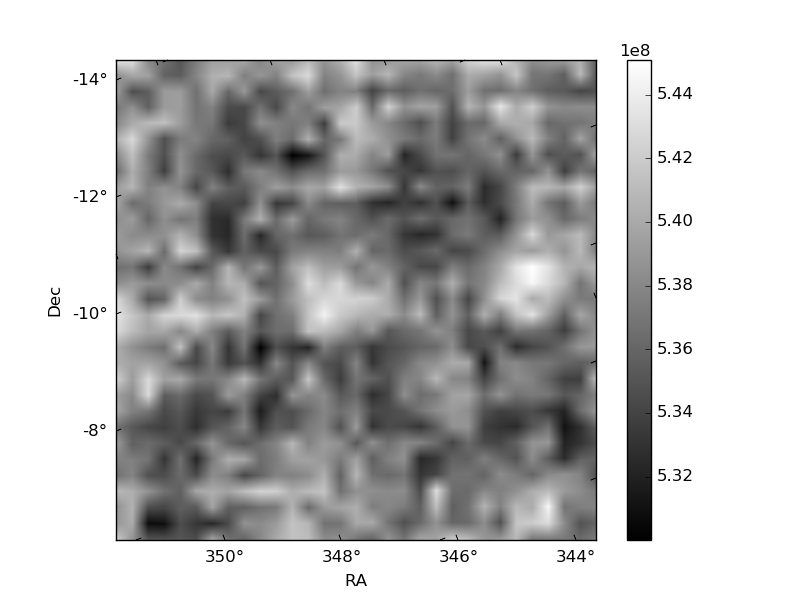
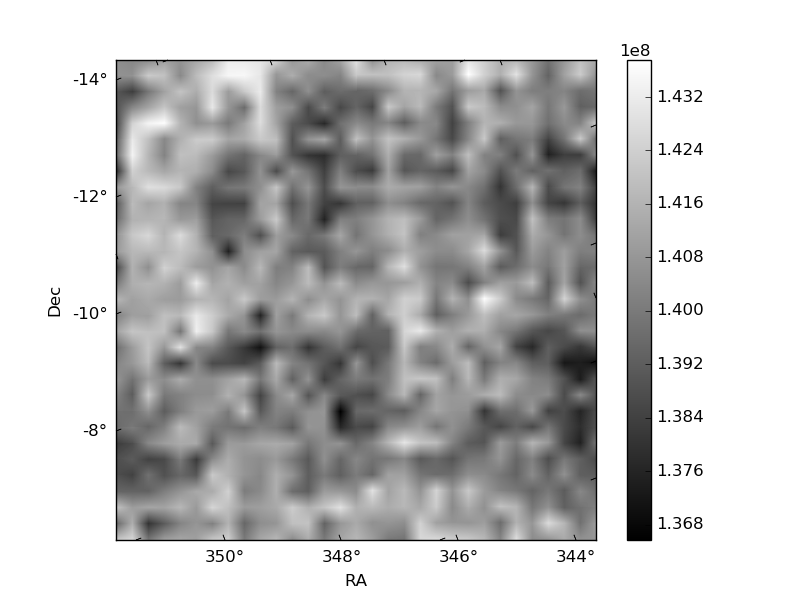
Histogram calculated using DETX and DETY for each event in the final _common_clean file
| Quadrant A | 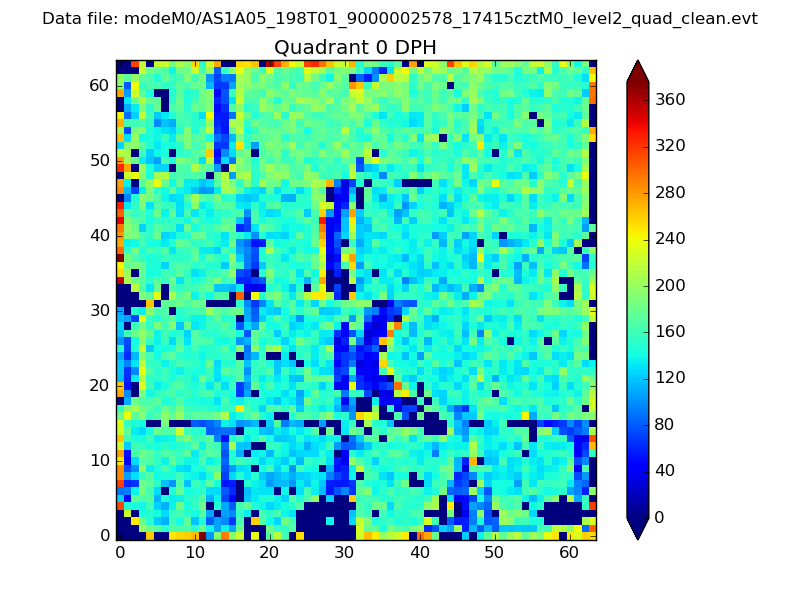 |
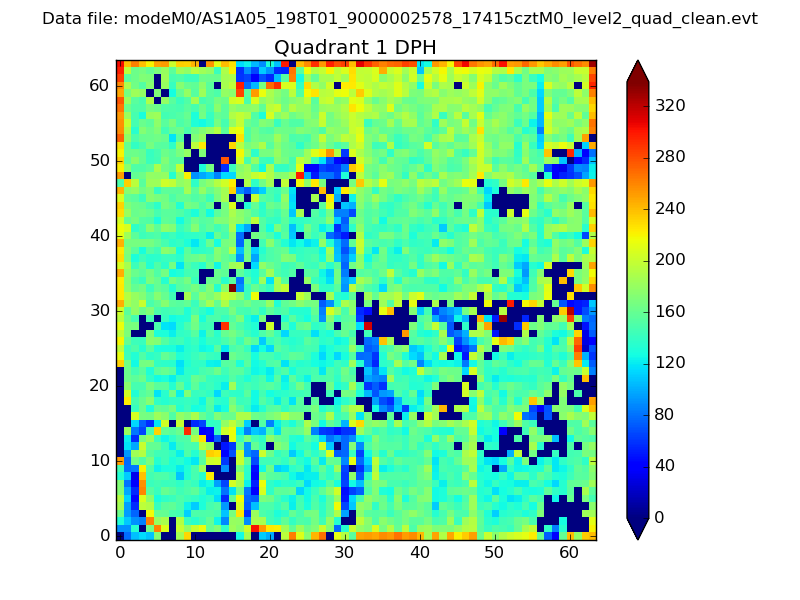 |
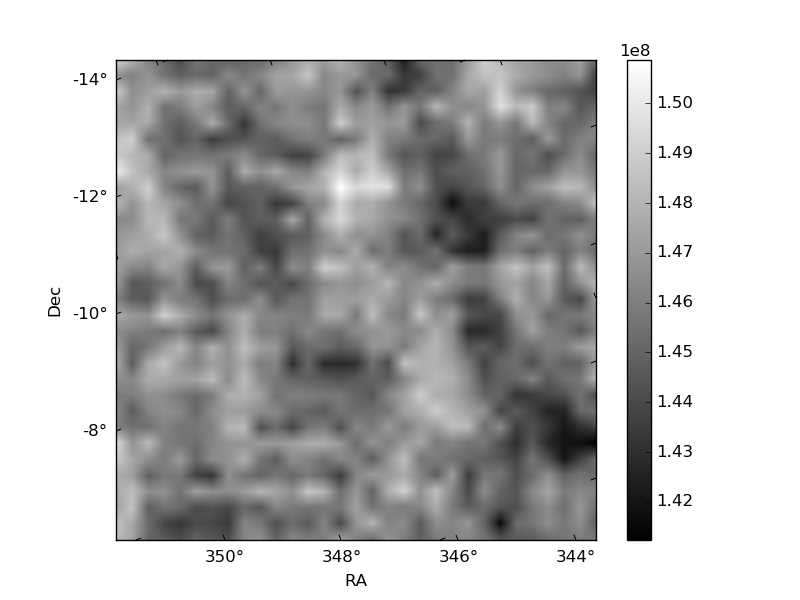
Quadrant B |
|---|---|---|---|
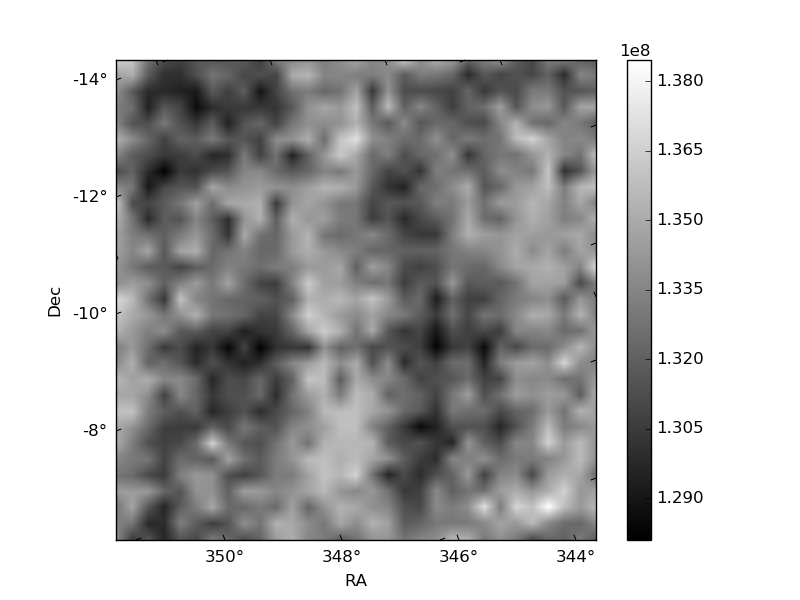
| Quadrant D | 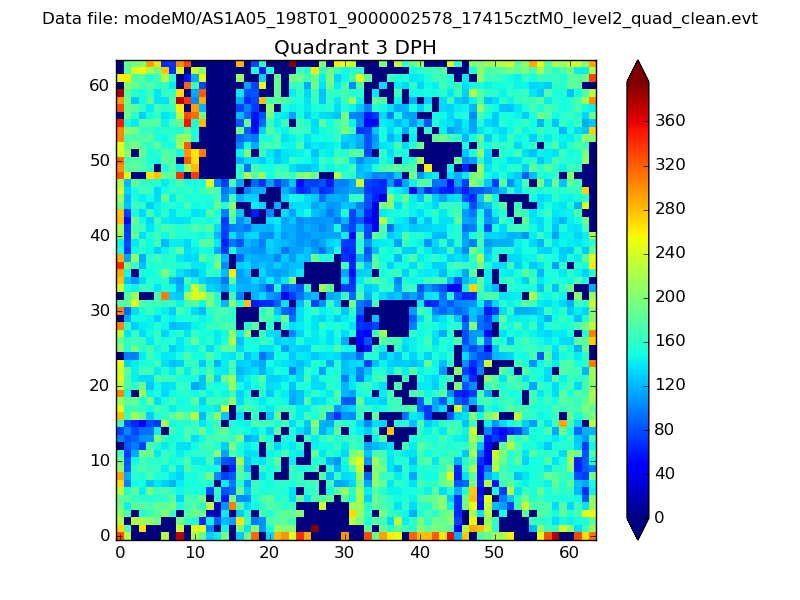 |
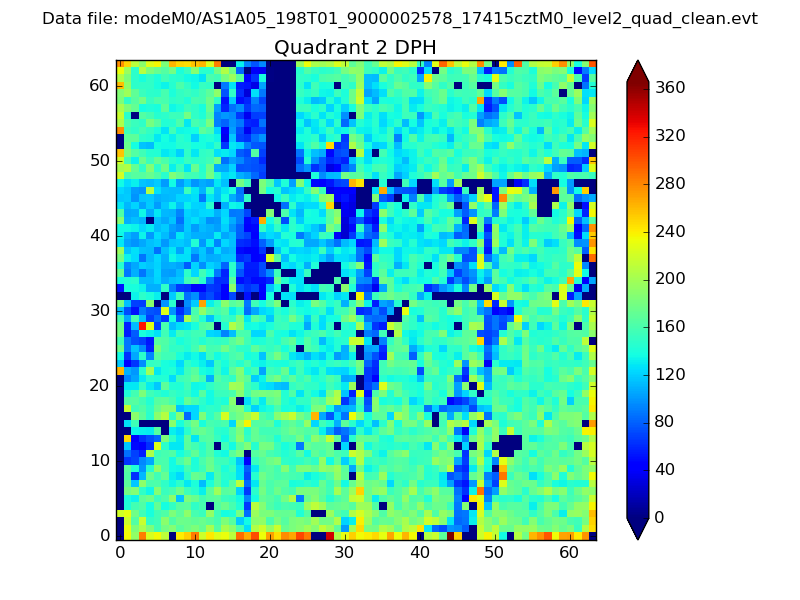 |
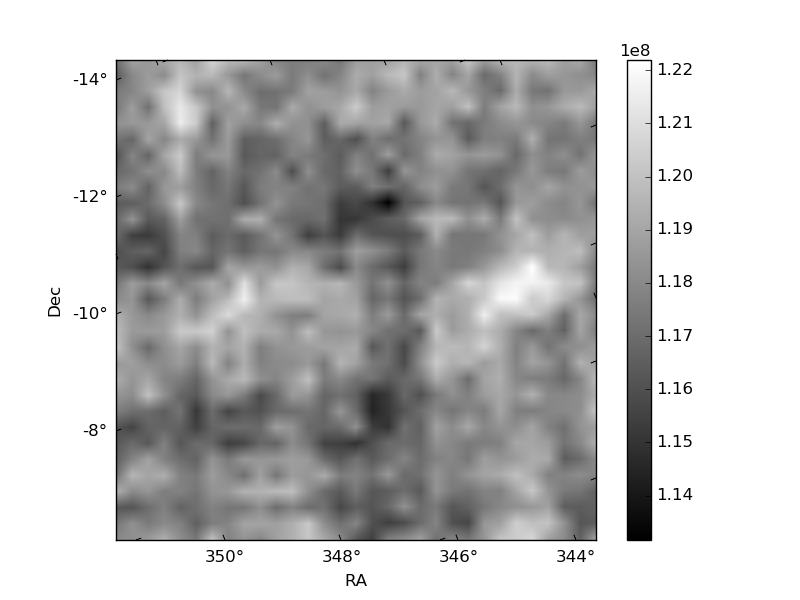
Quadrant C |
| Plot type | Count rate plots | Images |
|---|---|---|
| Comparison with Poisson distribution Blue bars denote a histogram of data divided into 1 sec bins. Red curve is a Poisson curve with rate = median count rate of data. |
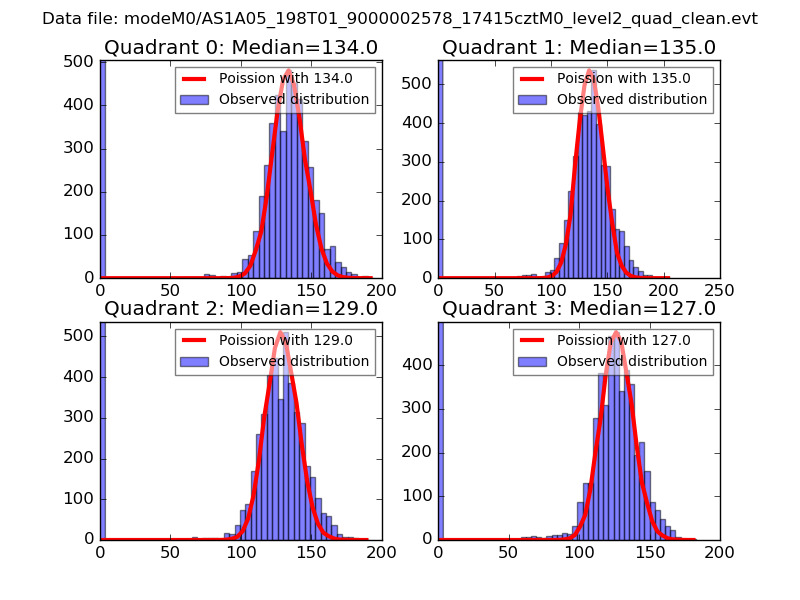 |
 |
| Quadrant-wise count rates Data is divided into 100 sec bins |
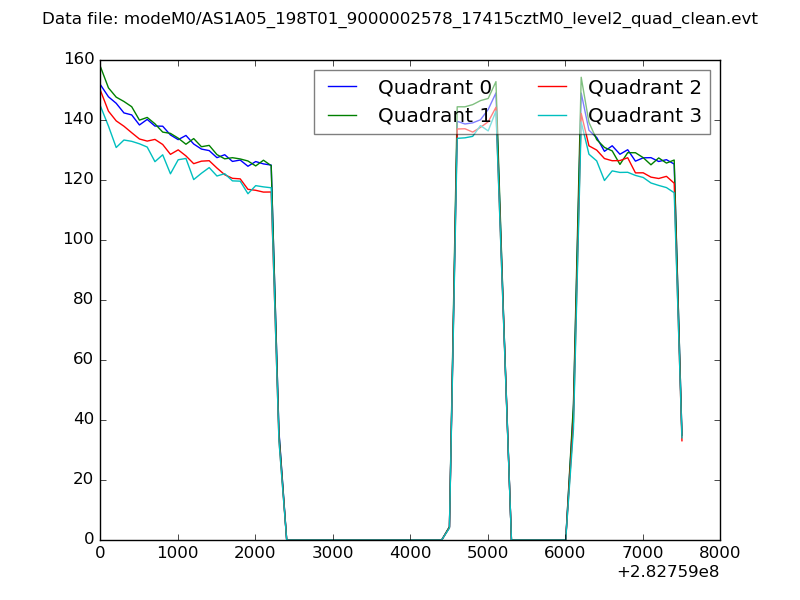 |
|
| Module-wise count rates for Quadrant A Data is divided into 100 sec bins |
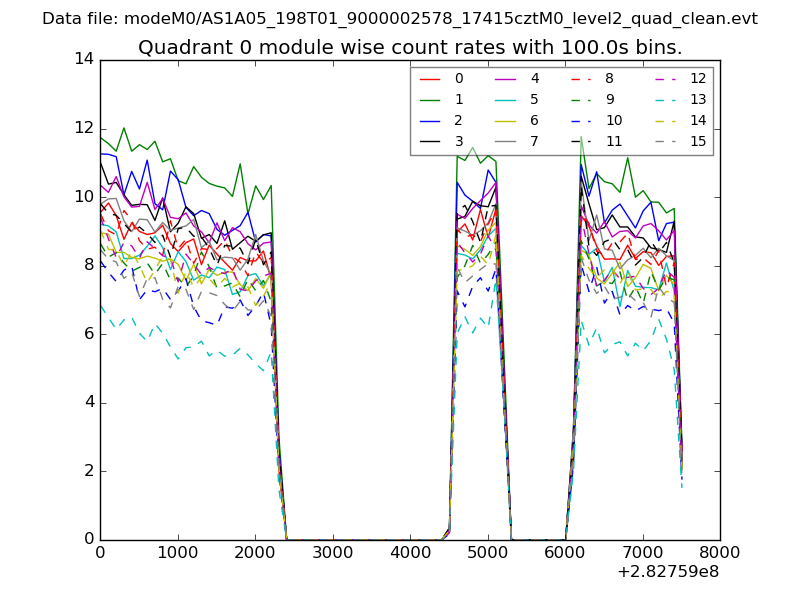 |
 |
| Module-wise count rates for Quadrant B Data is divided into 100 sec bins |
 |
 |
| Module-wise count rates for Quadrant C Data is divided into 100 sec bins |
 |
 |
| Module-wise count rates for Quadrant D Data is divided into 100 sec bins |
 |
 |
| Parameter | Plot |
|---|---|
| CZT HV Monitor | 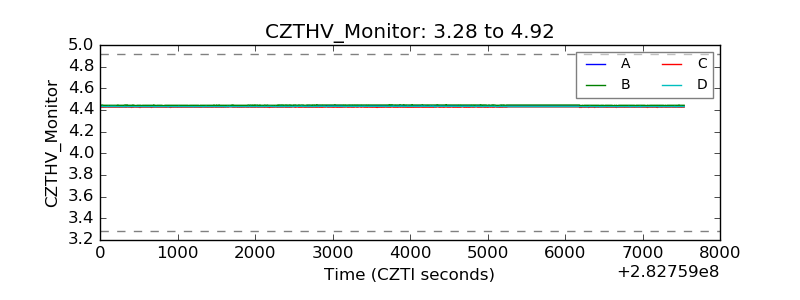 |
| D_VDD | 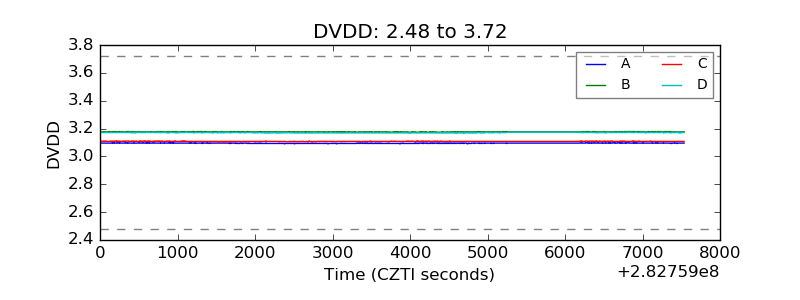 |
| Temperature 1 | 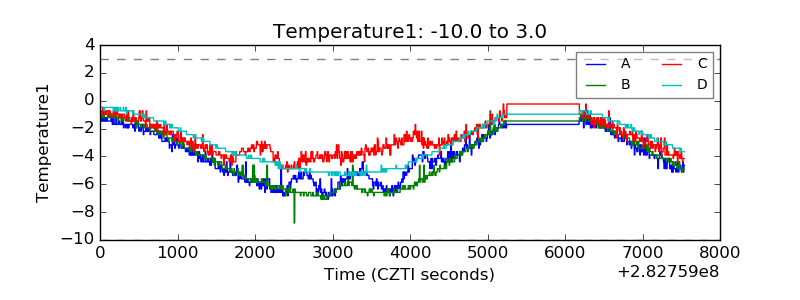 |
| Veto HV Monitor |  |
| Veto LLD |  |
| Alpha Counter | 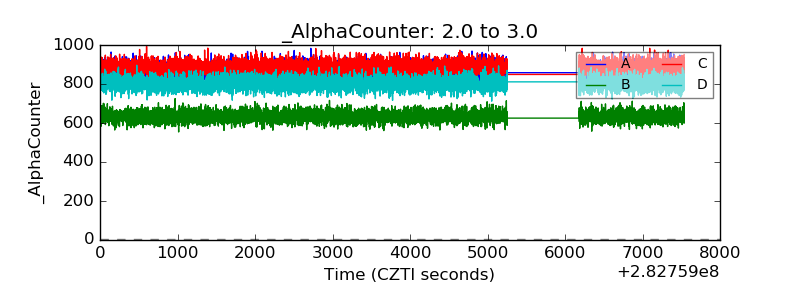 |
| _CPM_Rate | 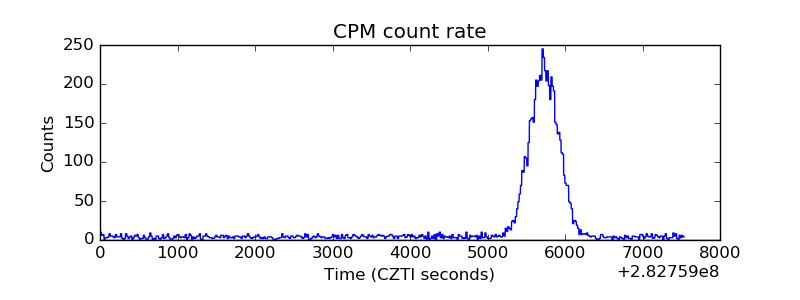 |
| CZT Counter | 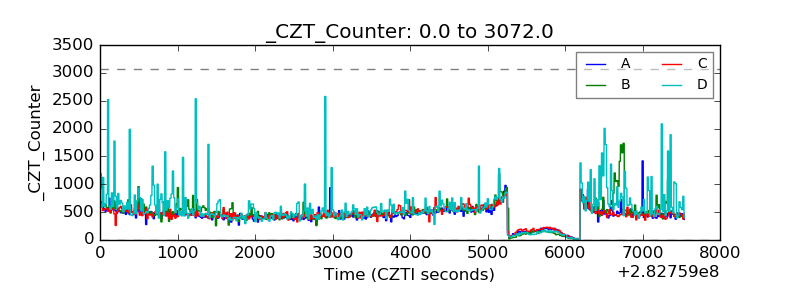 |
| +2.5 Volts monitor | 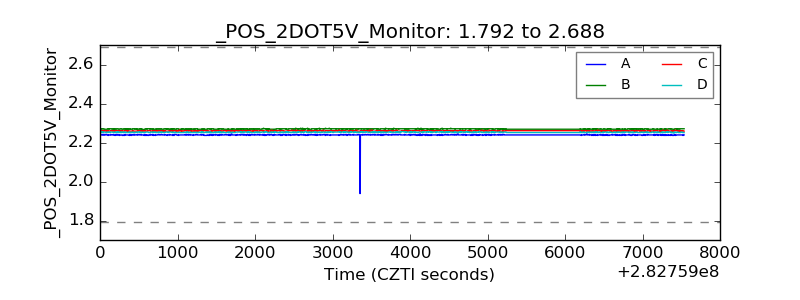 |
| +5 Volts monitor |  |
| _ROLL_ROT | 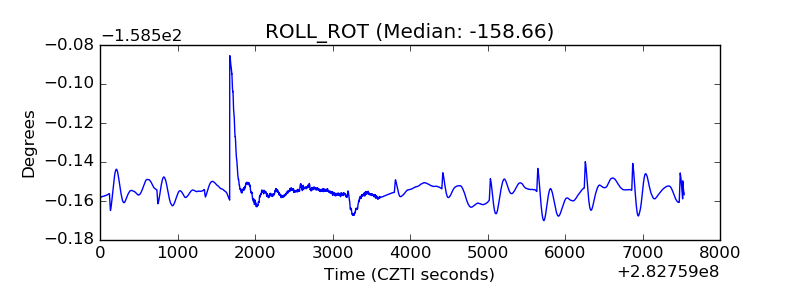 |
| _Roll_DEC | 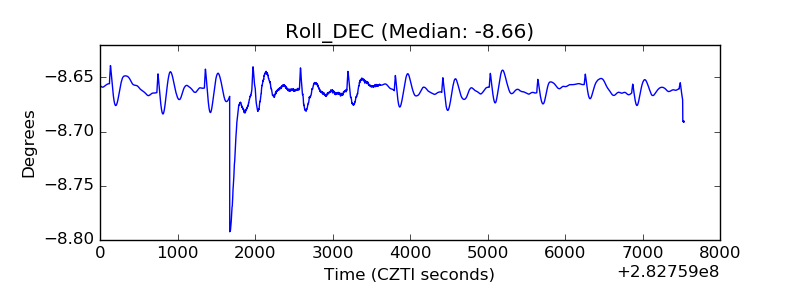 |
| _Roll_RA | 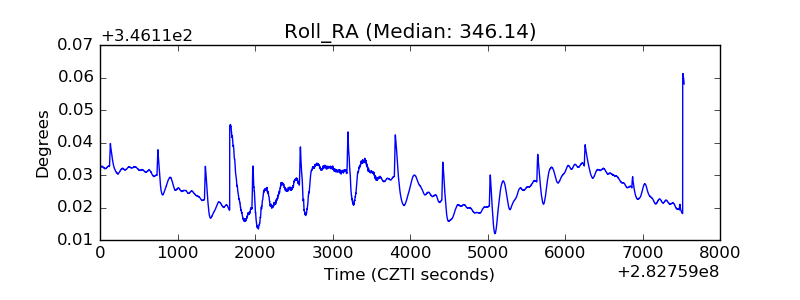 |
| Veto Counter | 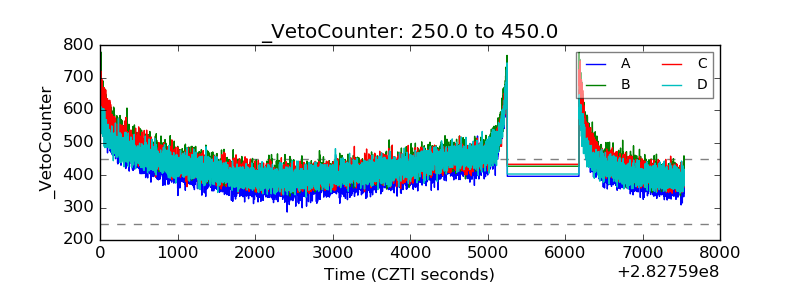 |