| Param | Original file | Final file |
|---|---|---|
| Filename | modeM0/AS1A05_198T01_9000002578_17416cztM0_level2.evt | modeM0/AS1A05_198T01_9000002578_17416cztM0_level2_quad_clean.evt |
| Size (bytes) | 528,312,960 | 102,113,280 |
| Size | 503.8 MB | 97.4 MB |
| Events in quadrant A | 3,511,926 | 658,537 |
| Events in quadrant B | 4,030,624 | 666,082 |
| Events in quadrant C | 3,625,089 | 635,303 |
| Events in quadrant D | 4,334,426 | 621,844 |
| Mode M9 | |||
|---|---|---|---|
| Quadrant | BADHDUFLAG | Total packets | Discarded packets |
| A | 0 | 14 | 0 |
| B | 0 | 14 | 0 |
| C | 0 | 14 | 0 |
| D | 0 | 14 | 0 |
| Mode M0 | |||
|---|---|---|---|
| Quadrant | BADHDUFLAG | Total packets | Discarded packets |
| A | 0 | 15338 | 2 |
| B | 0 | 16547 | 2 |
| C | 0 | 15325 | 3 |
| D | 0 | 17890 | 2 |
| Mode SS | |||
|---|---|---|---|
| Quadrant | BADHDUFLAG | Total packets | Discarded packets |
| A | 0 | 152 | 0 |
| B | 0 | 152 | 0 |
| C | 0 | 152 | 0 |
| D | 0 | 152 | 0 |
| Quadrant | Total seconds | Saturated seconds | Saturation percentage |
|---|---|---|---|
| A | 7331 | 61 | 0.832083% |
| B | 7332 | 136 | 1.854883% |
| C | 7331 | 96 | 1.309508% |
| D | 7331 | 123 | 1.677807% |
Noise dominated data is calculated using 1-second bins in cleaned event files. If a bin has >2000 counts, and if more than 50% of those come from <1% of pixels, then it is considered to be noise-dominated and hence unusable.
| Quadrant | # 1 sec bins | Bins with >0 counts | Bins with >2000 counts | High rate bins dominated by noise | Noise dominated (total time) | Noise dominated (detector-on time) | Marked lightcurve |
|---|---|---|---|---|---|---|---|
| A | 8731 | 7333 | 3 | 3 | 0.03% | 0.04% | 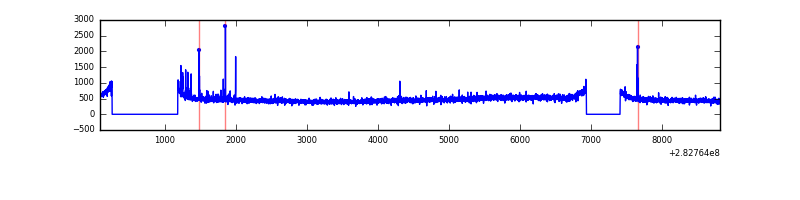 |
| B | 8732 | 7334 | 11 | 11 | 0.13% | 0.15% | 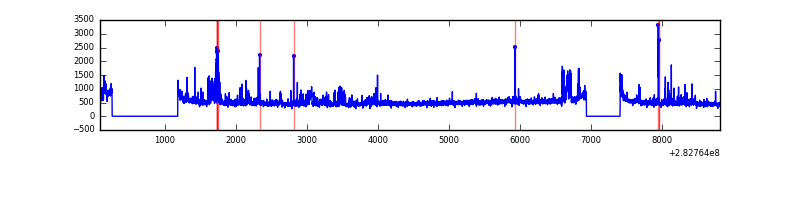 |
| C | 8731 | 7333 | 0 | 0 | 0.00% | 0.00% | 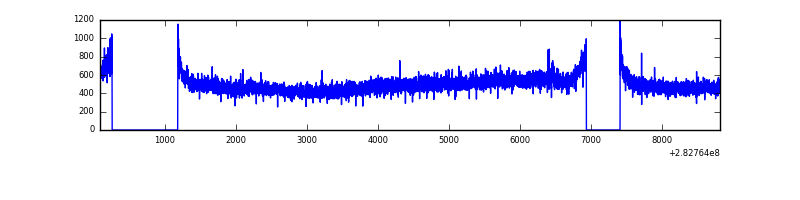 |
| D | 8731 | 7333 | 76 | 76 | 0.87% | 1.04% | 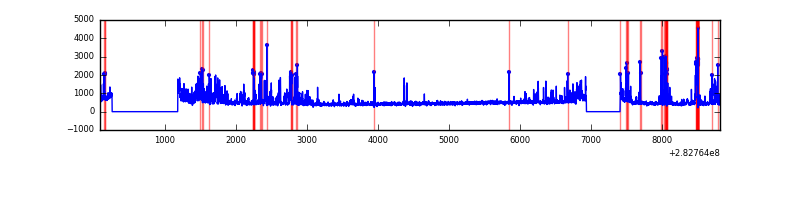 |
Top three noisy pixels from each quadrant. If the there are fewer than three noisy pixels in the level2.evt file, extra rows are filled as -1
| Pixel properties | Quadrant properties | ||||||
|---|---|---|---|---|---|---|---|
| Quadrant | DetID | PixID | Counts | Sigma | Mean | Median | Sigma |
| A | 4 | 2 | 44346 | 237.06 | 900 | 880 | 183.4 |
| A | 0 | 226 | 8021 | 38.95 | 900 | 880 | 183.4 |
| A | 13 | 210 | 6747 | 32.0 | 900 | 880 | 183.4 |
| B | 15 | 35 | 173455 | 995.32 | 902 | 880 | 173.4 |
| B | 0 | 219 | 108743 | 622.09 | 902 | 880 | 173.4 |
| B | 7 | 220 | 66074 | 376.0 | 902 | 880 | 173.4 |
| C | 14 | 238 | 132583 | 652.2 | 855 | 860 | 202.0 |
| C | 5 | 218 | 86925 | 426.13 | 855 | 860 | 202.0 |
| C | 3 | 233 | 34936 | 168.72 | 855 | 860 | 202.0 |
| D | 11 | 176 | 434986 | 2024.91 | 865 | 840 | 214.4 |
| D | 13 | 232 | 179533 | 833.44 | 865 | 840 | 214.4 |
| D | 13 | 189 | 166432 | 772.34 | 865 | 840 | 214.4 |
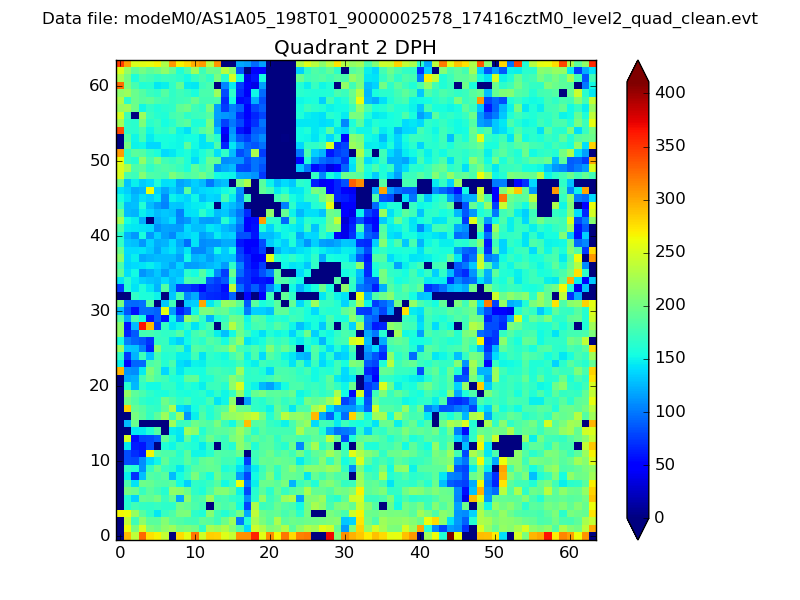
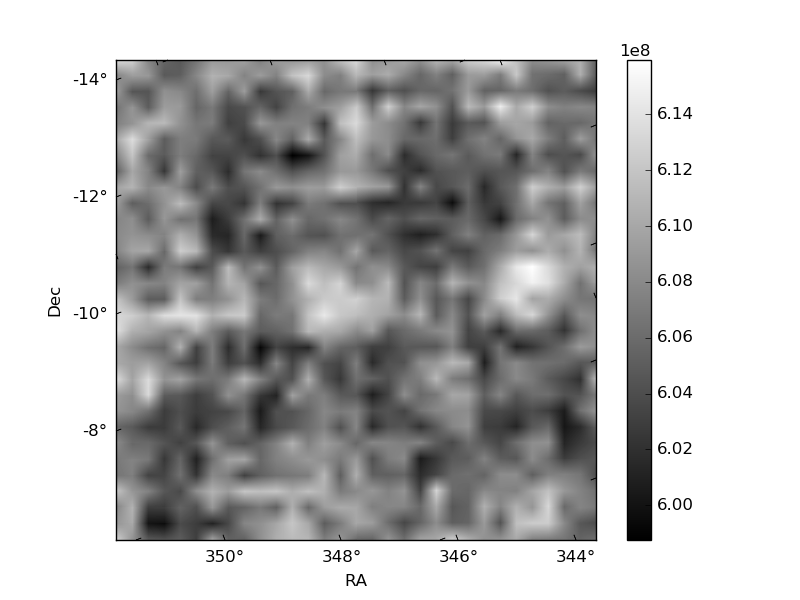
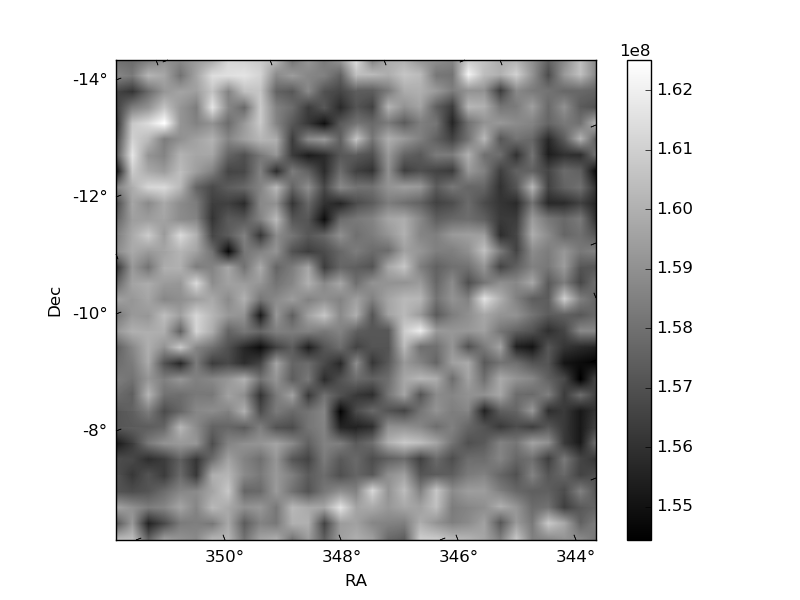
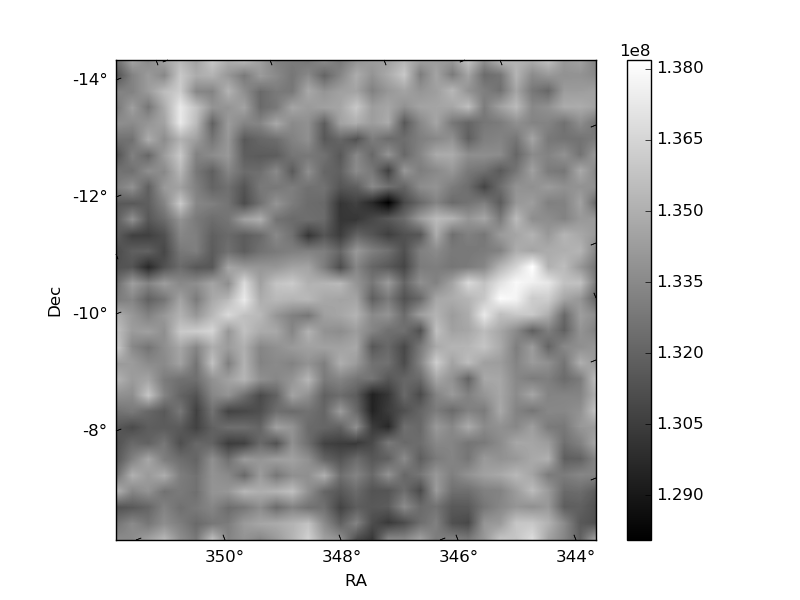
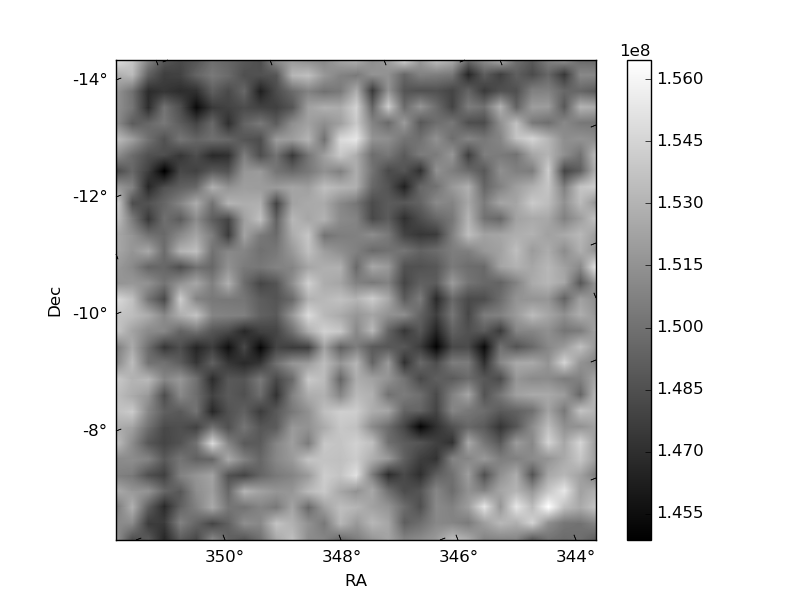
Histogram calculated using DETX and DETY for each event in the final _common_clean file
| Quadrant A | 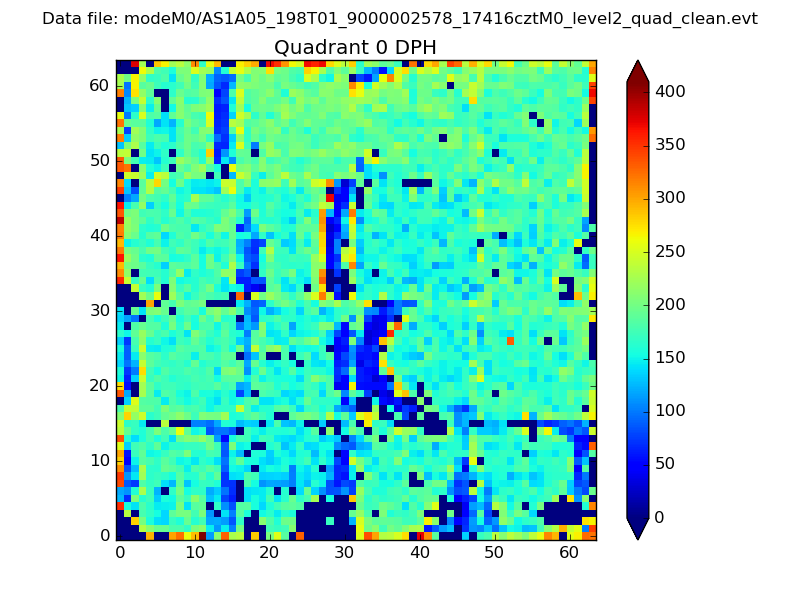 |
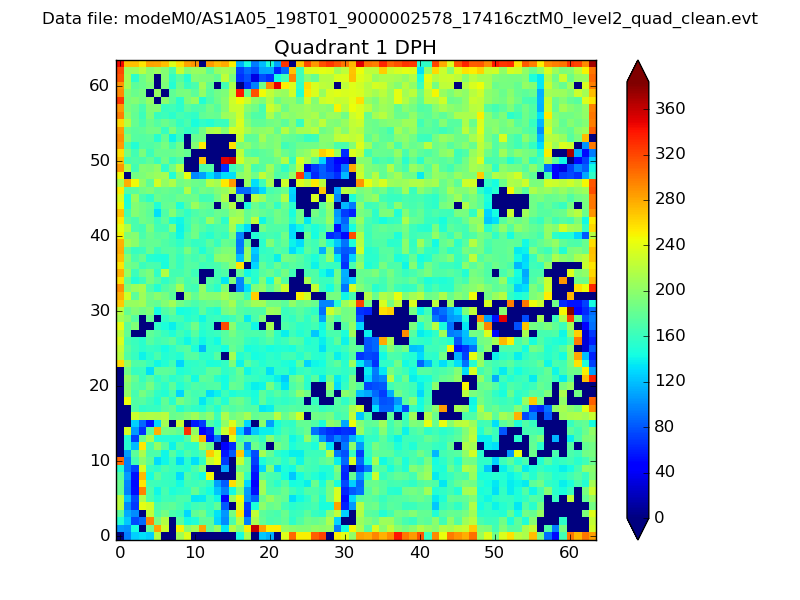 |
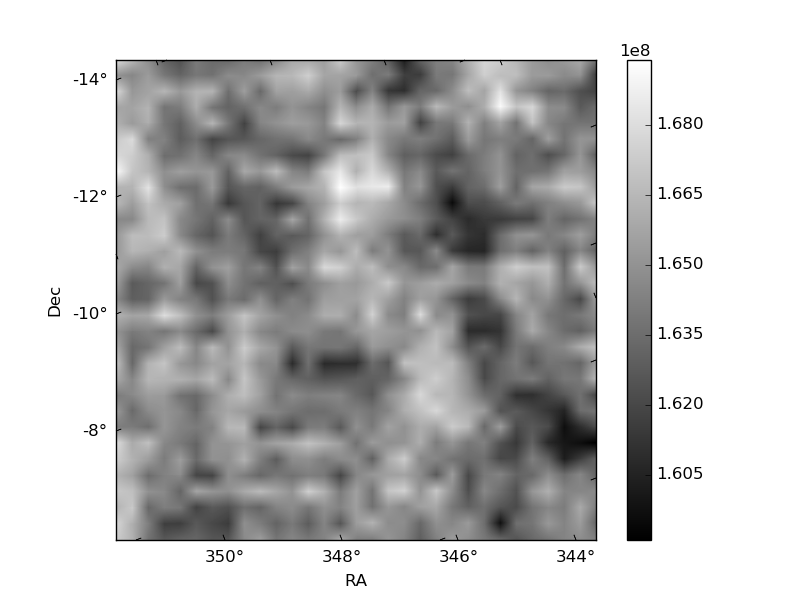
Quadrant B |
|---|---|---|---|
| Quadrant D | 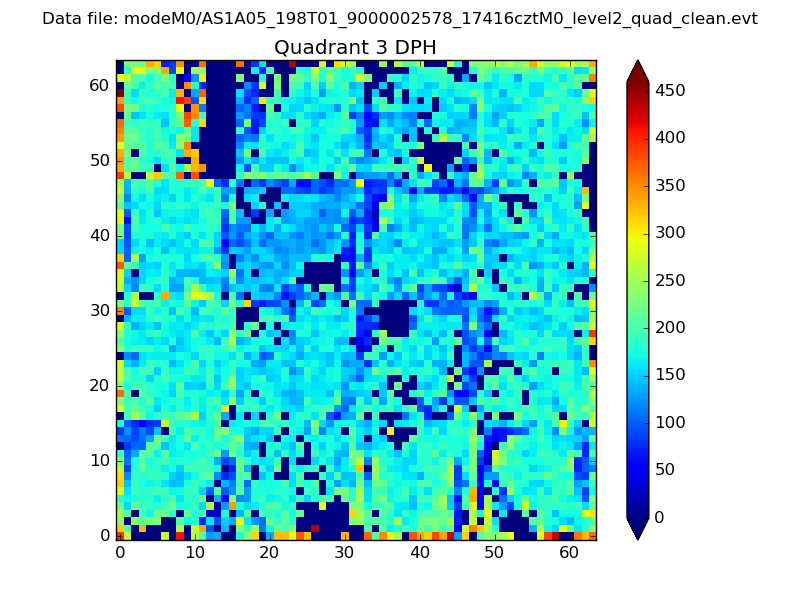 |
 |
Quadrant C |
| Plot type | Count rate plots | Images |
|---|---|---|
| Comparison with Poisson distribution Blue bars denote a histogram of data divided into 1 sec bins. Red curve is a Poisson curve with rate = median count rate of data. |
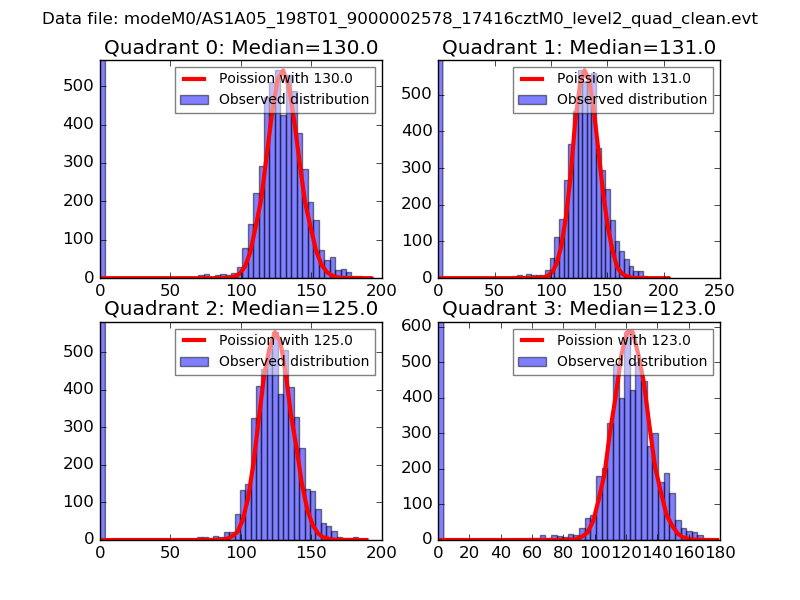 |
 |
| Quadrant-wise count rates Data is divided into 100 sec bins |
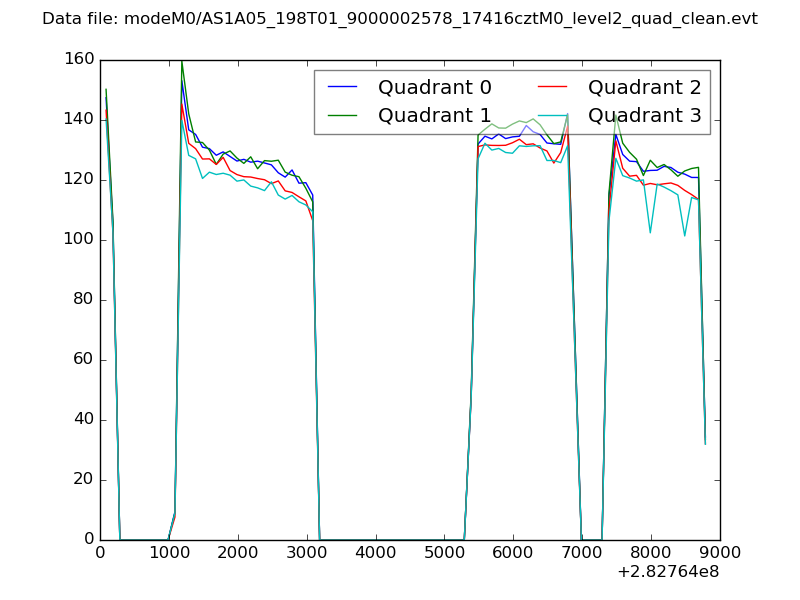 |
|
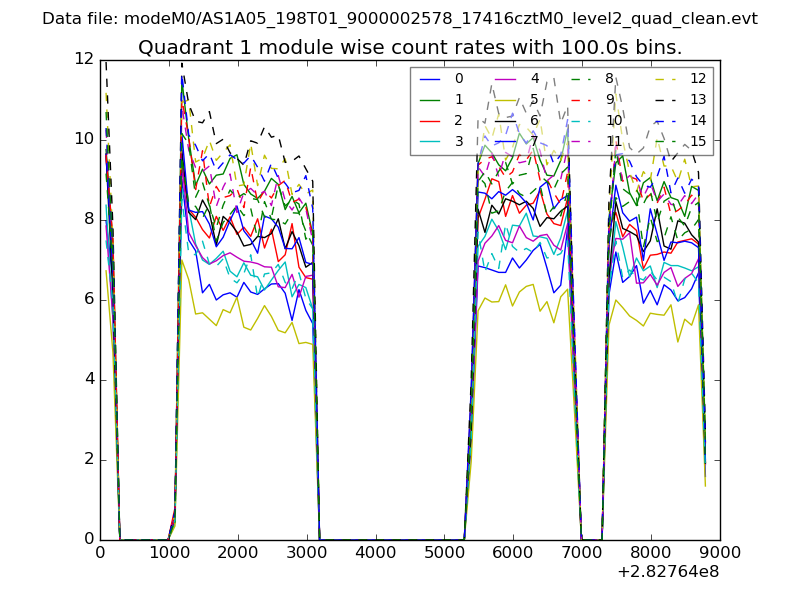
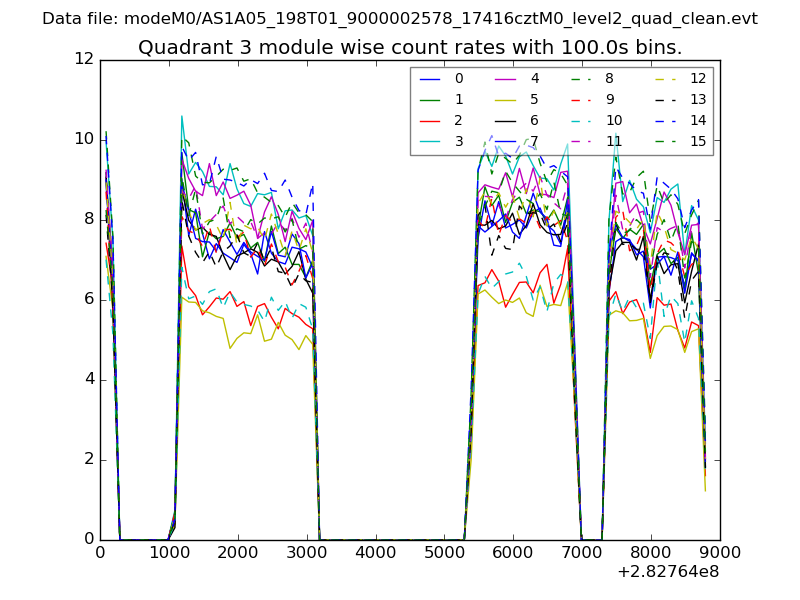
| Module-wise count rates for Quadrant A Data is divided into 100 sec bins |
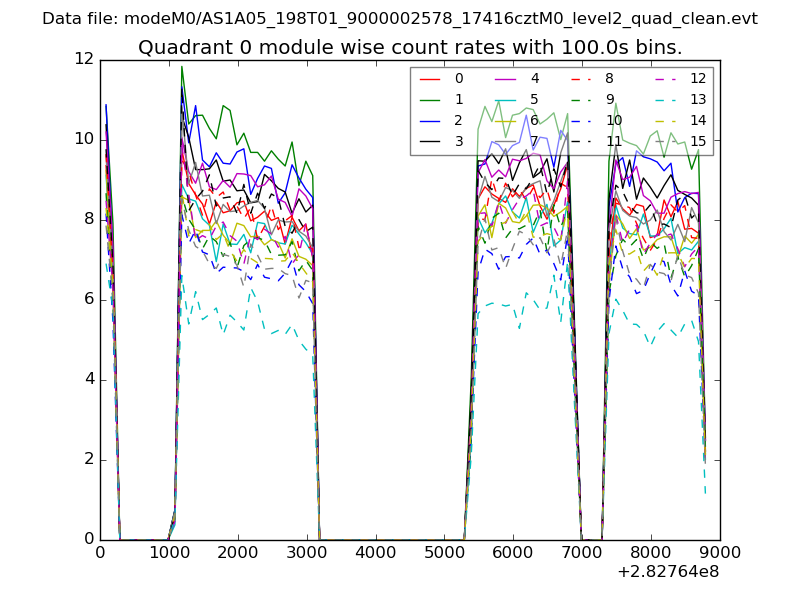 |
 |
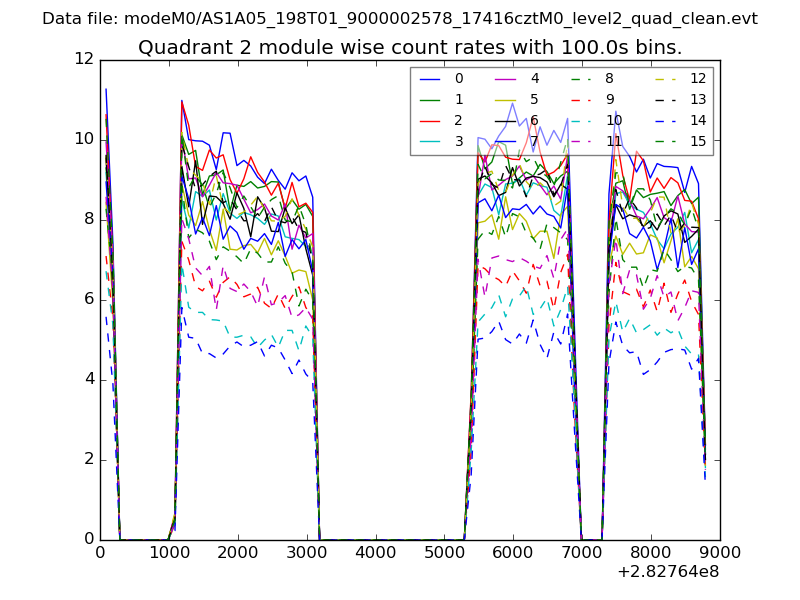
| Module-wise count rates for Quadrant B Data is divided into 100 sec bins |
 |
 |
| Module-wise count rates for Quadrant C Data is divided into 100 sec bins |
 |
 |
| Module-wise count rates for Quadrant D Data is divided into 100 sec bins |
 |
 |
| Parameter | Plot |
|---|---|
| CZT HV Monitor | 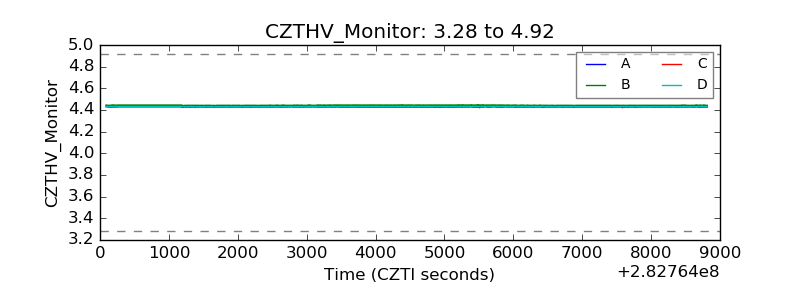 |
| D_VDD | 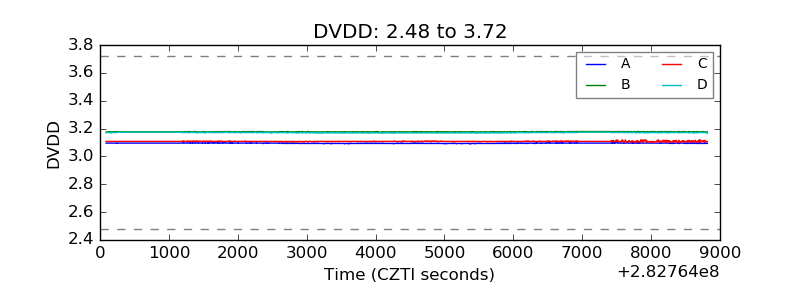 |
| Temperature 1 | 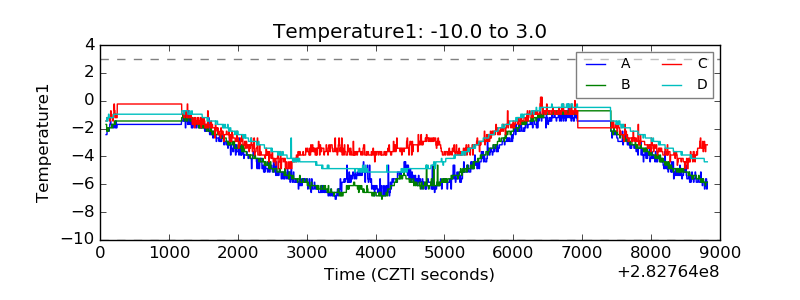 |
| Veto HV Monitor | 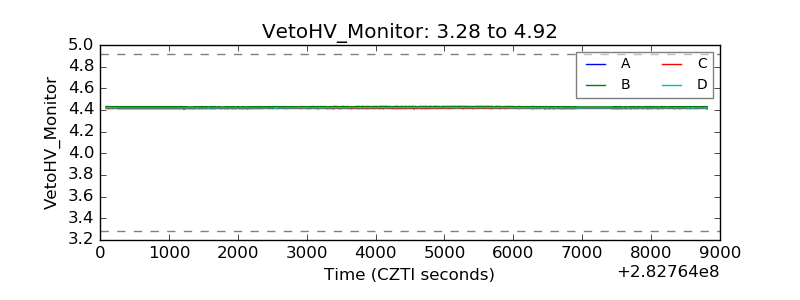 |
| Veto LLD | 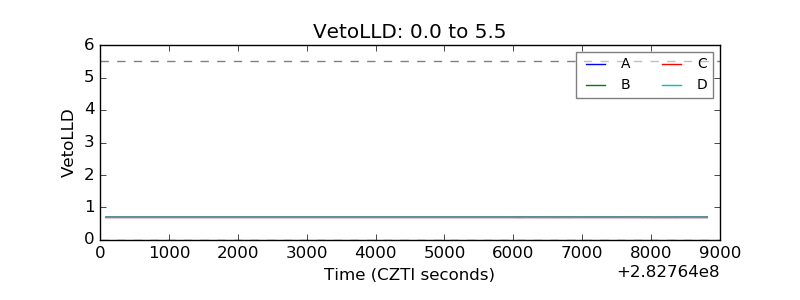 |
| Alpha Counter | 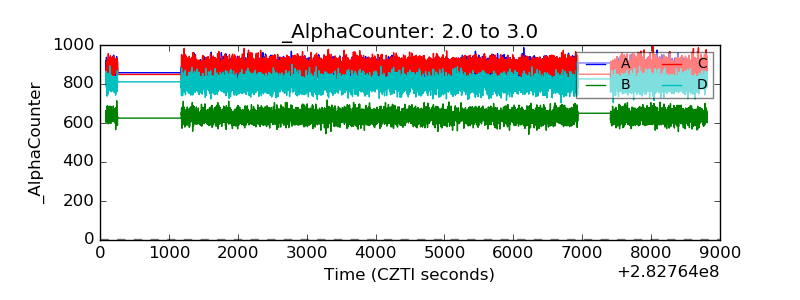 |
| _CPM_Rate | 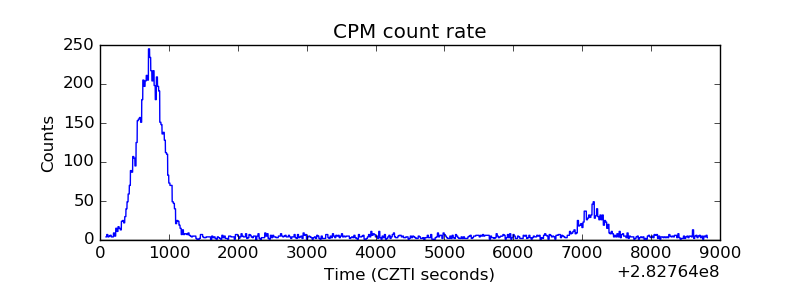 |
| CZT Counter | 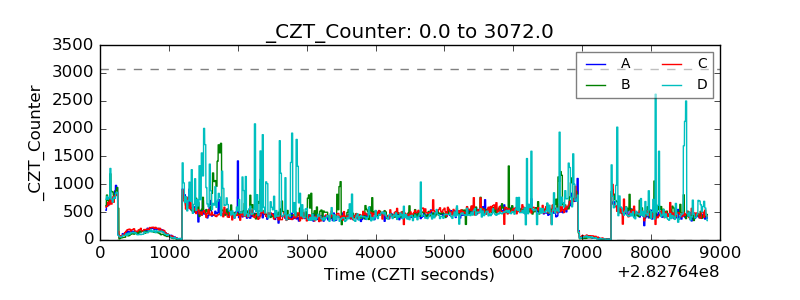 |
| +2.5 Volts monitor |  |
| +5 Volts monitor | 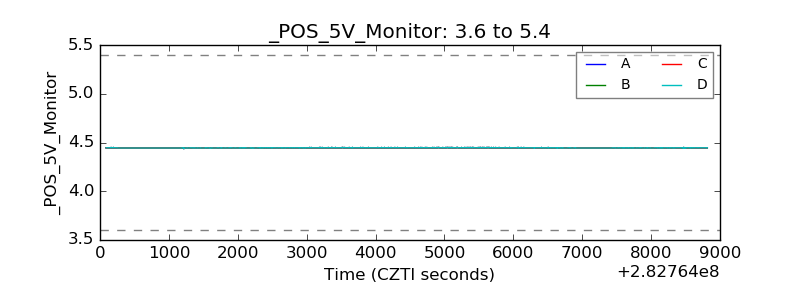 |
| _ROLL_ROT | 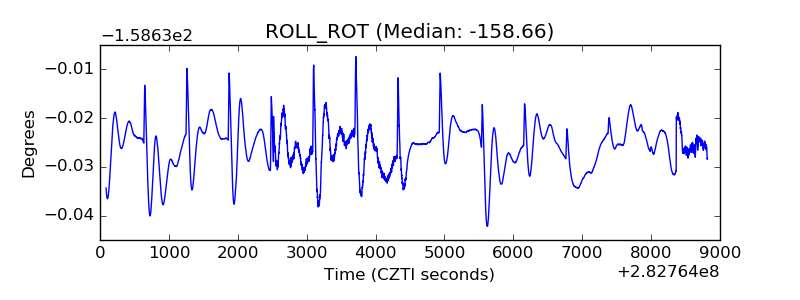 |
| _Roll_DEC | 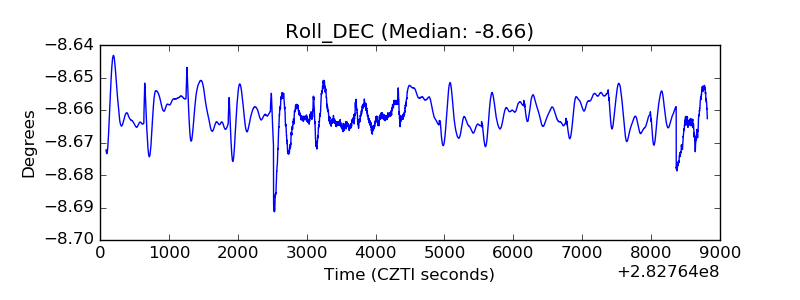 |
| _Roll_RA | 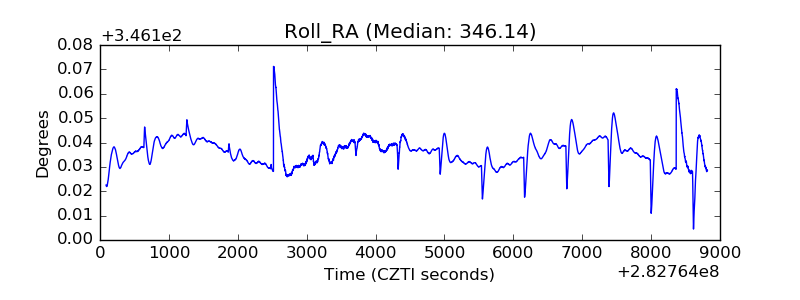 |
| Veto Counter | 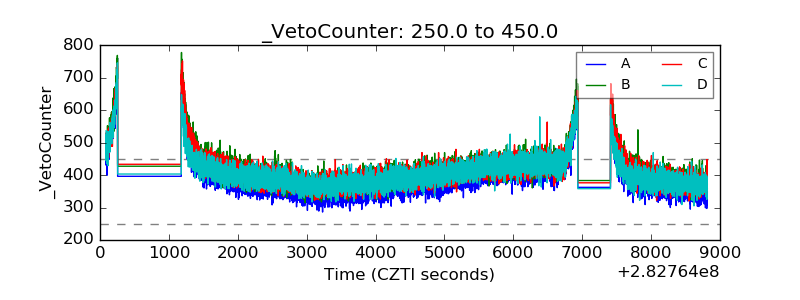 |