| Param | Original file | Final file |
|---|---|---|
| Filename | modeM0/AS1A05_198T01_9000002578_17418cztM0_level2.evt | modeM0/AS1A05_198T01_9000002578_17418cztM0_level2_quad_clean.evt |
| Size (bytes) | 533,894,400 | 96,540,480 |
| Size | 509.2 MB | 92.1 MB |
| Events in quadrant A | 3,682,794 | 606,146 |
| Events in quadrant B | 3,990,336 | 612,571 |
| Events in quadrant C | 3,854,412 | 584,299 |
| Events in quadrant D | 4,110,848 | 577,041 |
| Mode M9 | |||
|---|---|---|---|
| Quadrant | BADHDUFLAG | Total packets | Discarded packets |
| A | 0 | 4 | 0 |
| B | 0 | 4 | 0 |
| C | 0 | 4 | 0 |
| D | 0 | 4 | 0 |
| Mode M0 | |||
|---|---|---|---|
| Quadrant | BADHDUFLAG | Total packets | Discarded packets |
| A | 0 | 16245 | 2 |
| B | 0 | 16895 | 2 |
| C | 0 | 16350 | 2 |
| D | 0 | 17745 | 2 |
| Mode SS | |||
|---|---|---|---|
| Quadrant | BADHDUFLAG | Total packets | Discarded packets |
| A | 0 | 162 | 0 |
| B | 0 | 162 | 0 |
| C | 0 | 162 | 0 |
| D | 0 | 162 | 0 |
| Quadrant | Total seconds | Saturated seconds | Saturation percentage |
|---|---|---|---|
| A | 7807 | 109 | 1.396183% |
| B | 7807 | 188 | 2.408095% |
| C | 7806 | 171 | 2.190623% |
| D | 7807 | 178 | 2.280005% |
Noise dominated data is calculated using 1-second bins in cleaned event files. If a bin has >2000 counts, and if more than 50% of those come from <1% of pixels, then it is considered to be noise-dominated and hence unusable.
| Quadrant | # 1 sec bins | Bins with >0 counts | Bins with >2000 counts | High rate bins dominated by noise | Noise dominated (total time) | Noise dominated (detector-on time) | Marked lightcurve |
|---|---|---|---|---|---|---|---|
| A | 8237 | 7810 | 0 | 0 | 0.00% | 0.00% | 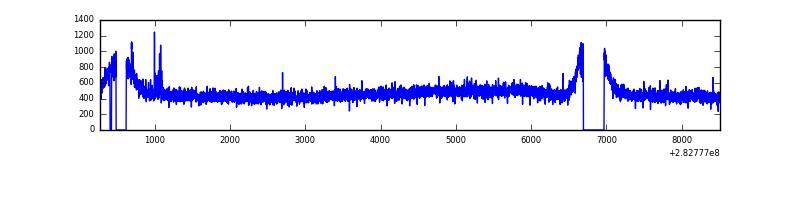 |
| B | 8237 | 7810 | 2 | 2 | 0.02% | 0.03% | 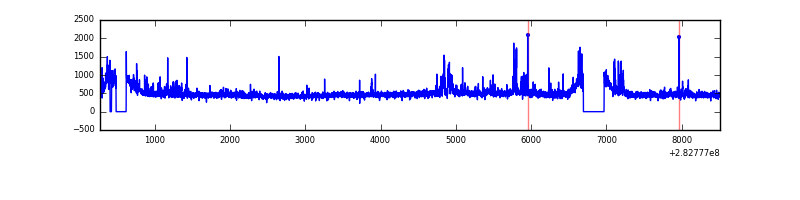 |
| C | 8236 | 7809 | 0 | 0 | 0.00% | 0.00% | 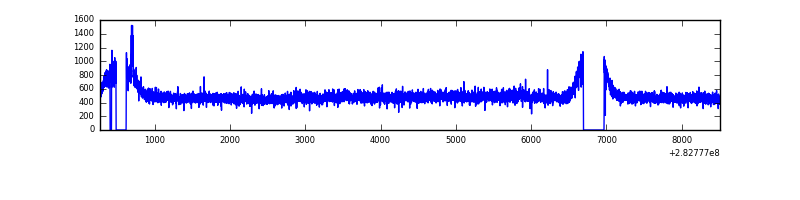 |
| D | 8237 | 7810 | 81 | 81 | 0.98% | 1.04% |  |
Top three noisy pixels from each quadrant. If the there are fewer than three noisy pixels in the level2.evt file, extra rows are filled as -1
| Pixel properties | Quadrant properties | ||||||
|---|---|---|---|---|---|---|---|
| Quadrant | DetID | PixID | Counts | Sigma | Mean | Median | Sigma |
| A | 6 | 16 | 15360 | 73.28 | 953 | 930 | 196.9 |
| A | 0 | 226 | 8138 | 36.61 | 953 | 930 | 196.9 |
| A | 3 | 137 | 7307 | 32.39 | 953 | 930 | 196.9 |
| B | 0 | 219 | 62729 | 333.62 | 953 | 928 | 185.2 |
| B | 0 | 197 | 51123 | 270.97 | 953 | 928 | 185.2 |
| B | 0 | 230 | 46099 | 243.85 | 953 | 928 | 185.2 |
| C | 14 | 238 | 138455 | 634.06 | 910 | 914 | 216.9 |
| C | 5 | 218 | 65277 | 296.71 | 910 | 914 | 216.9 |
| C | 3 | 233 | 62463 | 283.74 | 910 | 914 | 216.9 |
| D | 13 | 189 | 208453 | 906.68 | 922 | 895 | 228.9 |
| D | 13 | 232 | 102272 | 442.85 | 922 | 895 | 228.9 |
| D | 7 | 38 | 90120 | 389.76 | 922 | 895 | 228.9 |
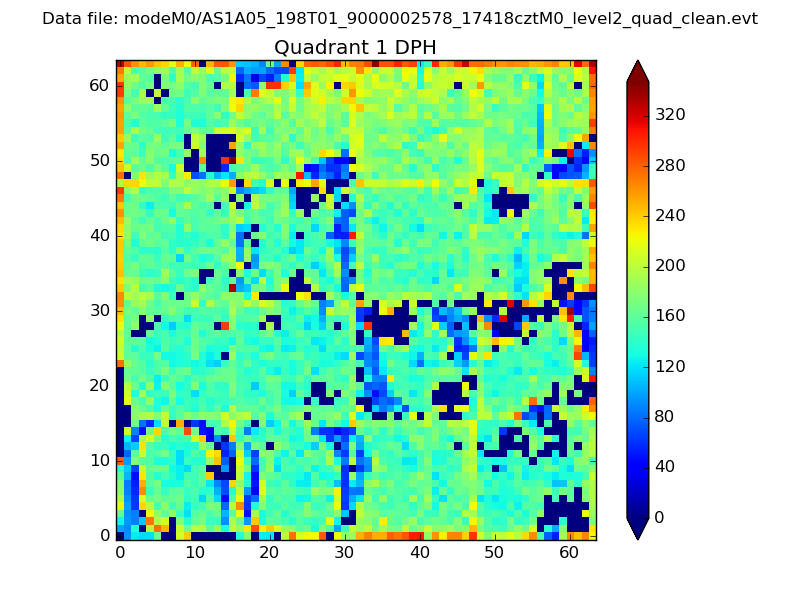
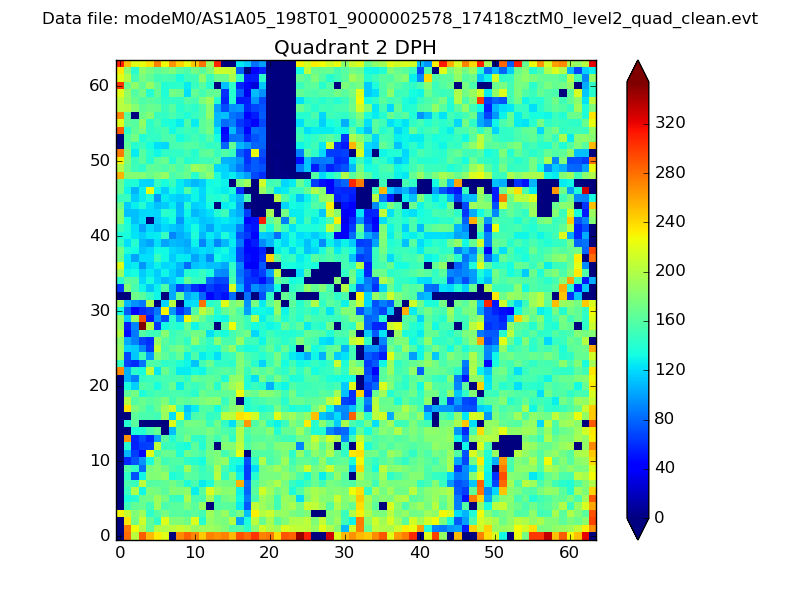
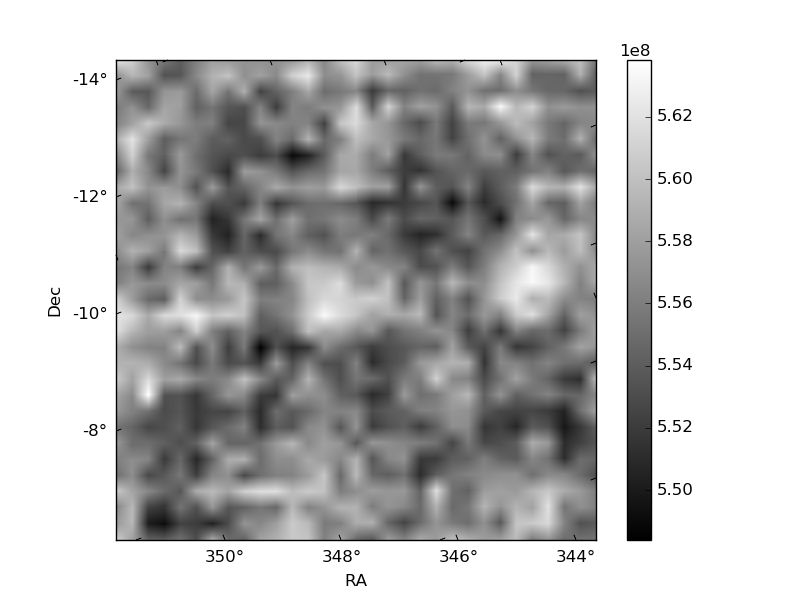
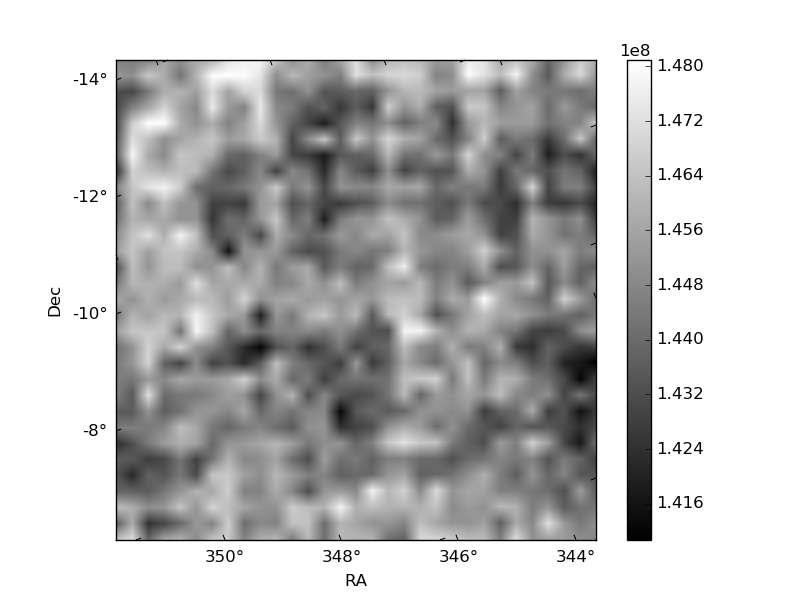
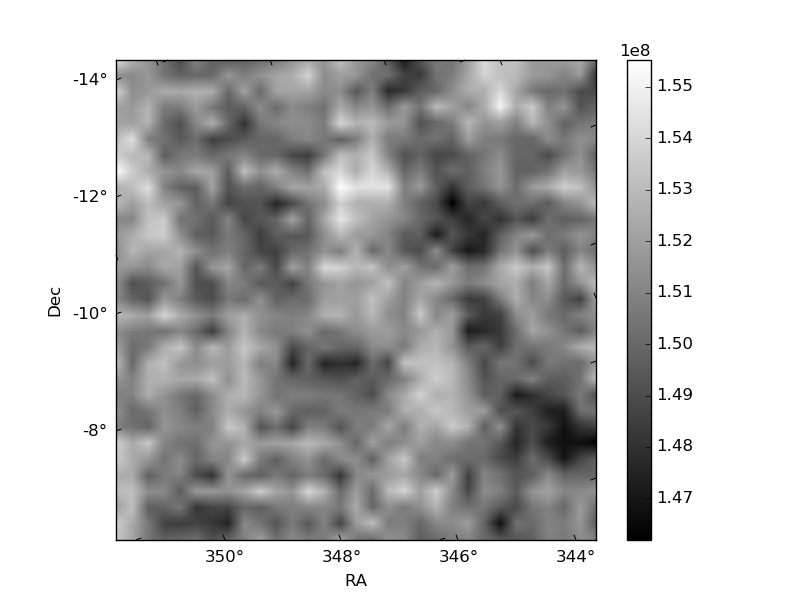
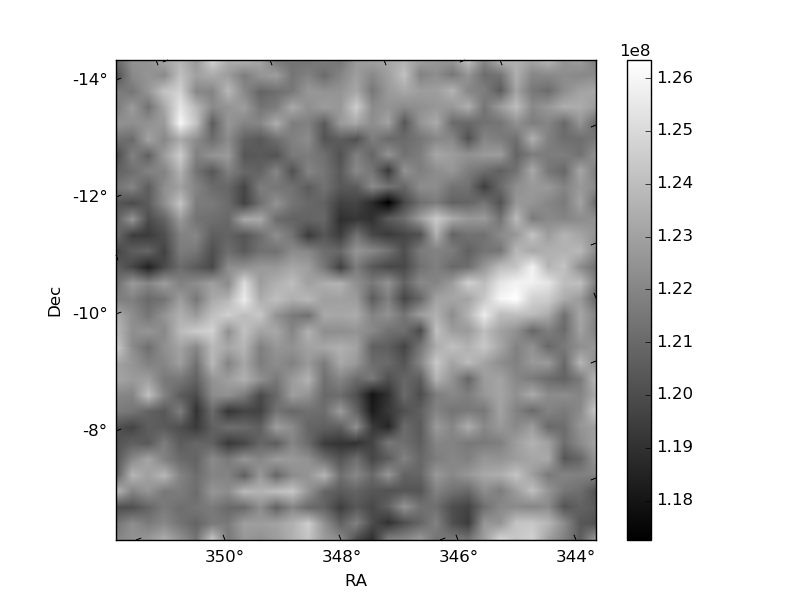
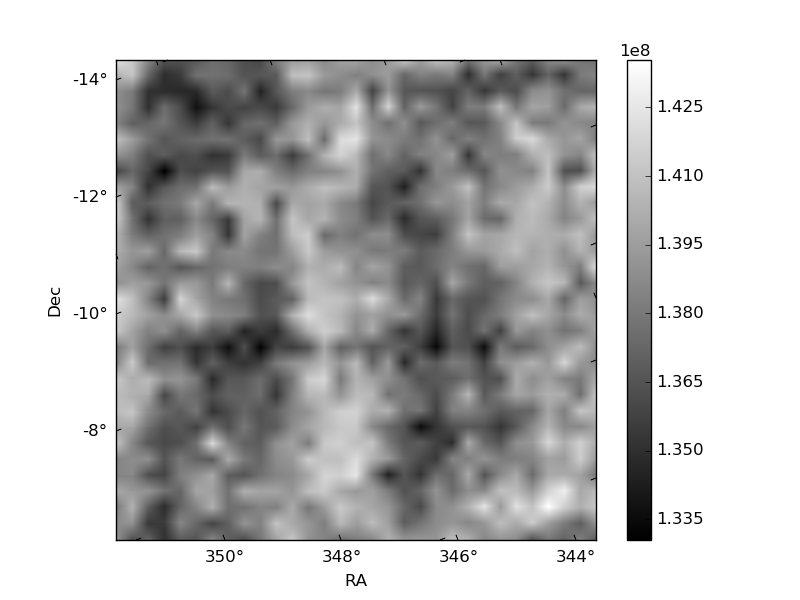
Histogram calculated using DETX and DETY for each event in the final _common_clean file
| Quadrant A | 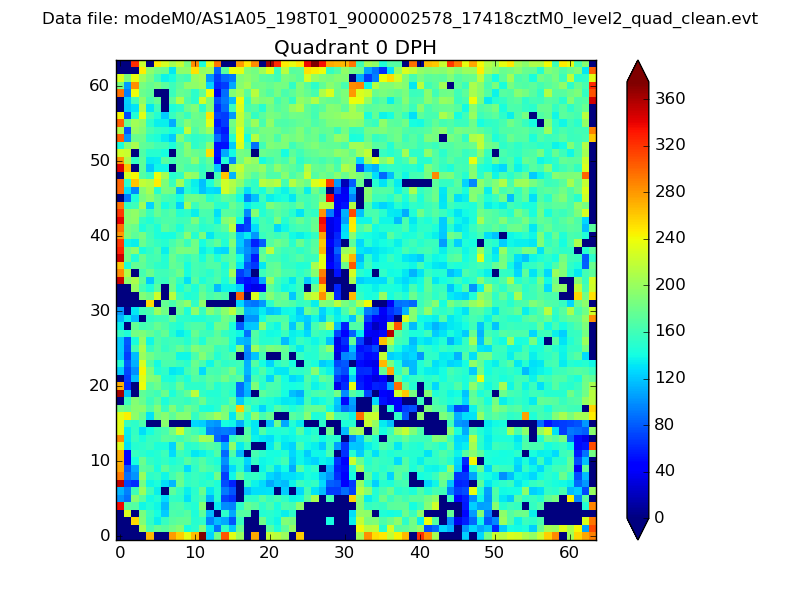 |
 |
Quadrant B |
|---|---|---|---|
| Quadrant D | 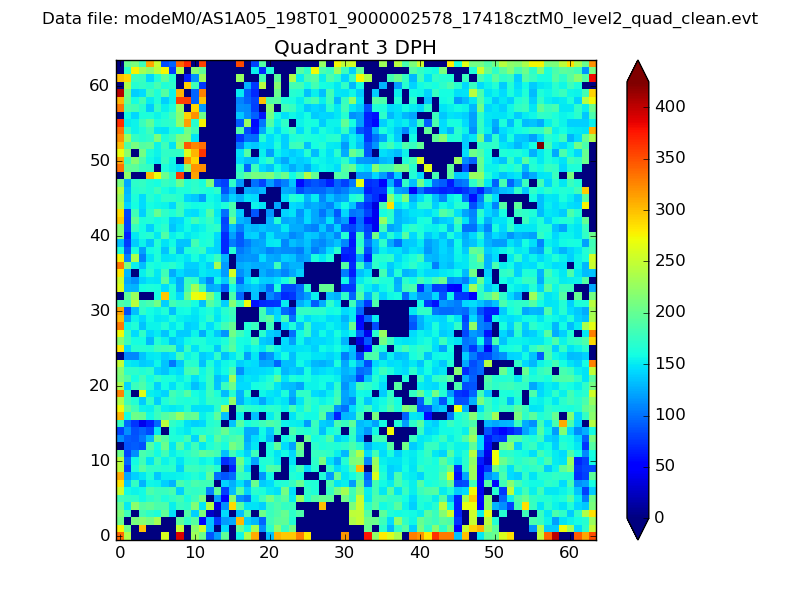 |
 |
Quadrant C |
| Plot type | Count rate plots | Images |
|---|---|---|
| Comparison with Poisson distribution Blue bars denote a histogram of data divided into 1 sec bins. Red curve is a Poisson curve with rate = median count rate of data. |
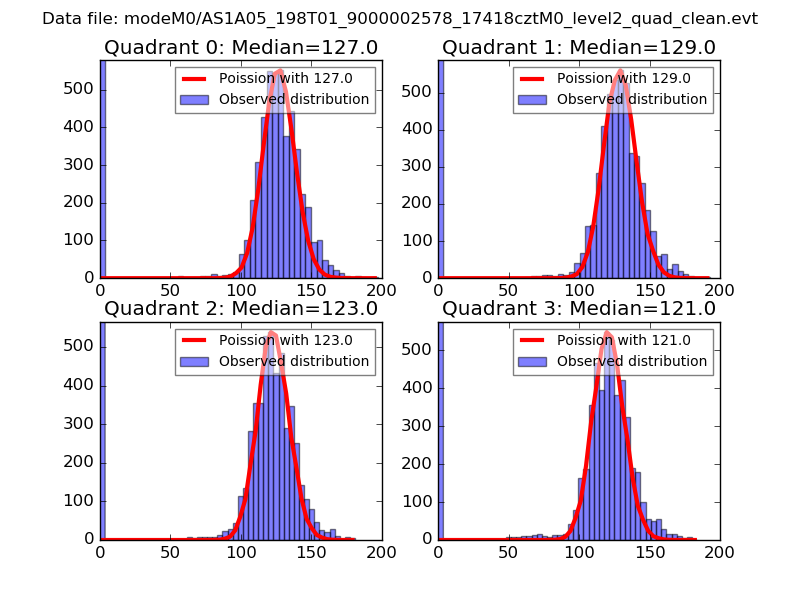 |
 |
| Quadrant-wise count rates Data is divided into 100 sec bins |
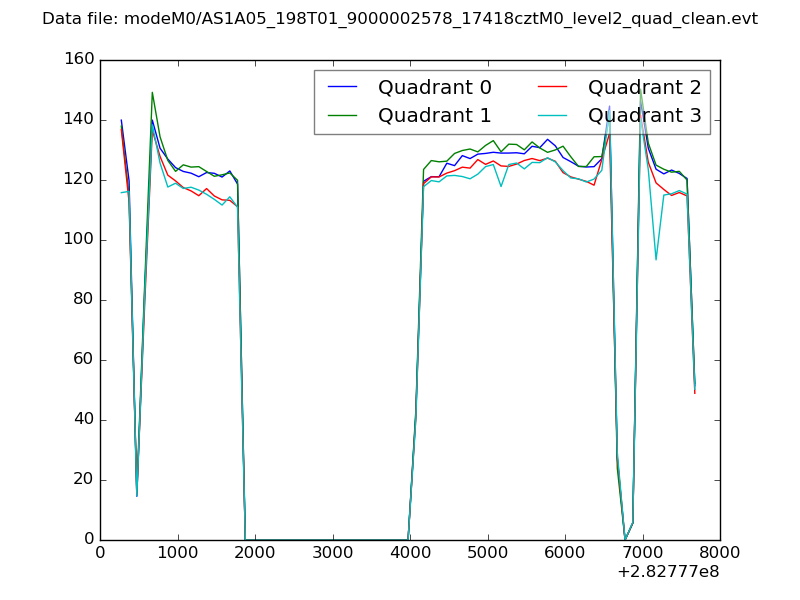 |
|
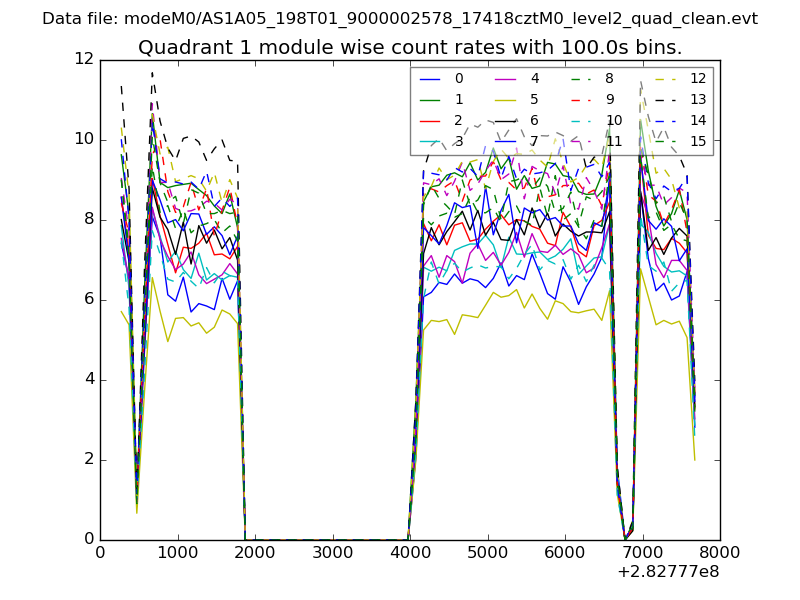
| Module-wise count rates for Quadrant A Data is divided into 100 sec bins |
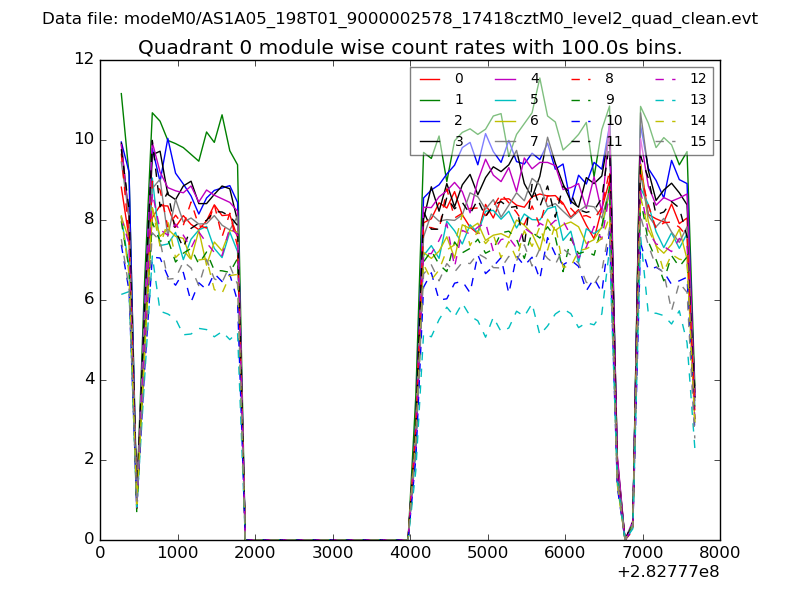 |
 |
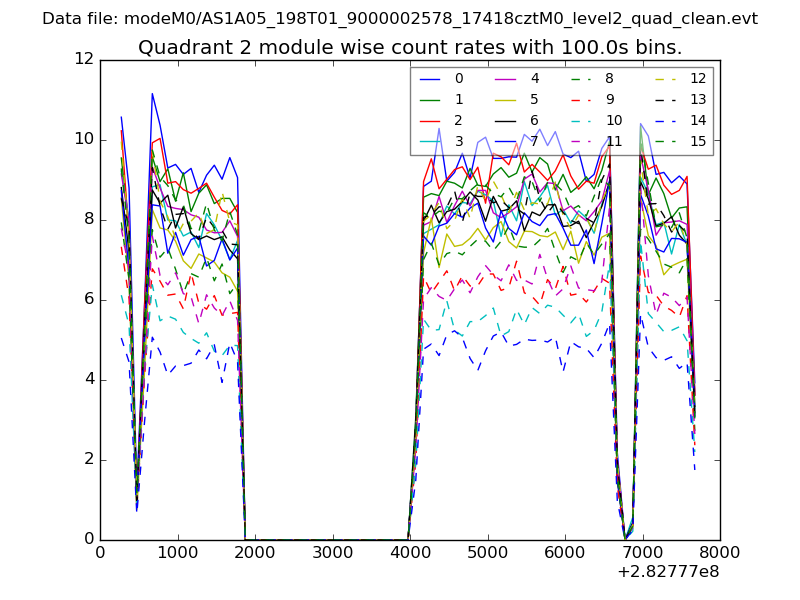
| Module-wise count rates for Quadrant B Data is divided into 100 sec bins |
 |
 |
| Module-wise count rates for Quadrant C Data is divided into 100 sec bins |
 |
 |
| Module-wise count rates for Quadrant D Data is divided into 100 sec bins |
 |
 |
| Parameter | Plot |
|---|---|
| CZT HV Monitor | 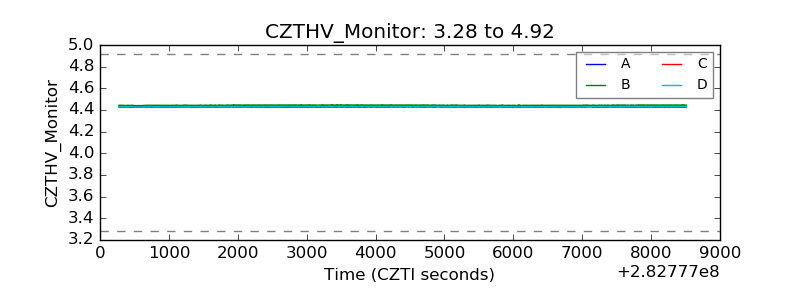 |
| D_VDD | 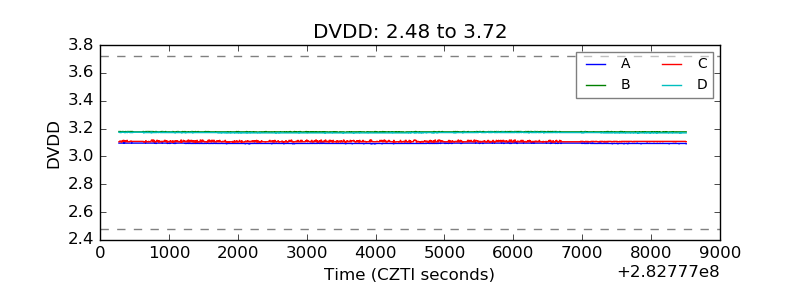 |
| Temperature 1 | 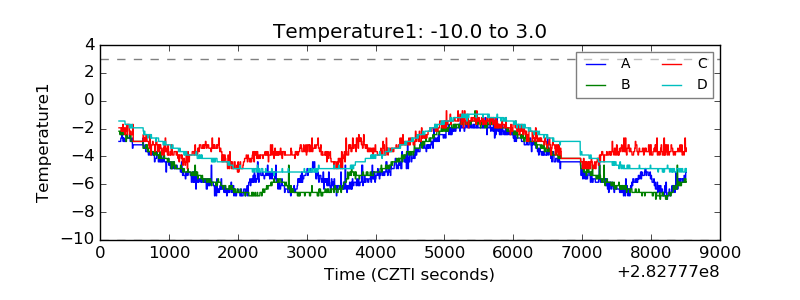 |
| Veto HV Monitor | 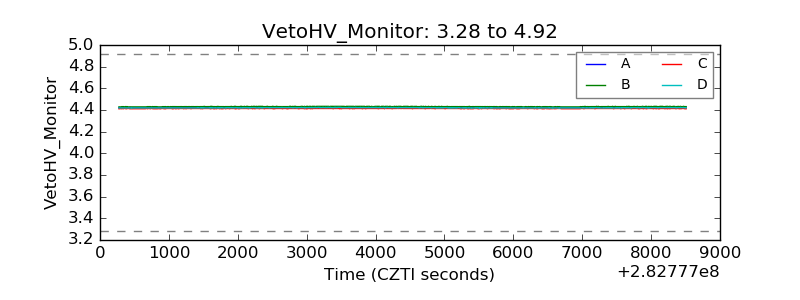 |
| Veto LLD | 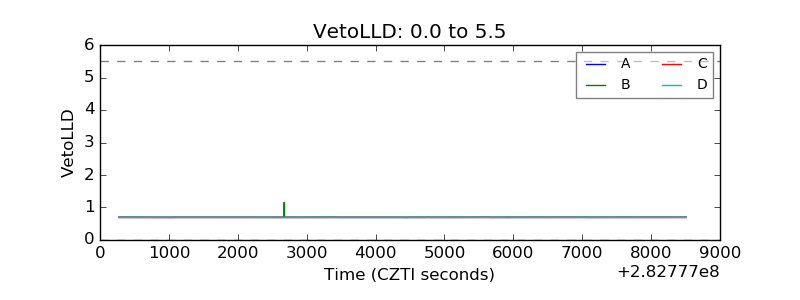 |
| Alpha Counter | 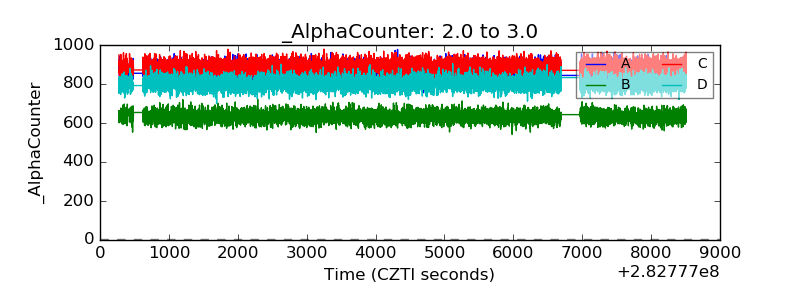 |
| _CPM_Rate | 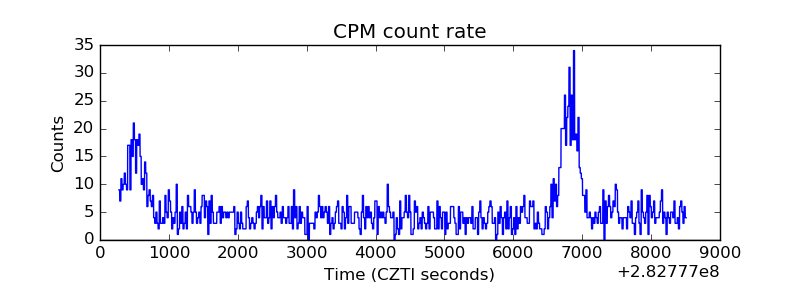 |
| CZT Counter | 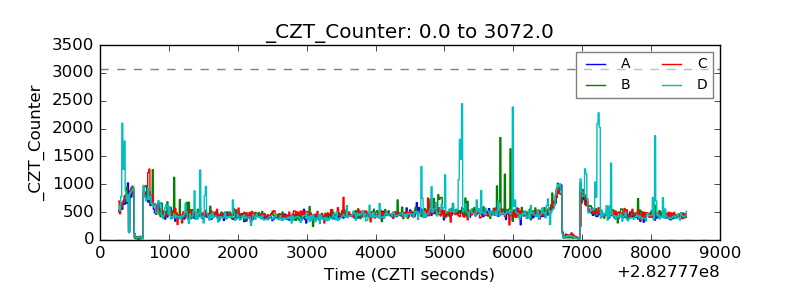 |
| +2.5 Volts monitor |  |
| +5 Volts monitor |  |
| _ROLL_ROT | 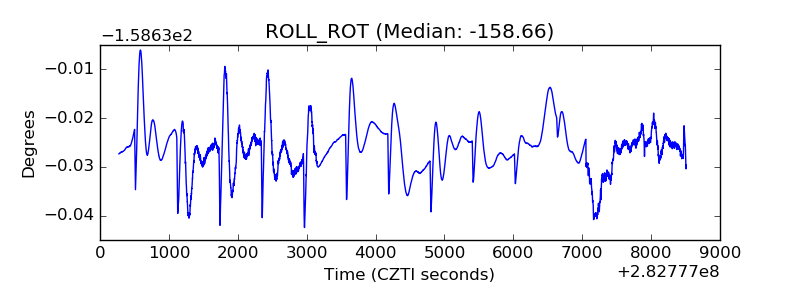 |
| _Roll_DEC | 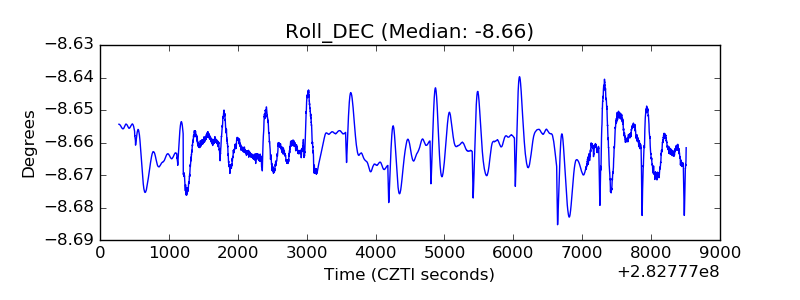 |
| _Roll_RA | 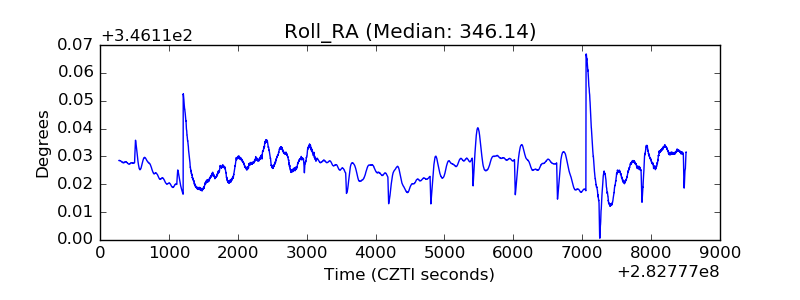 |
| Veto Counter | 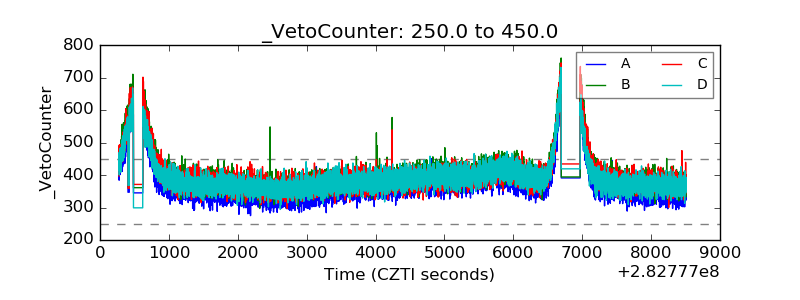 |