| Param | Original file | Final file |
|---|---|---|
| Filename | modeM0/AS1A05_198T01_9000002578_17424cztM0_level2.evt | modeM0/AS1A05_198T01_9000002578_17424cztM0_level2_quad_clean.evt |
| Size (bytes) | 491,736,960 | 85,936,320 |
| Size | 469.0 MB | 82.0 MB |
| Events in quadrant A | 3,268,058 | 549,501 |
| Events in quadrant B | 3,662,265 | 557,202 |
| Events in quadrant C | 3,301,914 | 529,453 |
| Events in quadrant D | 4,218,732 | 512,729 |
| Mode M9 | |||
|---|---|---|---|
| Quadrant | BADHDUFLAG | Total packets | Discarded packets |
| A | 0 | 19 | 0 |
| B | 0 | 20 | 0 |
| C | 0 | 20 | 0 |
| D | 0 | 20 | 0 |
| Mode M0 | |||
|---|---|---|---|
| Quadrant | BADHDUFLAG | Total packets | Discarded packets |
| A | 0 | 13881 | 2 |
| B | 0 | 14971 | 2 |
| C | 0 | 13947 | 2 |
| D | 0 | 16725 | 2 |
| Mode SS | |||
|---|---|---|---|
| Quadrant | BADHDUFLAG | Total packets | Discarded packets |
| A | 0 | 132 | 0 |
| B | 0 | 132 | 0 |
| C | 0 | 132 | 0 |
| D | 0 | 132 | 0 |
| Quadrant | Total seconds | Saturated seconds | Saturation percentage |
|---|---|---|---|
| A | 6500 | 86 | 1.323077% |
| B | 6500 | 120 | 1.846154% |
| C | 6500 | 137 | 2.107692% |
| D | 6500 | 229 | 3.523077% |
Noise dominated data is calculated using 1-second bins in cleaned event files. If a bin has >2000 counts, and if more than 50% of those come from <1% of pixels, then it is considered to be noise-dominated and hence unusable.
| Quadrant | # 1 sec bins | Bins with >0 counts | Bins with >2000 counts | High rate bins dominated by noise | Noise dominated (total time) | Noise dominated (detector-on time) | Marked lightcurve |
|---|---|---|---|---|---|---|---|
| A | 7615 | 6500 | 0 | 0 | 0.00% | 0.00% | 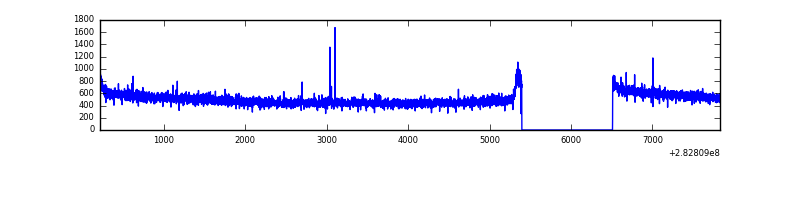 |
| B | 7615 | 6500 | 14 | 14 | 0.18% | 0.22% | 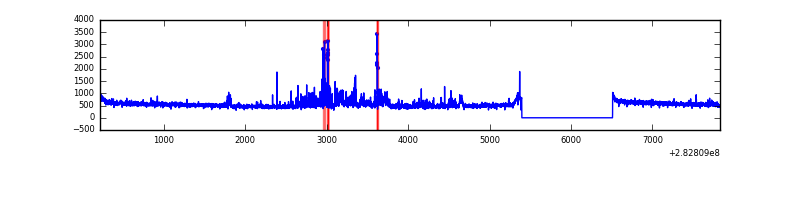 |
| C | 7615 | 6500 | 0 | 0 | 0.00% | 0.00% | 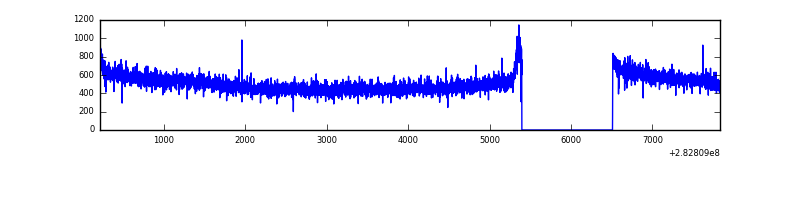 |
| D | 7615 | 6500 | 137 | 137 | 1.80% | 2.11% | 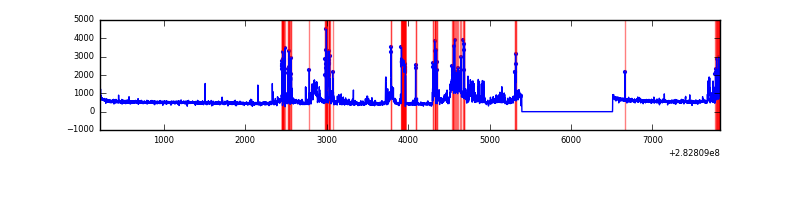 |
Top three noisy pixels from each quadrant. If the there are fewer than three noisy pixels in the level2.evt file, extra rows are filled as -1
| Pixel properties | Quadrant properties | ||||||
|---|---|---|---|---|---|---|---|
| Quadrant | DetID | PixID | Counts | Sigma | Mean | Median | Sigma |
| A | 4 | 2 | 8627 | 45.67 | 848 | 832 | 170.7 |
| A | 0 | 226 | 7373 | 38.32 | 848 | 832 | 170.7 |
| A | 12 | 194 | 6262 | 31.81 | 848 | 832 | 170.7 |
| B | 7 | 220 | 122575 | 762.93 | 842 | 822 | 159.6 |
| B | 4 | 48 | 117909 | 733.7 | 842 | 822 | 159.6 |
| B | 0 | 230 | 32053 | 195.7 | 842 | 822 | 159.6 |
| C | 14 | 238 | 125947 | 669.2 | 799 | 806 | 187.0 |
| C | 5 | 218 | 38003 | 198.91 | 799 | 806 | 187.0 |
| C | 5 | 219 | 13586 | 68.34 | 799 | 806 | 187.0 |
| D | 11 | 176 | 403174 | 2045.9 | 808 | 785 | 196.7 |
| D | 13 | 232 | 190980 | 967.03 | 808 | 785 | 196.7 |
| D | 7 | 238 | 189398 | 958.98 | 808 | 785 | 196.7 |
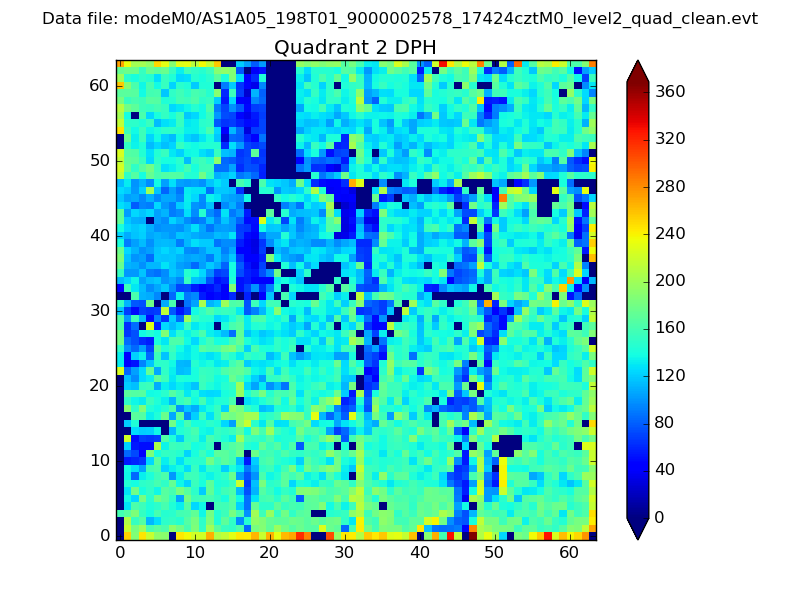
Histogram calculated using DETX and DETY for each event in the final _common_clean file
| Quadrant A | 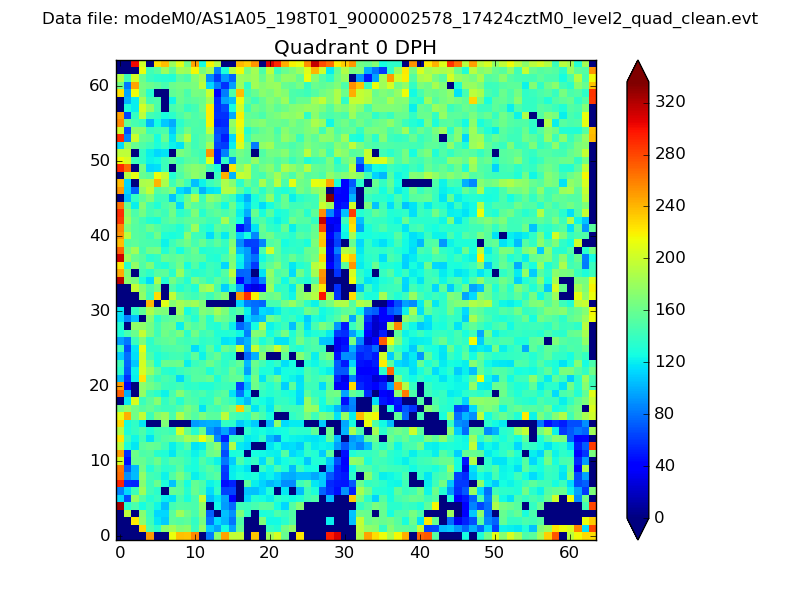 |
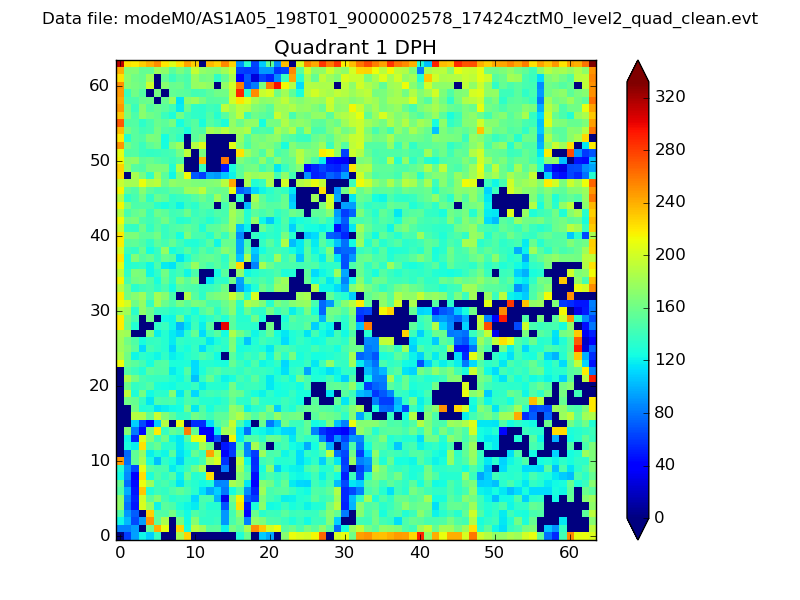 |
Quadrant B |
|---|---|---|---|
| Quadrant D | 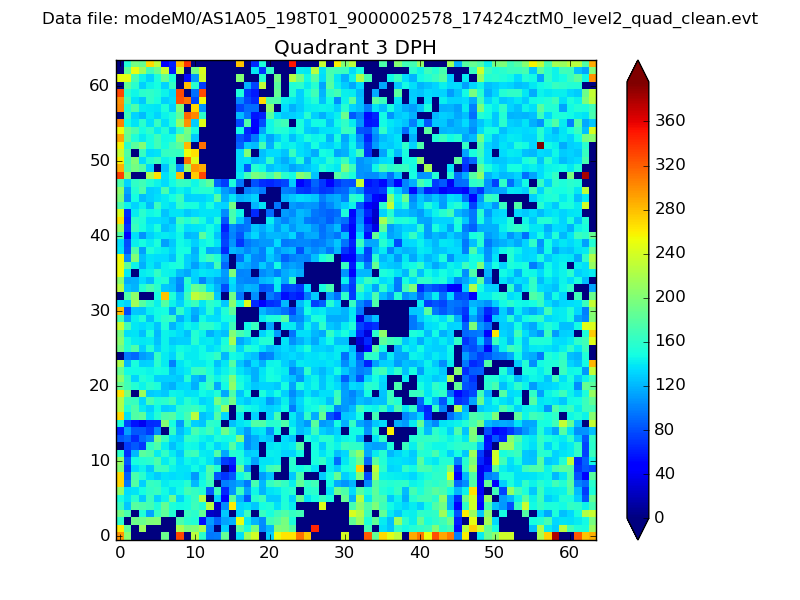 |
 |
Quadrant C |
| Plot type | Count rate plots | Images |
|---|---|---|
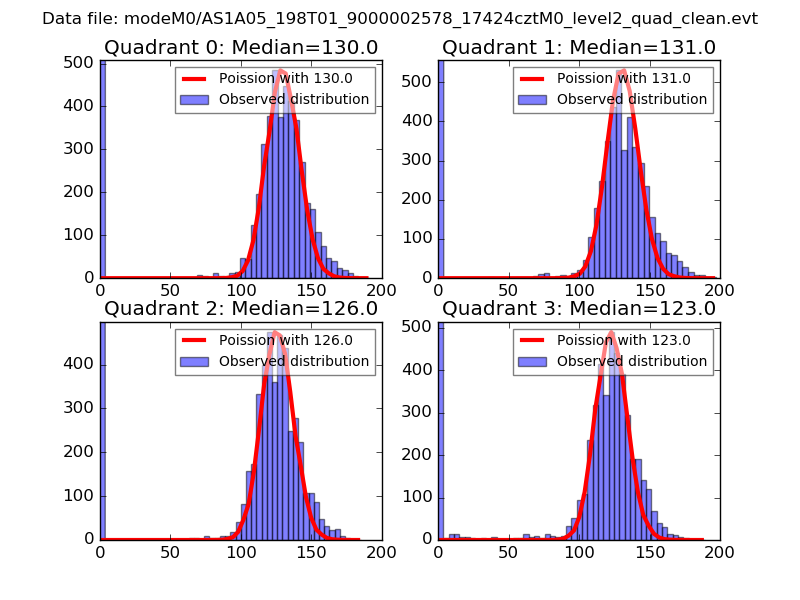
| Comparison with Poisson distribution Blue bars denote a histogram of data divided into 1 sec bins. Red curve is a Poisson curve with rate = median count rate of data. |
 |
 |
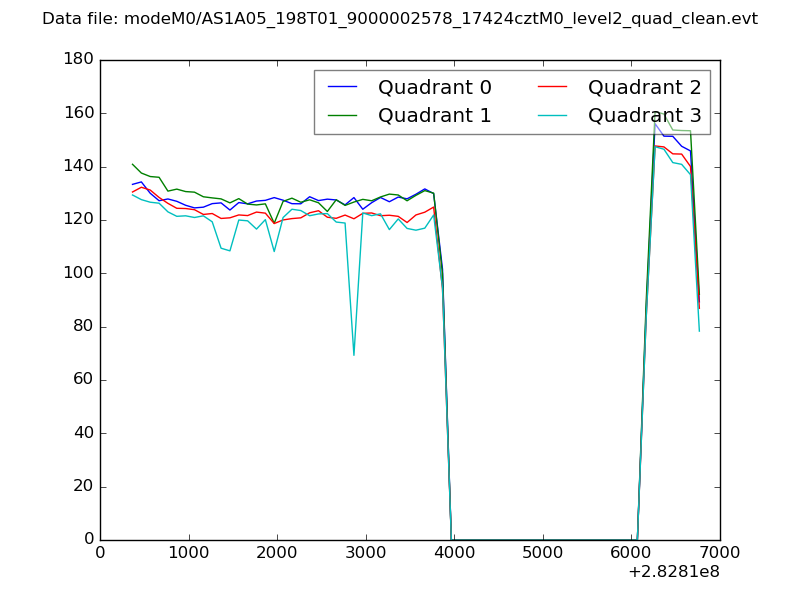
| Quadrant-wise count rates Data is divided into 100 sec bins |
 |
|
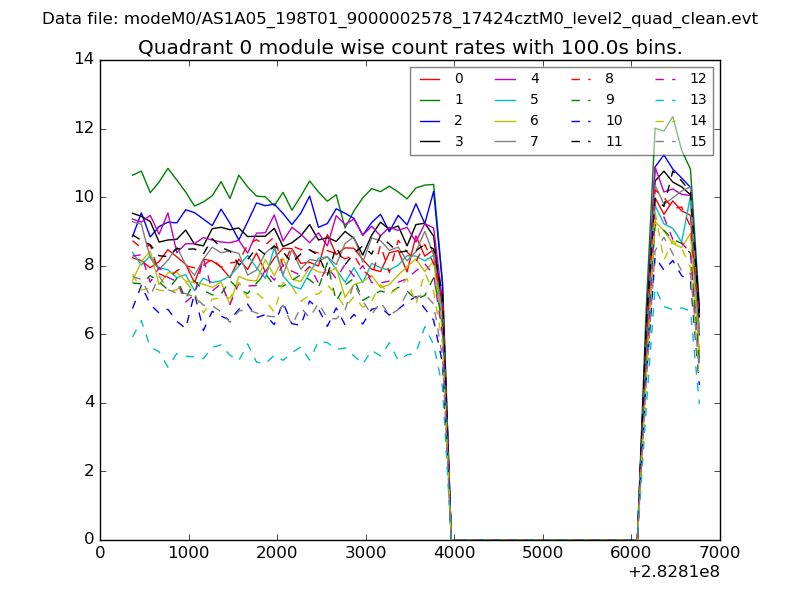
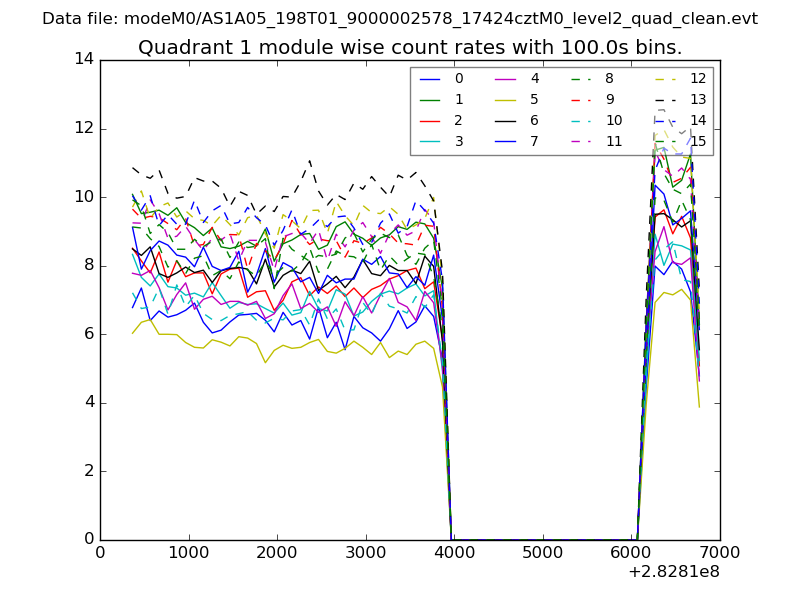
| Module-wise count rates for Quadrant A Data is divided into 100 sec bins |
 |
 |
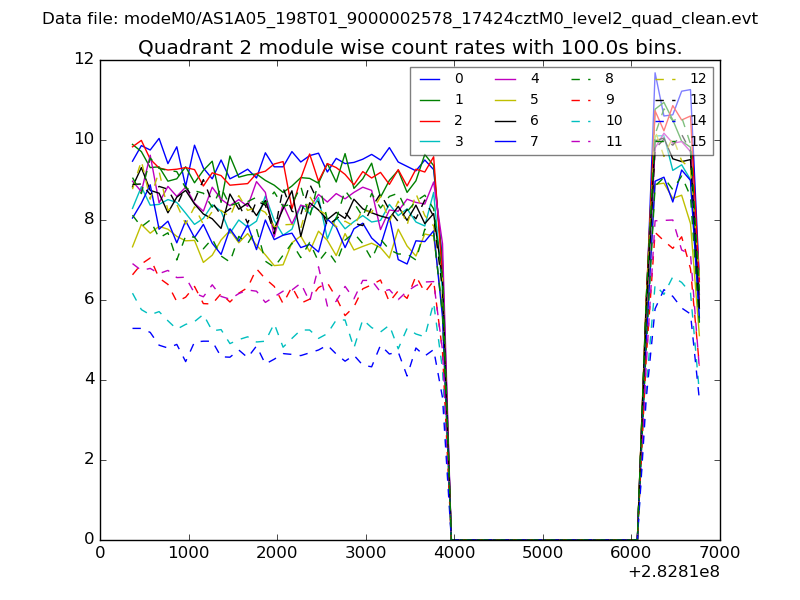
| Module-wise count rates for Quadrant B Data is divided into 100 sec bins |
 |
 |
| Module-wise count rates for Quadrant C Data is divided into 100 sec bins |
 |
 |
| Module-wise count rates for Quadrant D Data is divided into 100 sec bins |
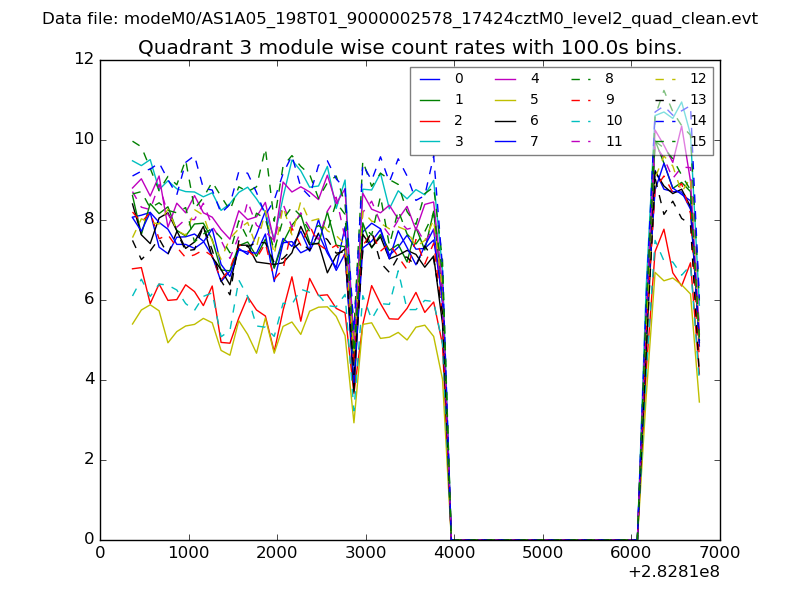 |
 |
| Parameter | Plot |
|---|---|
| CZT HV Monitor | 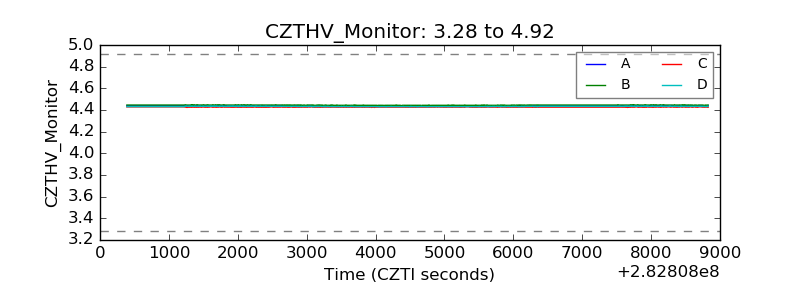 |
| D_VDD | 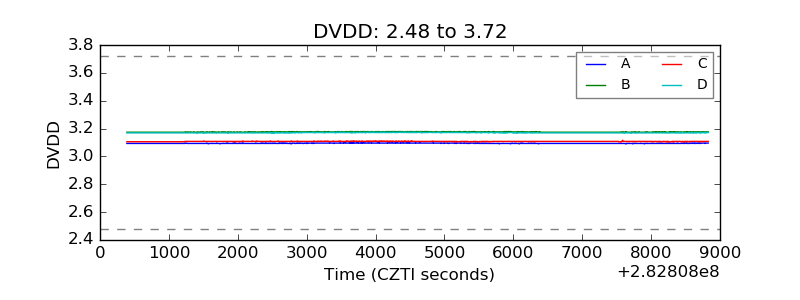 |
| Temperature 1 | 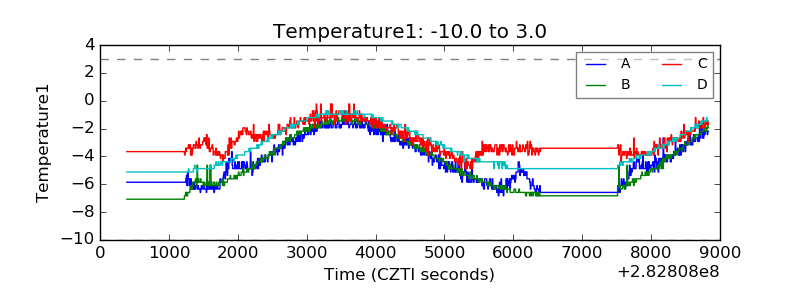 |
| Veto HV Monitor | 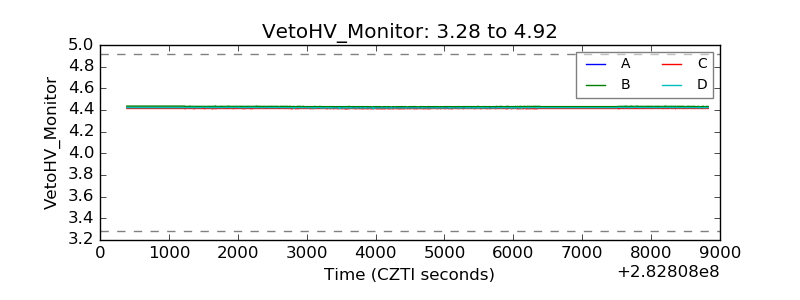 |
| Veto LLD | 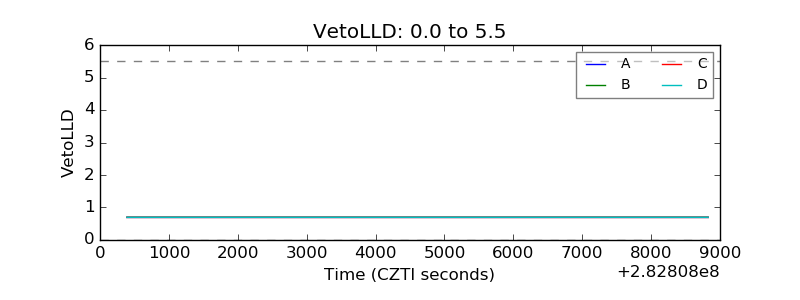 |
| Alpha Counter | 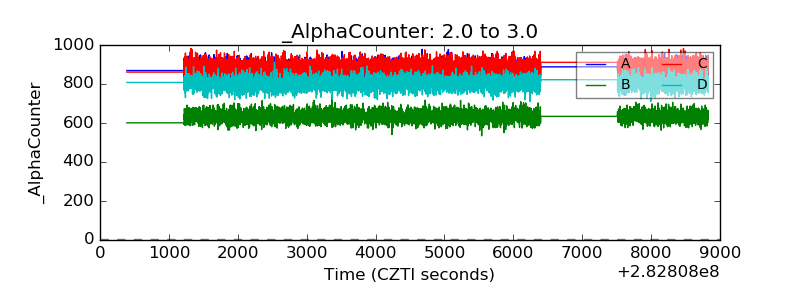 |
| _CPM_Rate | 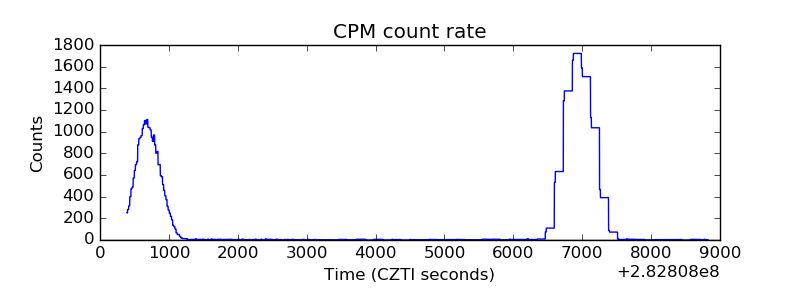 |
| CZT Counter | 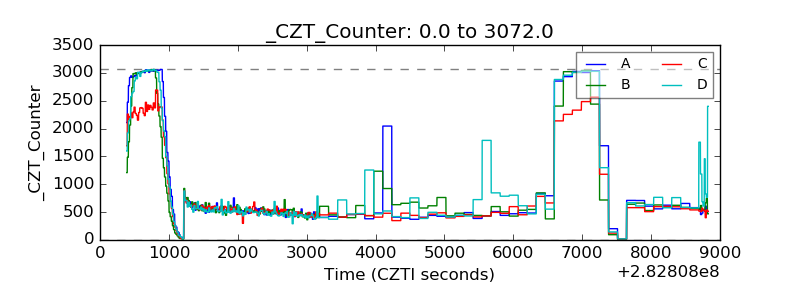 |
| +2.5 Volts monitor |  |
| +5 Volts monitor |  |
| _ROLL_ROT | 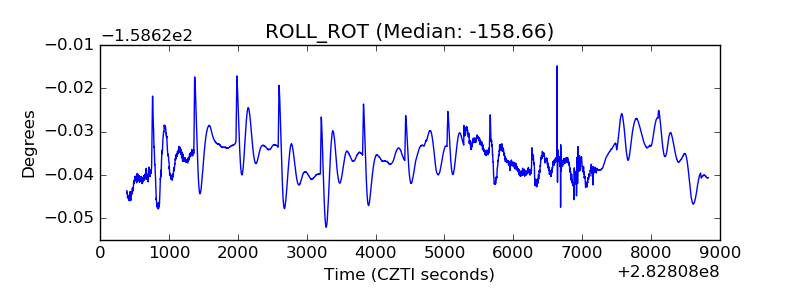 |
| _Roll_DEC | 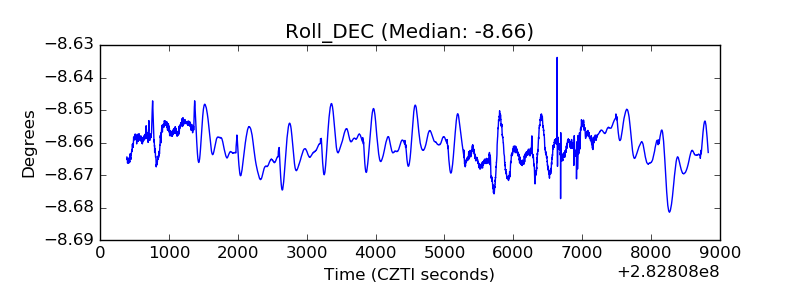 |
| _Roll_RA | 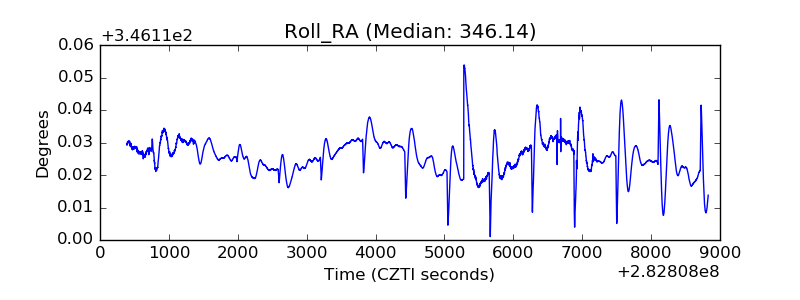 |
| Veto Counter | 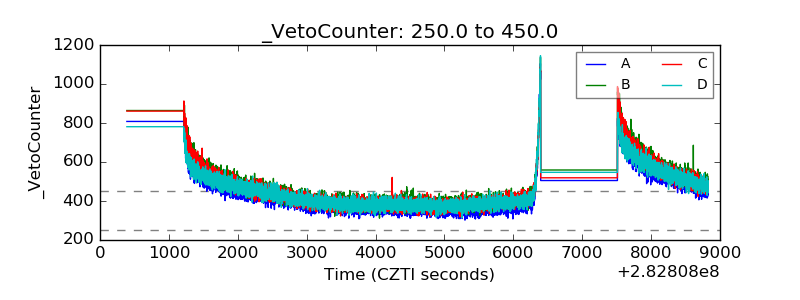 |