| Param | Original file | Final file |
|---|---|---|
| Filename | modeM0/AS1A05_198T01_9000002578_17428cztM0_level2.evt | modeM0/AS1A05_198T01_9000002578_17428cztM0_level2_quad_clean.evt |
| Size (bytes) | 491,754,240 | 100,912,320 |
| Size | 469.0 MB | 96.2 MB |
| Events in quadrant A | 3,286,563 | 676,977 |
| Events in quadrant B | 3,771,836 | 675,565 |
| Events in quadrant C | 3,292,670 | 637,460 |
| Events in quadrant D | 4,106,469 | 618,611 |
| Mode M9 | |||
|---|---|---|---|
| Quadrant | BADHDUFLAG | Total packets | Discarded packets |
| A | 0 | 14 | 0 |
| B | 0 | 14 | 0 |
| C | 0 | 14 | 0 |
| D | 0 | 14 | 0 |
| Mode M0 | |||
|---|---|---|---|
| Quadrant | BADHDUFLAG | Total packets | Discarded packets |
| A | 0 | 13832 | 2 |
| B | 0 | 15408 | 2 |
| C | 0 | 13700 | 3 |
| D | 0 | 16445 | 2 |
| Mode SS | |||
|---|---|---|---|
| Quadrant | BADHDUFLAG | Total packets | Discarded packets |
| A | 0 | 130 | 0 |
| B | 0 | 130 | 0 |
| C | 0 | 130 | 0 |
| D | 0 | 130 | 0 |
| Quadrant | Total seconds | Saturated seconds | Saturation percentage |
|---|---|---|---|
| A | 6421 | 85 | 1.323781% |
| B | 6422 | 146 | 2.273435% |
| C | 6421 | 108 | 1.681981% |
| D | 6421 | 216 | 3.363962% |
Noise dominated data is calculated using 1-second bins in cleaned event files. If a bin has >2000 counts, and if more than 50% of those come from <1% of pixels, then it is considered to be noise-dominated and hence unusable.
| Quadrant | # 1 sec bins | Bins with >0 counts | Bins with >2000 counts | High rate bins dominated by noise | Noise dominated (total time) | Noise dominated (detector-on time) | Marked lightcurve |
|---|---|---|---|---|---|---|---|
| A | 7726 | 6423 | 1 | 1 | 0.01% | 0.02% | 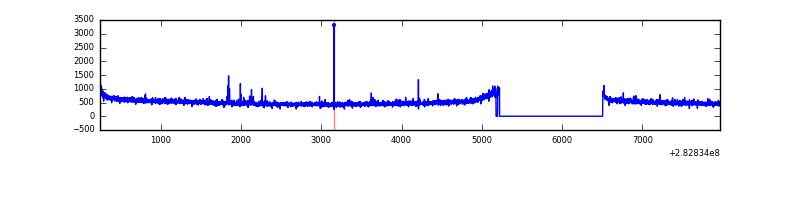 |
| B | 7727 | 6424 | 38 | 38 | 0.49% | 0.59% | 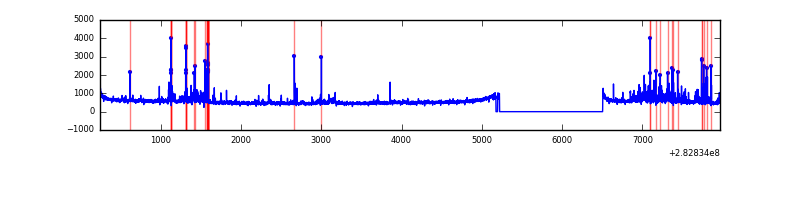 |
| C | 7726 | 6423 | 1 | 1 | 0.01% | 0.02% | 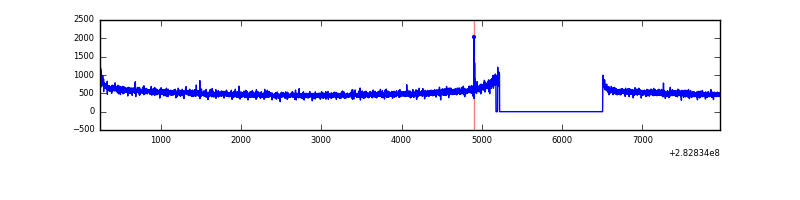 |
| D | 7726 | 6423 | 135 | 135 | 1.75% | 2.10% | 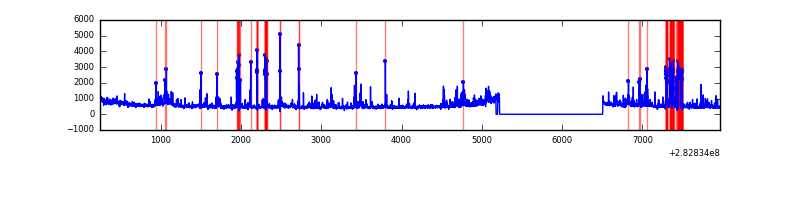 |
Top three noisy pixels from each quadrant. If the there are fewer than three noisy pixels in the level2.evt file, extra rows are filled as -1
| Pixel properties | Quadrant properties | ||||||
|---|---|---|---|---|---|---|---|
| Quadrant | DetID | PixID | Counts | Sigma | Mean | Median | Sigma |
| A | 4 | 2 | 19107 | 107.41 | 847 | 834 | 170.1 |
| A | 0 | 226 | 7800 | 40.95 | 847 | 834 | 170.1 |
| A | 12 | 194 | 6357 | 32.46 | 847 | 834 | 170.1 |
| B | 7 | 220 | 260851 | 1634.81 | 840 | 824 | 159.1 |
| B | 0 | 219 | 70878 | 440.44 | 840 | 824 | 159.1 |
| B | 4 | 216 | 60593 | 375.77 | 840 | 824 | 159.1 |
| C | 14 | 238 | 123977 | 674.32 | 791 | 798 | 182.7 |
| C | 5 | 218 | 37275 | 199.69 | 791 | 798 | 182.7 |
| C | 3 | 233 | 32190 | 171.85 | 791 | 798 | 182.7 |
| D | 15 | 0 | 399192 | 2050.88 | 800 | 778 | 194.3 |
| D | 13 | 232 | 229170 | 1175.67 | 800 | 778 | 194.3 |
| D | 13 | 189 | 145303 | 743.96 | 800 | 778 | 194.3 |
Histogram calculated using DETX and DETY for each event in the final _common_clean file
| Quadrant A | 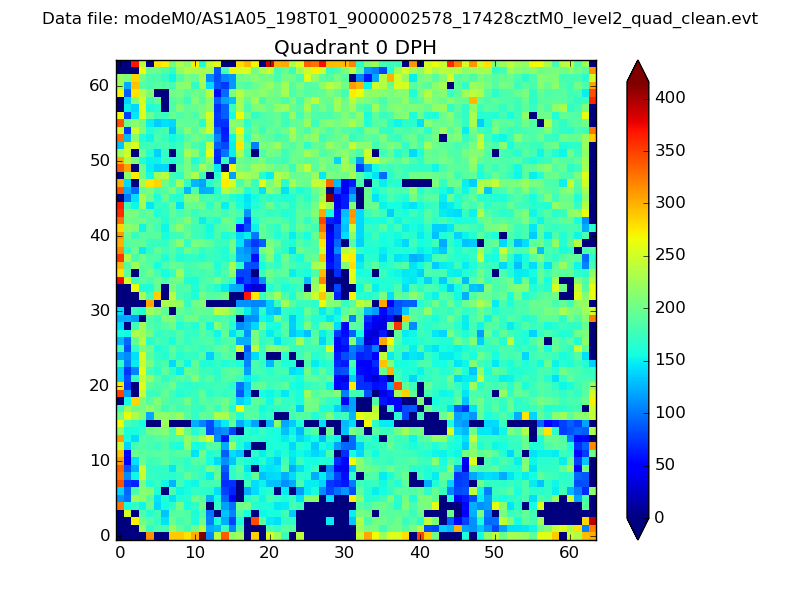 |
 |
Quadrant B |
|---|---|---|---|
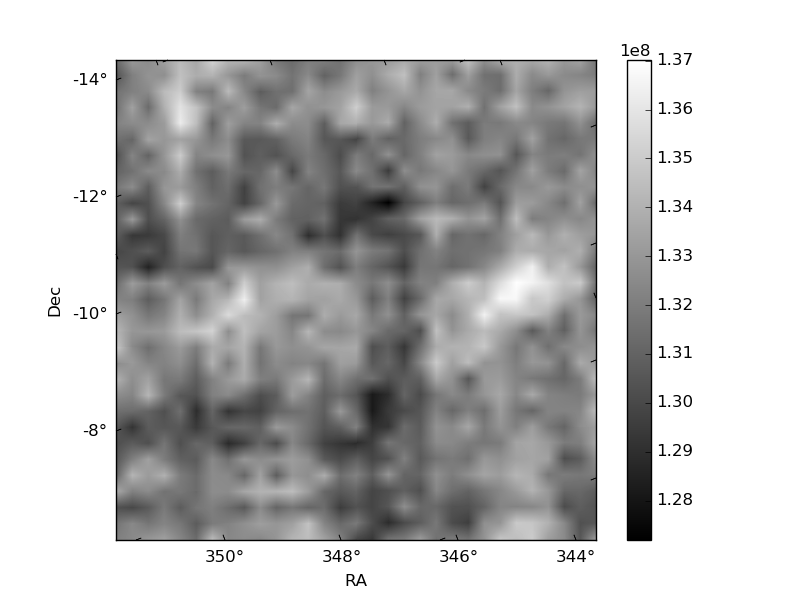
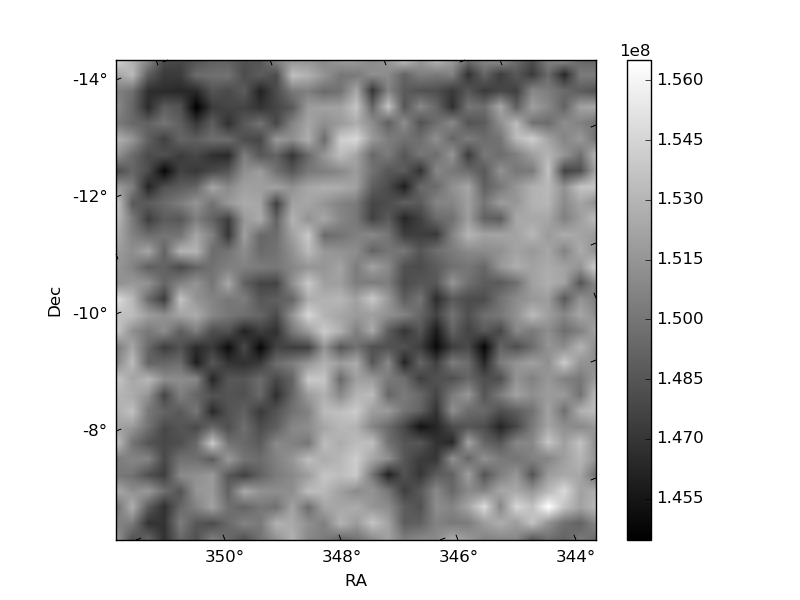
| Quadrant D | 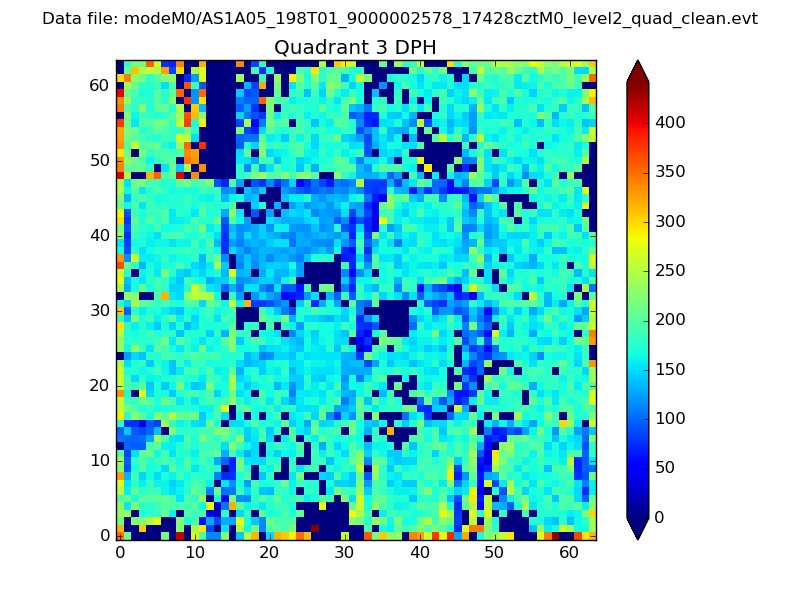 |
 |
Quadrant C |
| Plot type | Count rate plots | Images |
|---|---|---|
| Comparison with Poisson distribution Blue bars denote a histogram of data divided into 1 sec bins. Red curve is a Poisson curve with rate = median count rate of data. |
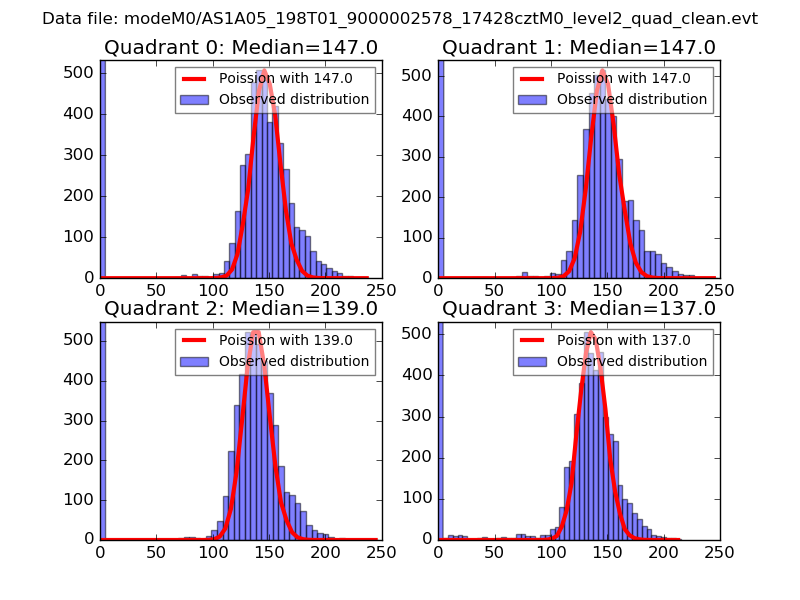 |
 |
| Quadrant-wise count rates Data is divided into 100 sec bins |
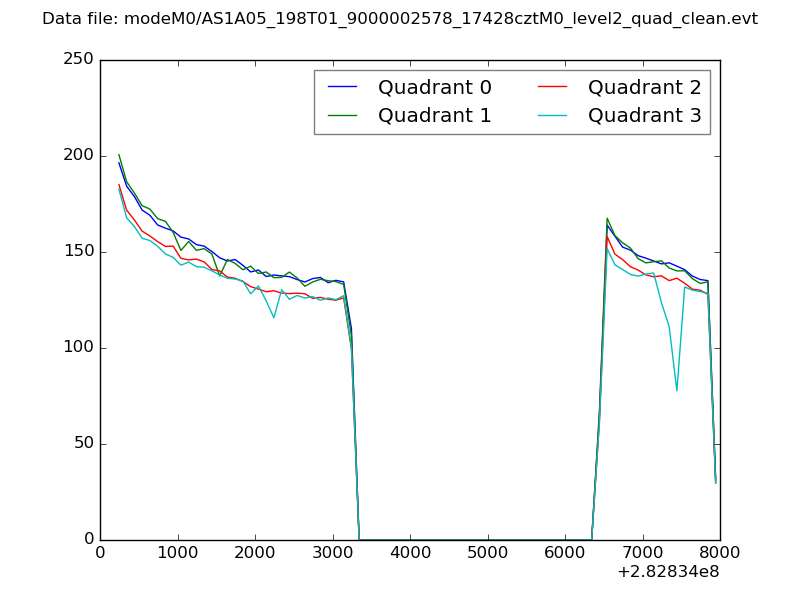 |
|
| Module-wise count rates for Quadrant A Data is divided into 100 sec bins |
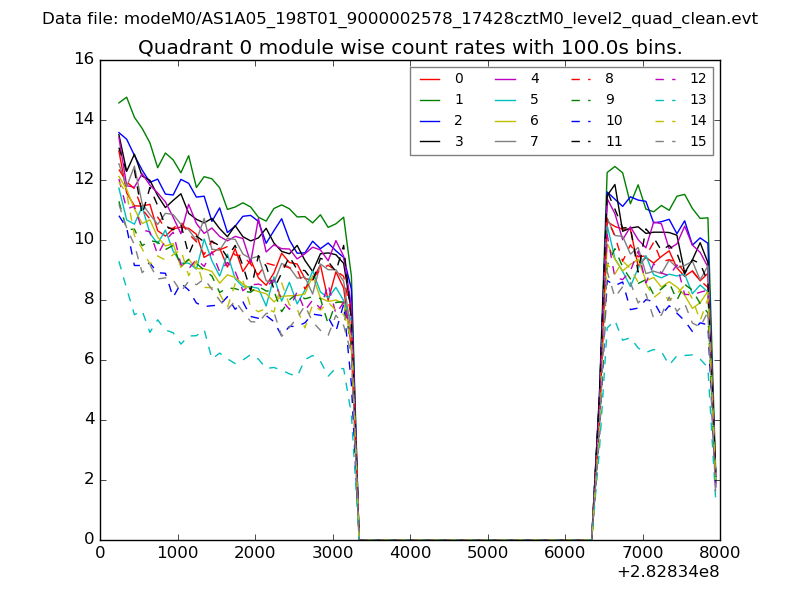 |
 |
| Module-wise count rates for Quadrant B Data is divided into 100 sec bins |
 |
 |
| Module-wise count rates for Quadrant C Data is divided into 100 sec bins |
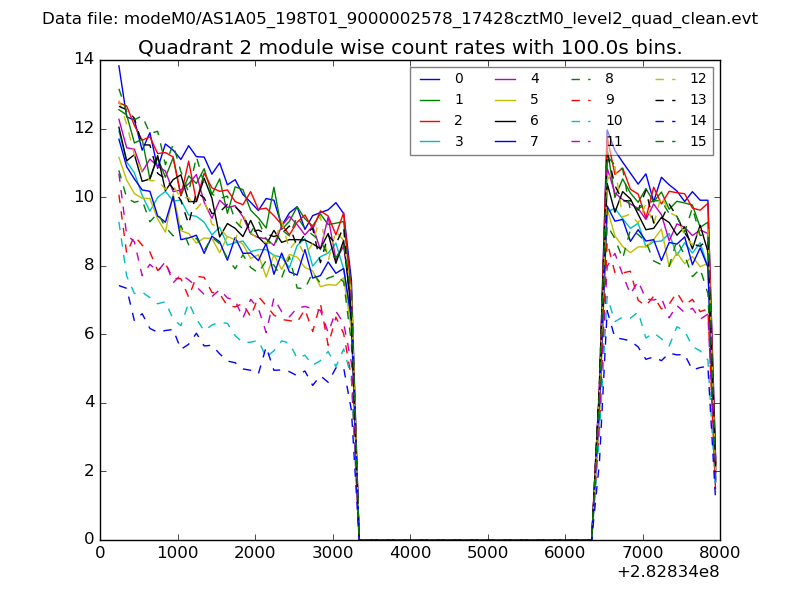 |
 |
| Module-wise count rates for Quadrant D Data is divided into 100 sec bins |
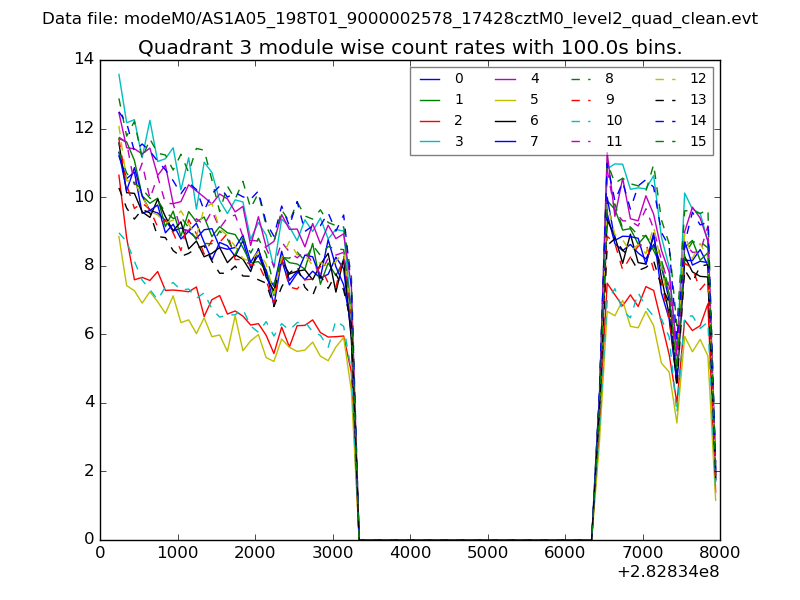 |
 |
| Parameter | Plot |
|---|---|
| CZT HV Monitor |  |
| D_VDD | 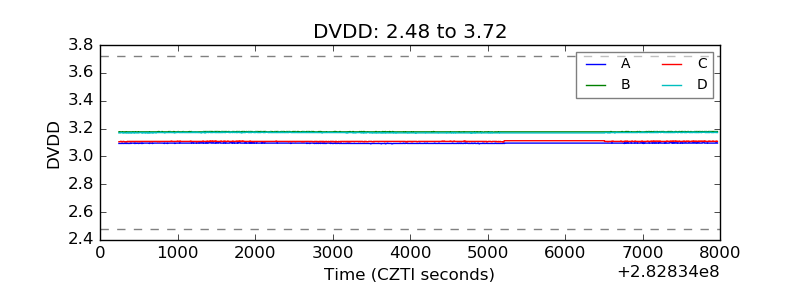 |
| Temperature 1 | 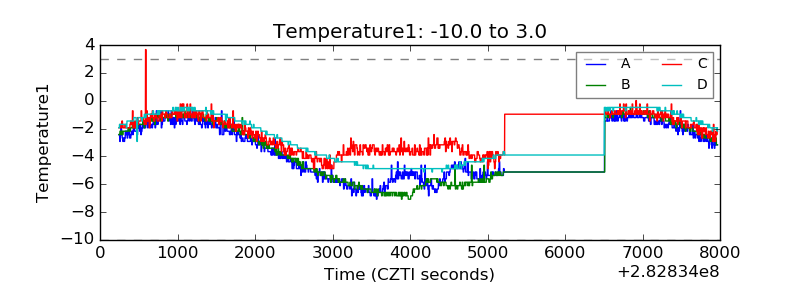 |
| Veto HV Monitor | 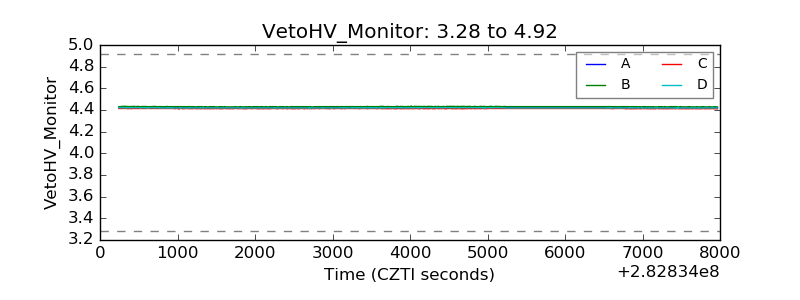 |
| Veto LLD | 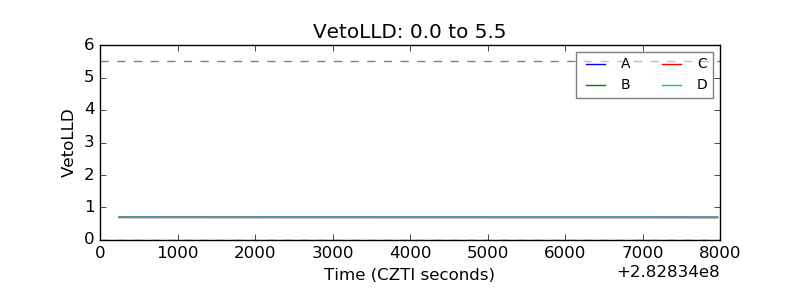 |
| Alpha Counter | 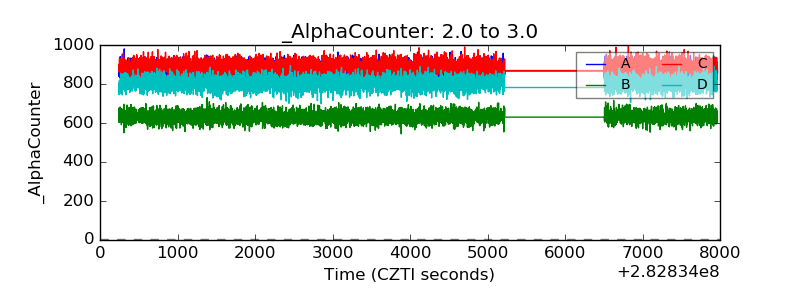 |
| _CPM_Rate | 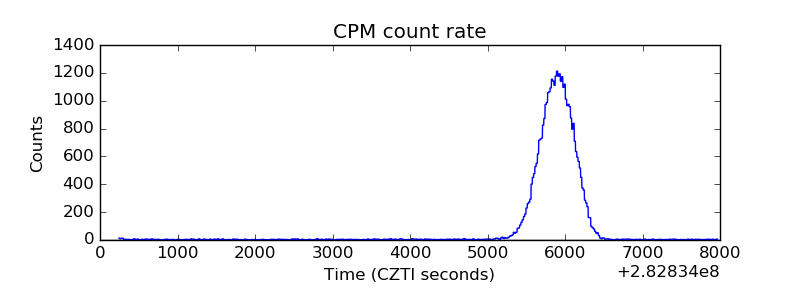 |
| CZT Counter | 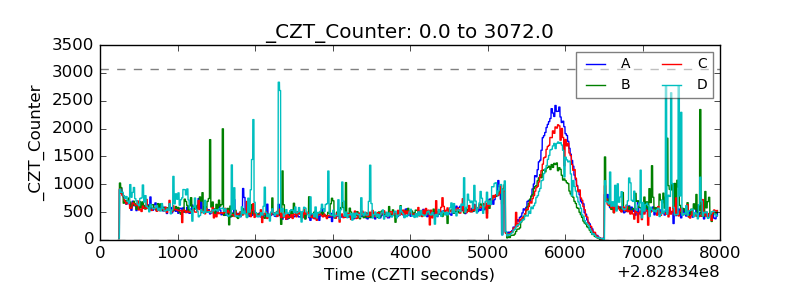 |
| +2.5 Volts monitor |  |
| +5 Volts monitor | 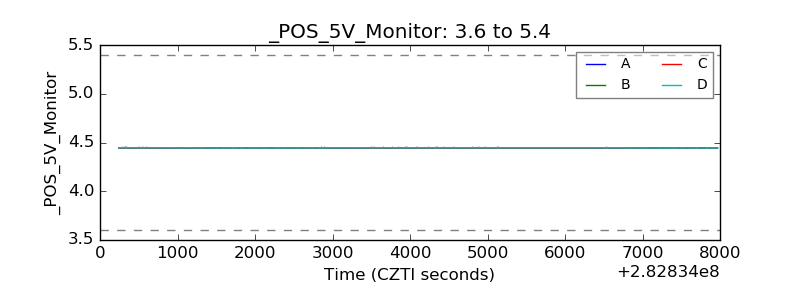 |
| _ROLL_ROT | 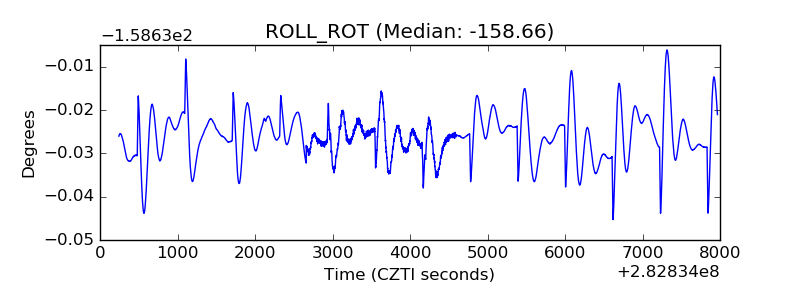 |
| _Roll_DEC | 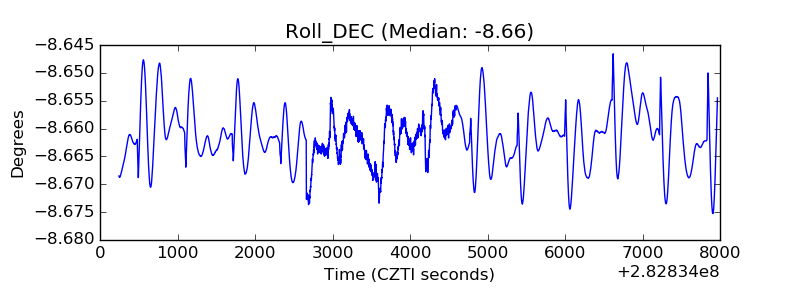 |
| _Roll_RA | 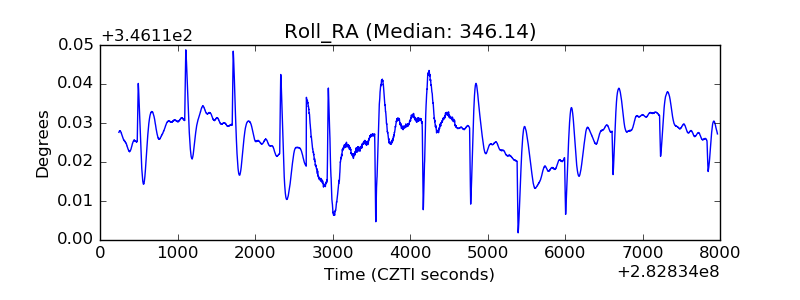 |
| Veto Counter | 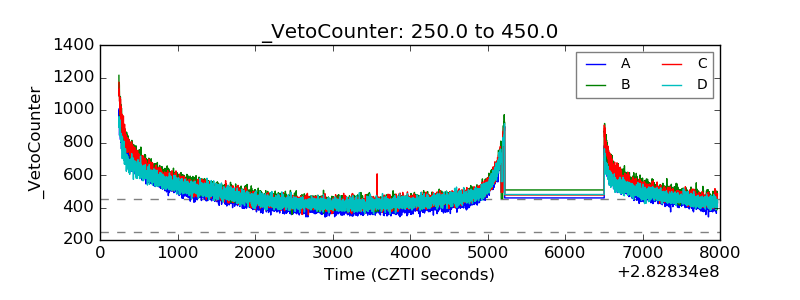 |