| Param | Original file | Final file |
|---|---|---|
| Filename | modeM0/AS1A05_198T01_9000002578_17429cztM0_level2.evt | modeM0/AS1A05_198T01_9000002578_17429cztM0_level2_quad_clean.evt |
| Size (bytes) | 497,321,280 | 90,763,200 |
| Size | 474.3 MB | 86.6 MB |
| Events in quadrant A | 3,237,936 | 592,706 |
| Events in quadrant B | 3,768,029 | 593,405 |
| Events in quadrant C | 3,312,245 | 564,676 |
| Events in quadrant D | 4,298,435 | 540,739 |
| Mode M9 | |||
|---|---|---|---|
| Quadrant | BADHDUFLAG | Total packets | Discarded packets |
| A | 0 | 14 | 0 |
| B | 0 | 15 | 0 |
| C | 0 | 15 | 0 |
| D | 0 | 15 | 0 |
| Mode M0 | |||
|---|---|---|---|
| Quadrant | BADHDUFLAG | Total packets | Discarded packets |
| A | 0 | 13899 | 2 |
| B | 0 | 15446 | 2 |
| C | 0 | 13916 | 2 |
| D | 0 | 17101 | 2 |
| Mode SS | |||
|---|---|---|---|
| Quadrant | BADHDUFLAG | Total packets | Discarded packets |
| A | 0 | 132 | 0 |
| B | 0 | 132 | 0 |
| C | 0 | 132 | 0 |
| D | 0 | 132 | 0 |
| Quadrant | Total seconds | Saturated seconds | Saturation percentage |
|---|---|---|---|
| A | 6554 | 81 | 1.235886% |
| B | 6554 | 159 | 2.425999% |
| C | 6554 | 116 | 1.769912% |
| D | 6554 | 339 | 5.172414% |
Noise dominated data is calculated using 1-second bins in cleaned event files. If a bin has >2000 counts, and if more than 50% of those come from <1% of pixels, then it is considered to be noise-dominated and hence unusable.
| Quadrant | # 1 sec bins | Bins with >0 counts | Bins with >2000 counts | High rate bins dominated by noise | Noise dominated (total time) | Noise dominated (detector-on time) | Marked lightcurve |
|---|---|---|---|---|---|---|---|
| A | 7589 | 6555 | 0 | 0 | 0.00% | 0.00% | 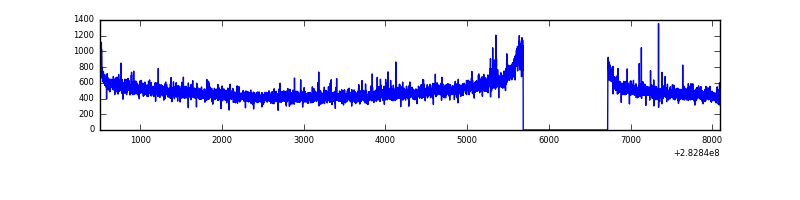 |
| B | 7589 | 6555 | 32 | 32 | 0.42% | 0.49% | 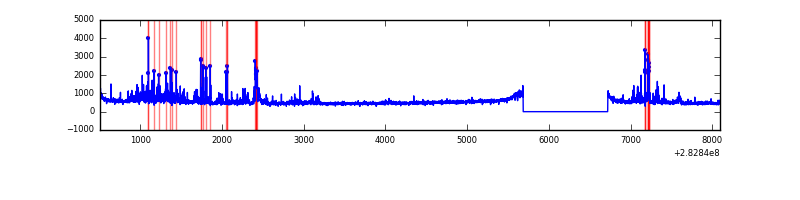 |
| C | 7589 | 6555 | 0 | 0 | 0.00% | 0.00% | 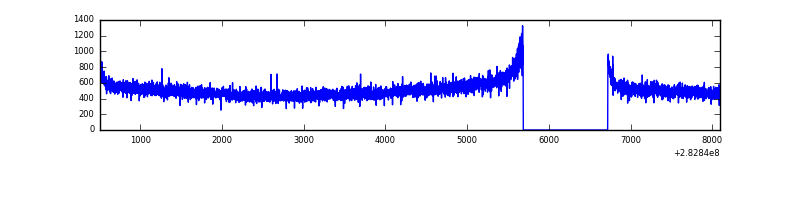 |
| D | 7589 | 6555 | 275 | 275 | 3.62% | 4.20% | 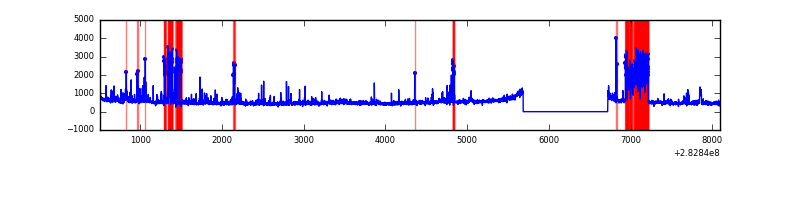 |
Top three noisy pixels from each quadrant. If the there are fewer than three noisy pixels in the level2.evt file, extra rows are filled as -1
| Pixel properties | Quadrant properties | ||||||
|---|---|---|---|---|---|---|---|
| Quadrant | DetID | PixID | Counts | Sigma | Mean | Median | Sigma |
| A | 4 | 2 | 25565 | 144.96 | 834 | 817 | 170.7 |
| A | 0 | 226 | 7450 | 38.85 | 834 | 817 | 170.7 |
| A | 12 | 194 | 6229 | 31.7 | 834 | 817 | 170.7 |
| B | 7 | 220 | 261446 | 1634.22 | 831 | 811 | 159.5 |
| B | 4 | 216 | 88430 | 549.38 | 831 | 811 | 159.5 |
| B | 15 | 19 | 73897 | 458.26 | 831 | 811 | 159.5 |
| C | 14 | 238 | 122011 | 660.99 | 785 | 791 | 183.4 |
| C | 5 | 218 | 83533 | 451.18 | 785 | 791 | 183.4 |
| C | 5 | 219 | 23688 | 124.85 | 785 | 791 | 183.4 |
| D | 13 | 232 | 560793 | 2892.54 | 785 | 762 | 193.6 |
| D | 15 | 0 | 282656 | 1455.97 | 785 | 762 | 193.6 |
| D | 1 | 52 | 153868 | 790.79 | 785 | 762 | 193.6 |
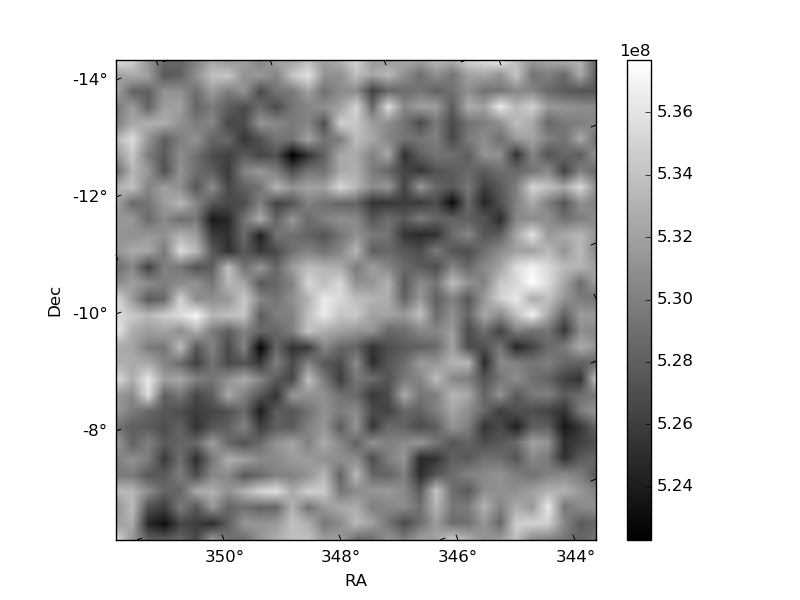
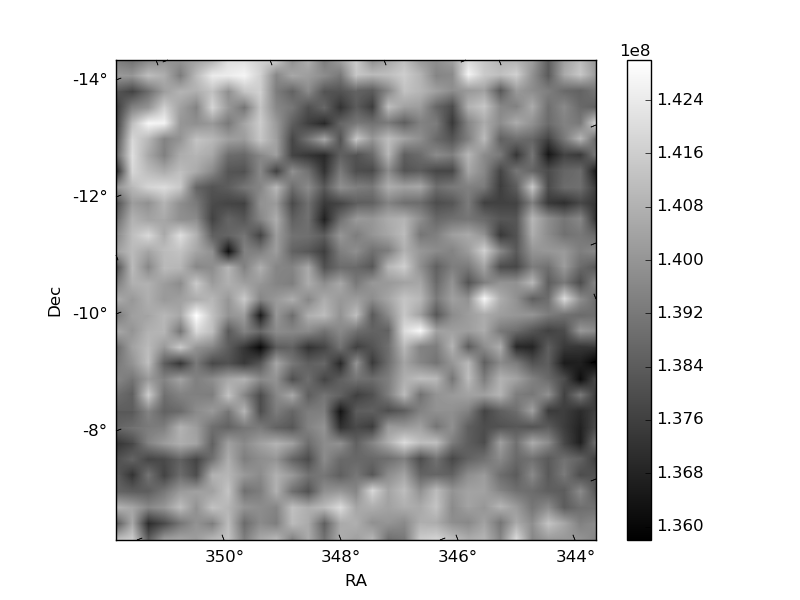
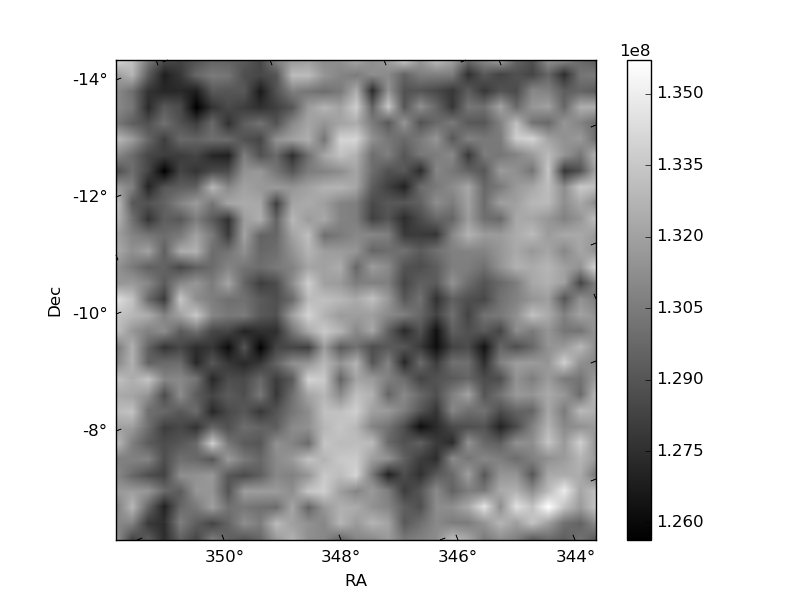
Histogram calculated using DETX and DETY for each event in the final _common_clean file
| Quadrant A | 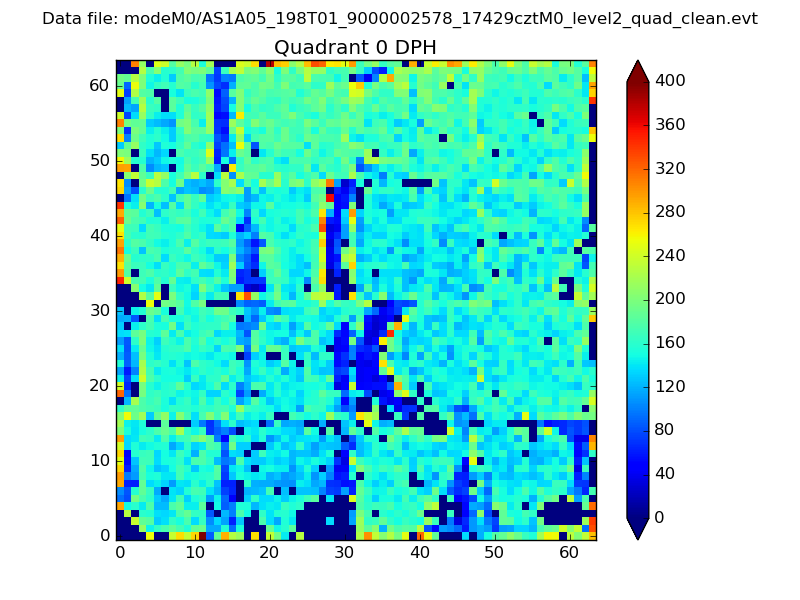 |
 |
Quadrant B |
|---|---|---|---|
| Quadrant D | 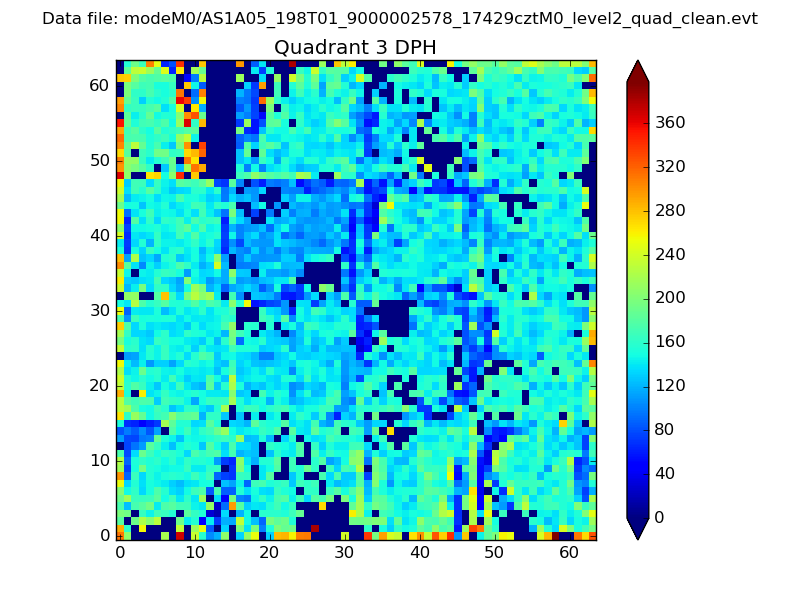 |
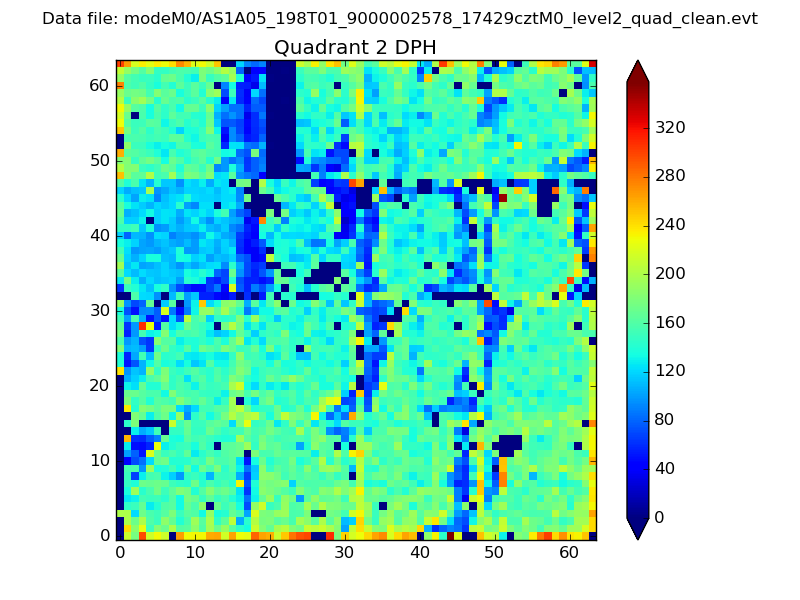 |
Quadrant C |
| Plot type | Count rate plots | Images |
|---|---|---|
| Comparison with Poisson distribution Blue bars denote a histogram of data divided into 1 sec bins. Red curve is a Poisson curve with rate = median count rate of data. |
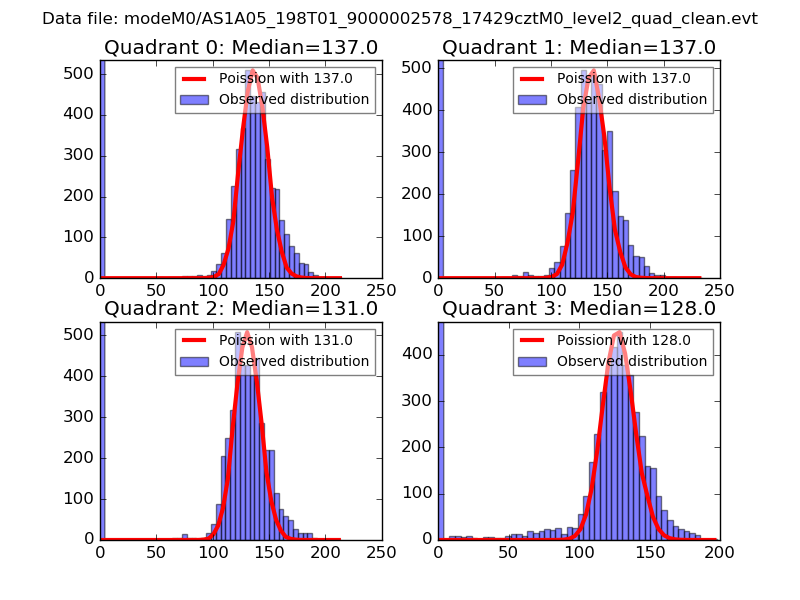 |
 |
| Quadrant-wise count rates Data is divided into 100 sec bins |
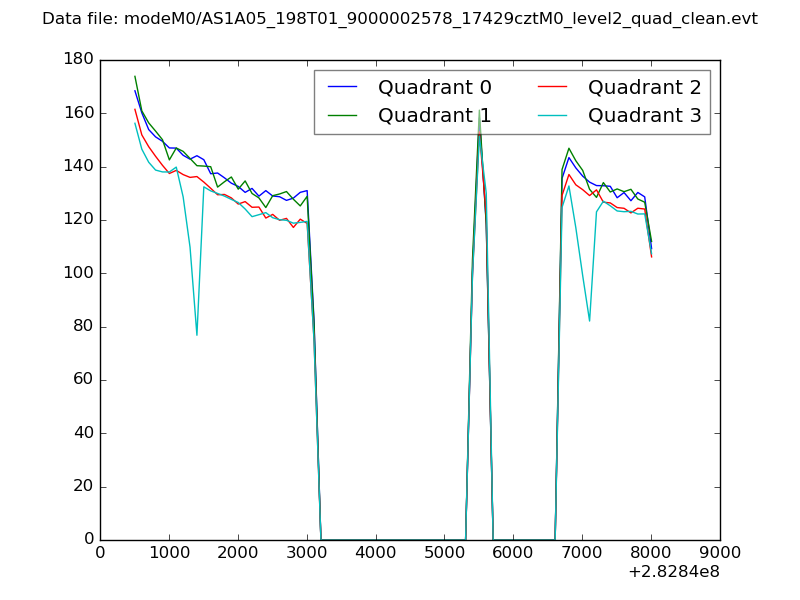 |
|
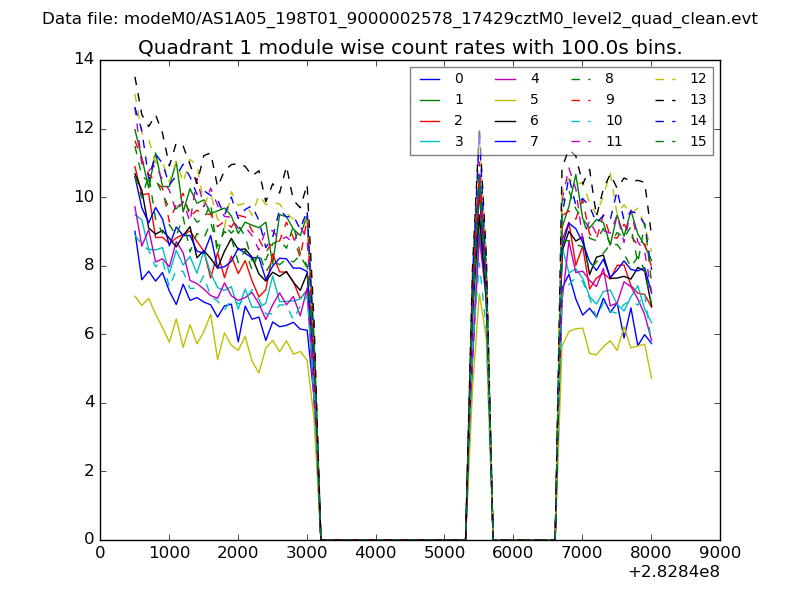
| Module-wise count rates for Quadrant A Data is divided into 100 sec bins |
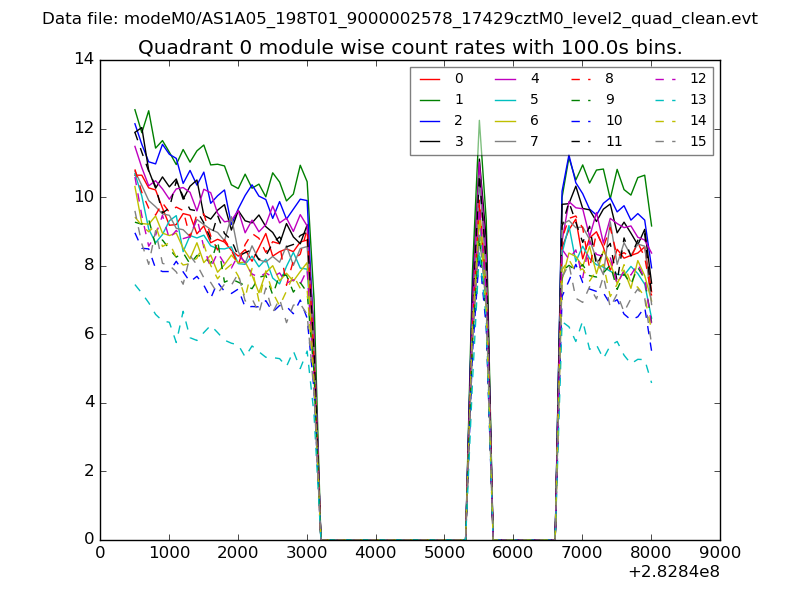 |
 |
| Module-wise count rates for Quadrant B Data is divided into 100 sec bins |
 |
 |
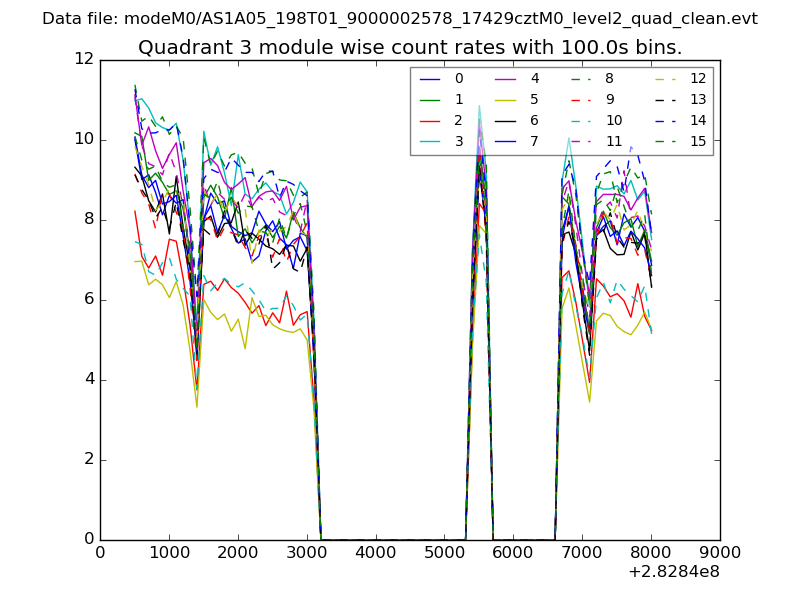
| Module-wise count rates for Quadrant C Data is divided into 100 sec bins |
 |
 |
| Module-wise count rates for Quadrant D Data is divided into 100 sec bins |
 |
 |
| Parameter | Plot |
|---|---|
| CZT HV Monitor | 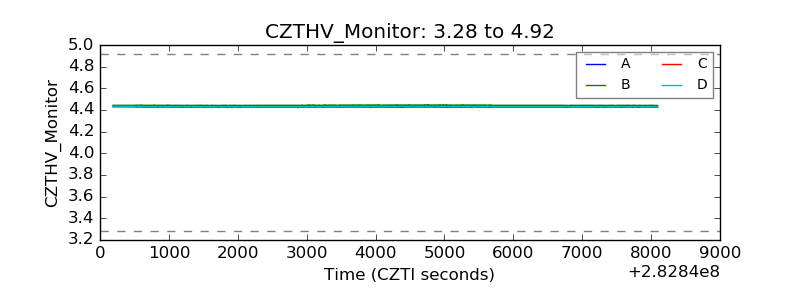 |
| D_VDD | 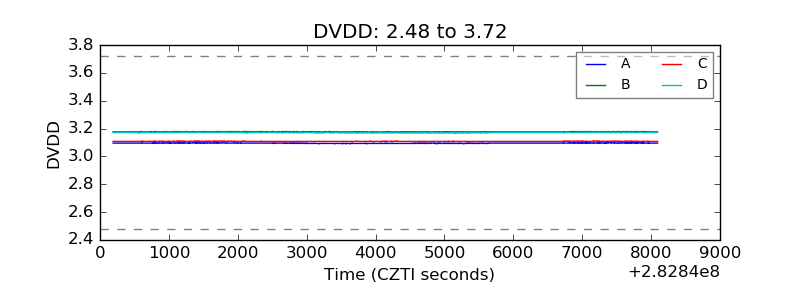 |
| Temperature 1 | 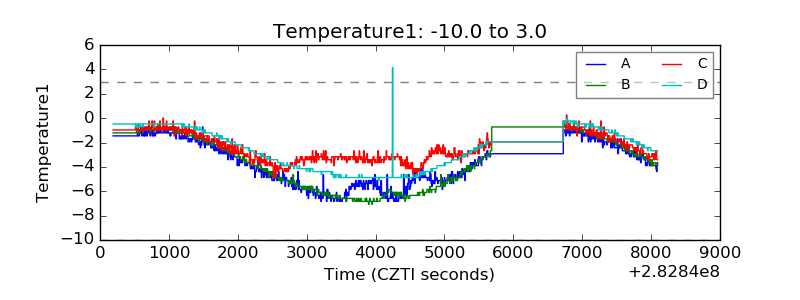 |
| Veto HV Monitor | 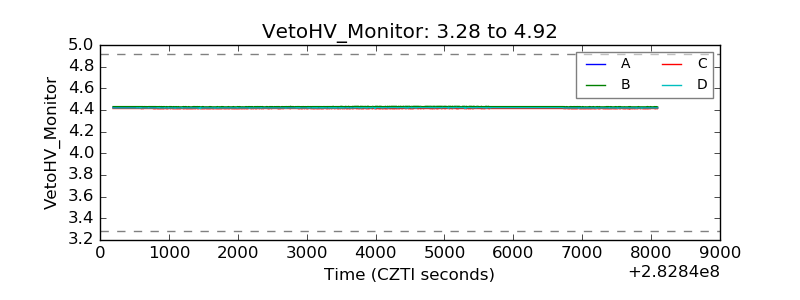 |
| Veto LLD | 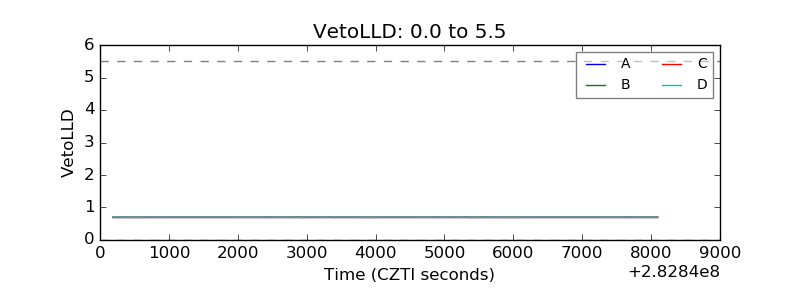 |
| Alpha Counter | 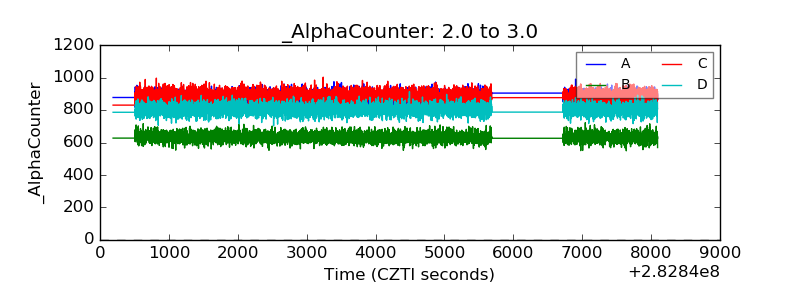 |
| _CPM_Rate | 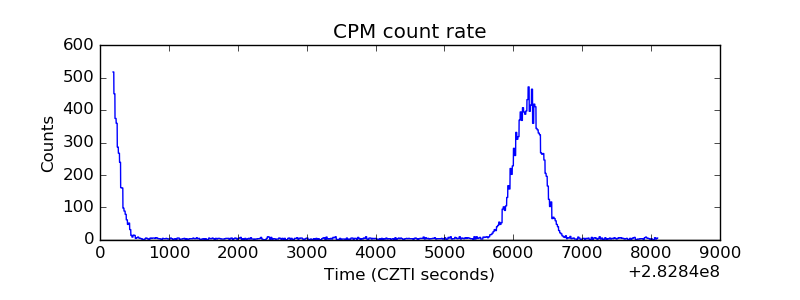 |
| CZT Counter | 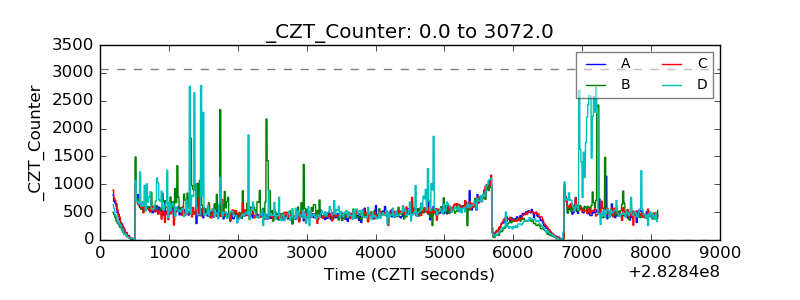 |
| +2.5 Volts monitor |  |
| +5 Volts monitor |  |
| _ROLL_ROT | 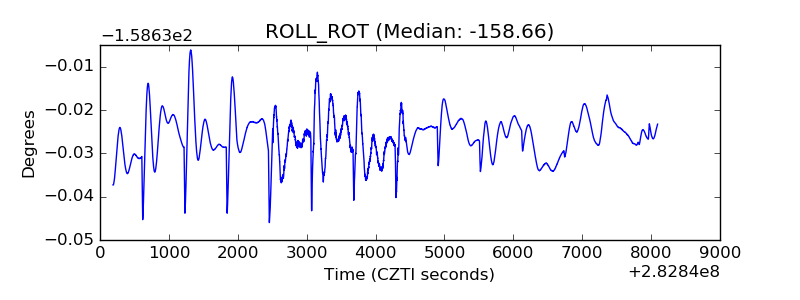 |
| _Roll_DEC | 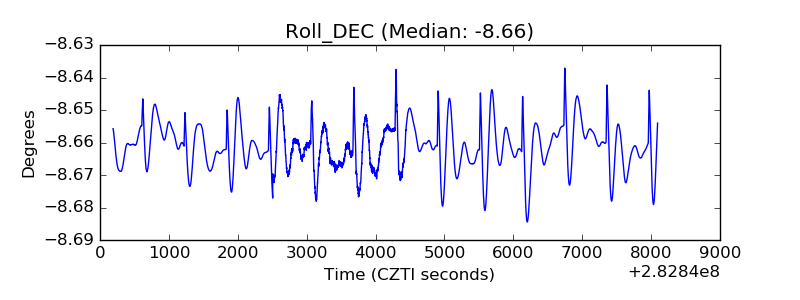 |
| _Roll_RA | 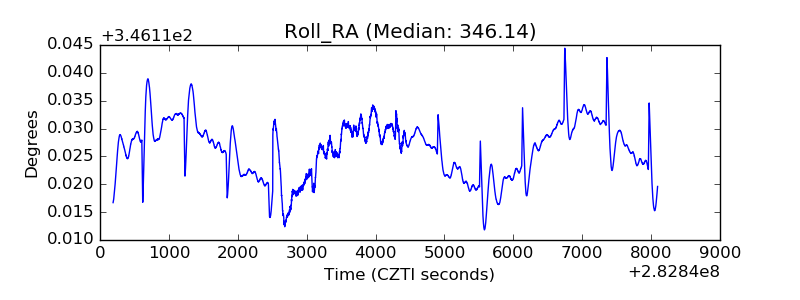 |
| Veto Counter | 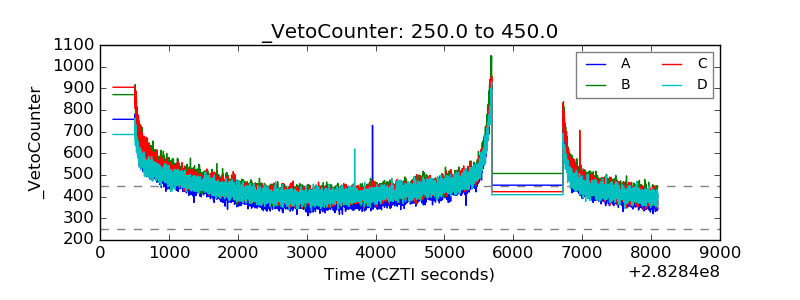 |