| Param | Original file | Final file |
|---|---|---|
| Filename | modeM0/AS1A05_198T01_9000002578_17430cztM0_level2.evt | modeM0/AS1A05_198T01_9000002578_17430cztM0_level2_quad_clean.evt |
| Size (bytes) | 498,556,800 | 94,092,480 |
| Size | 475.5 MB | 89.7 MB |
| Events in quadrant A | 3,590,641 | 600,311 |
| Events in quadrant B | 3,801,171 | 610,299 |
| Events in quadrant C | 3,421,209 | 585,269 |
| Events in quadrant D | 3,816,249 | 571,690 |
| Mode M9 | |||
|---|---|---|---|
| Quadrant | BADHDUFLAG | Total packets | Discarded packets |
| A | 0 | 13 | 0 |
| B | 0 | 14 | 0 |
| C | 0 | 14 | 0 |
| D | 0 | 14 | 0 |
| Mode M0 | |||
|---|---|---|---|
| Quadrant | BADHDUFLAG | Total packets | Discarded packets |
| A | 0 | 15219 | 2 |
| B | 0 | 15615 | 2 |
| C | 0 | 14432 | 2 |
| D | 0 | 16080 | 2 |
| Mode SS | |||
|---|---|---|---|
| Quadrant | BADHDUFLAG | Total packets | Discarded packets |
| A | 0 | 140 | 0 |
| B | 0 | 140 | 0 |
| C | 0 | 140 | 0 |
| D | 0 | 140 | 0 |
| Quadrant | Total seconds | Saturated seconds | Saturation percentage |
|---|---|---|---|
| A | 6913 | 134 | 1.938377% |
| B | 6913 | 150 | 2.169825% |
| C | 6913 | 79 | 1.142774% |
| D | 6913 | 191 | 2.762910% |
Noise dominated data is calculated using 1-second bins in cleaned event files. If a bin has >2000 counts, and if more than 50% of those come from <1% of pixels, then it is considered to be noise-dominated and hence unusable.
| Quadrant | # 1 sec bins | Bins with >0 counts | Bins with >2000 counts | High rate bins dominated by noise | Noise dominated (total time) | Noise dominated (detector-on time) | Marked lightcurve |
|---|---|---|---|---|---|---|---|
| A | 7618 | 6914 | 84 | 84 | 1.10% | 1.21% | 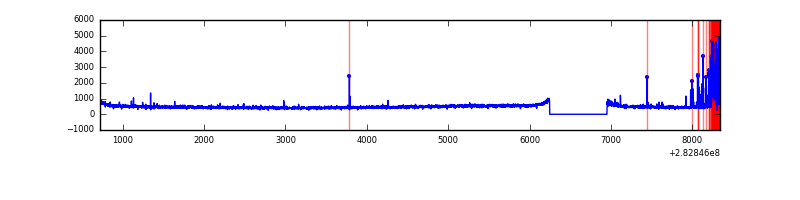 |
| B | 7618 | 6914 | 38 | 38 | 0.50% | 0.55% | 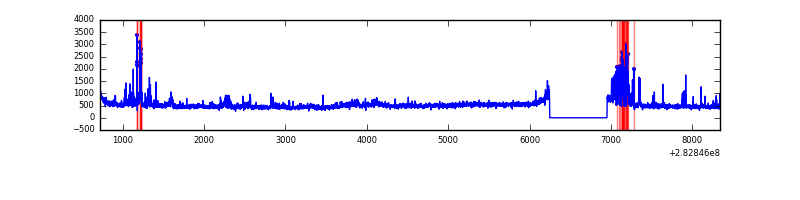 |
| C | 7618 | 6914 | 1 | 1 | 0.01% | 0.01% | 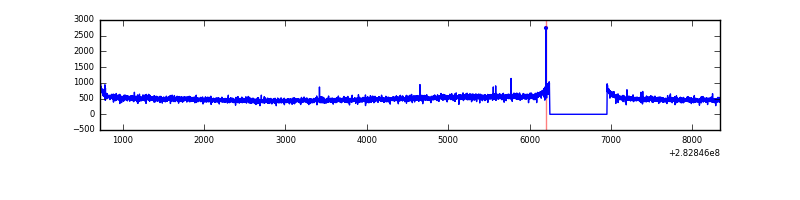 |
| D | 7618 | 6914 | 174 | 174 | 2.28% | 2.52% | 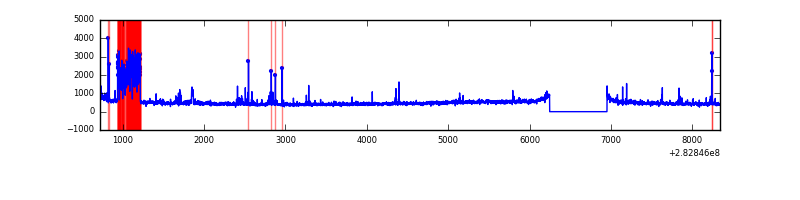 |
Top three noisy pixels from each quadrant. If the there are fewer than three noisy pixels in the level2.evt file, extra rows are filled as -1
| Pixel properties | Quadrant properties | ||||||
|---|---|---|---|---|---|---|---|
| Quadrant | DetID | PixID | Counts | Sigma | Mean | Median | Sigma |
| A | 10 | 253 | 312098 | 1816.77 | 844 | 827 | 171.3 |
| A | 9 | 143 | 13429 | 73.55 | 844 | 827 | 171.3 |
| A | 6 | 16 | 9772 | 52.21 | 844 | 827 | 171.3 |
| B | 15 | 35 | 201778 | 1235.35 | 845 | 822 | 162.7 |
| B | 0 | 219 | 94540 | 576.12 | 845 | 822 | 162.7 |
| B | 7 | 220 | 90659 | 552.26 | 845 | 822 | 162.7 |
| C | 14 | 238 | 124406 | 653.24 | 802 | 807 | 189.2 |
| C | 5 | 218 | 112718 | 591.47 | 802 | 807 | 189.2 |
| C | 3 | 233 | 27334 | 140.2 | 802 | 807 | 189.2 |
| D | 13 | 232 | 484944 | 2447.42 | 809 | 786 | 197.8 |
| D | 13 | 189 | 63104 | 315.02 | 809 | 786 | 197.8 |
| D | 12 | 110 | 53429 | 266.11 | 809 | 786 | 197.8 |
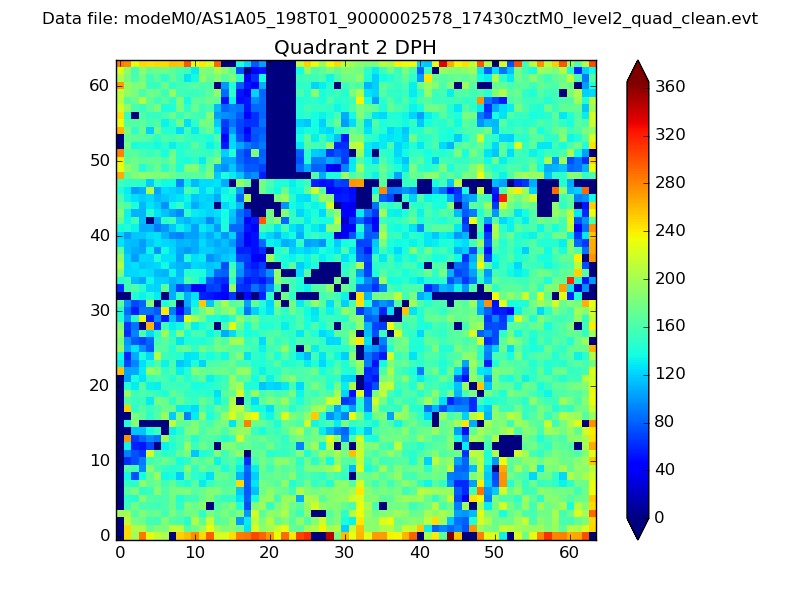
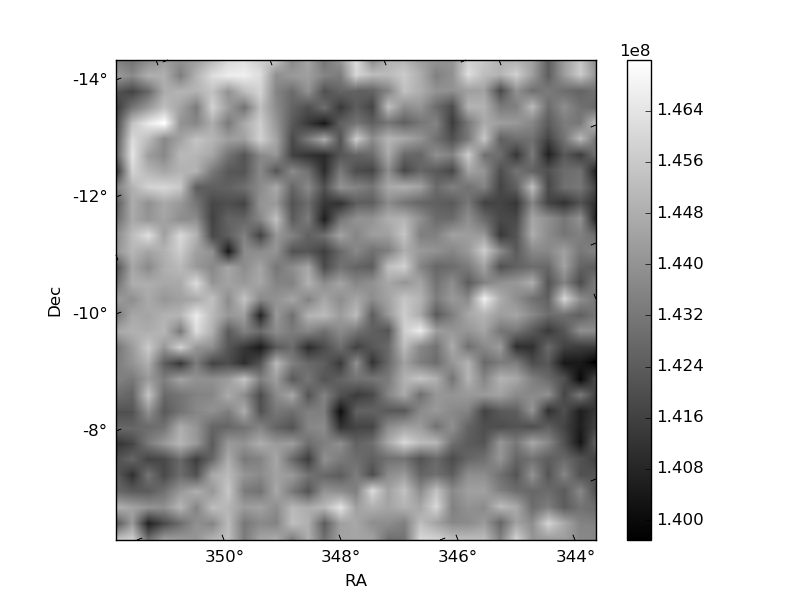
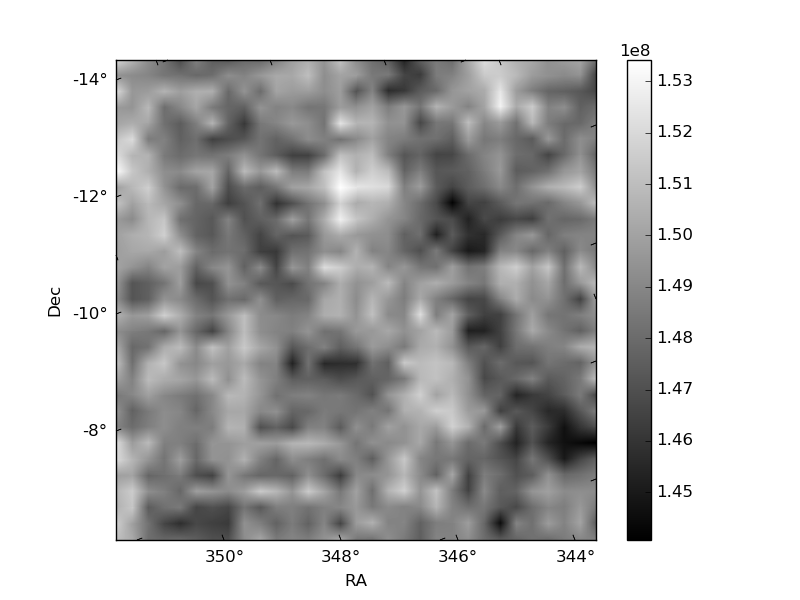
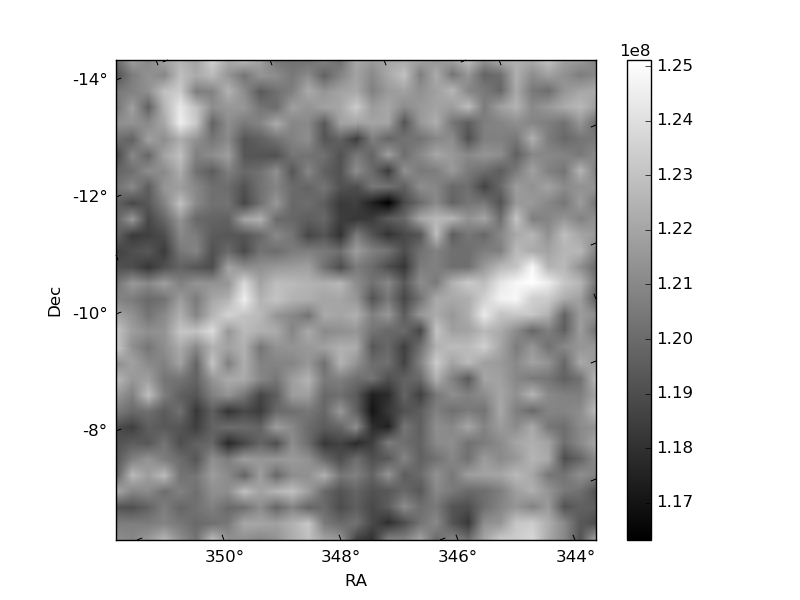
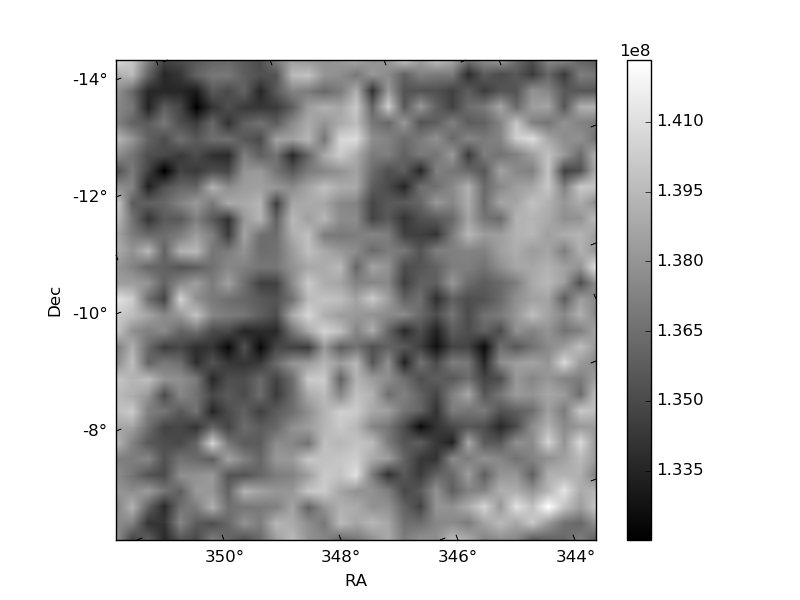
Histogram calculated using DETX and DETY for each event in the final _common_clean file
| Quadrant A |  |
 |
Quadrant B |
|---|---|---|---|
| Quadrant D | 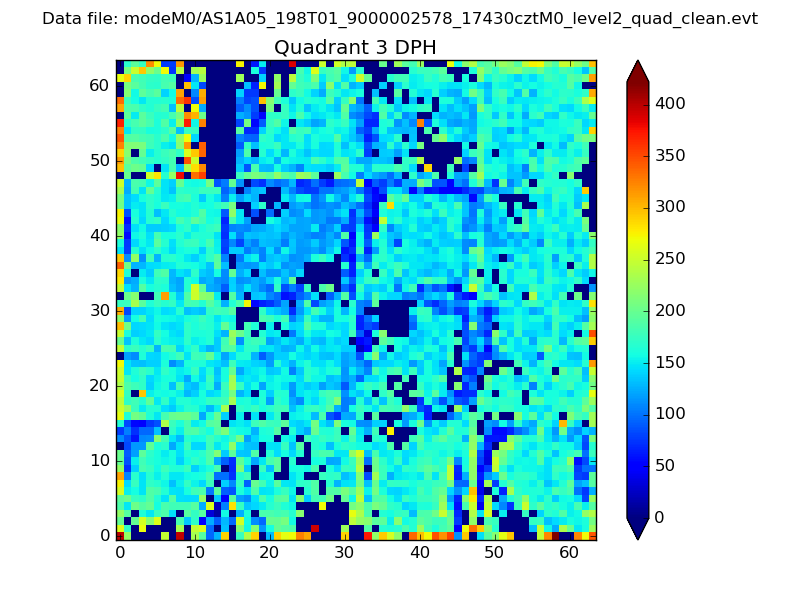 |
 |
Quadrant C |
| Plot type | Count rate plots | Images |
|---|---|---|
| Comparison with Poisson distribution Blue bars denote a histogram of data divided into 1 sec bins. Red curve is a Poisson curve with rate = median count rate of data. |
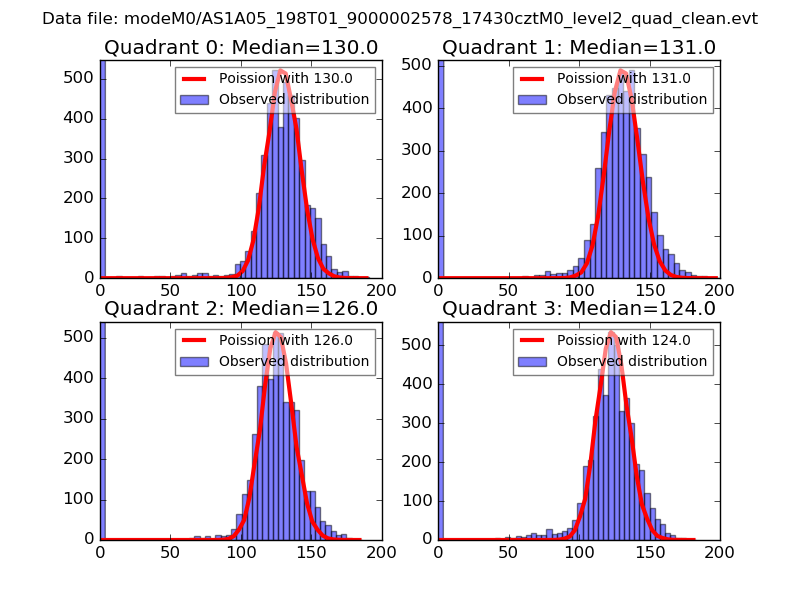 |
 |
| Quadrant-wise count rates Data is divided into 100 sec bins |
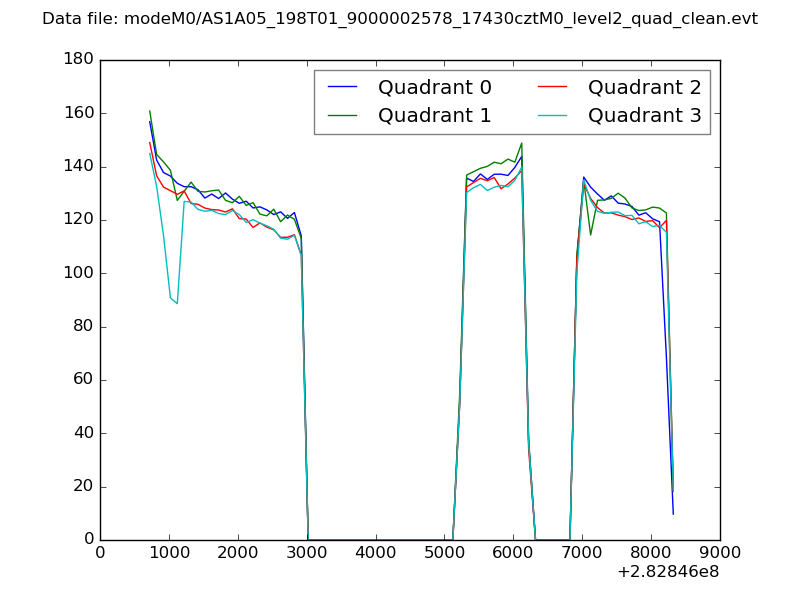 |
|
| Module-wise count rates for Quadrant A Data is divided into 100 sec bins |
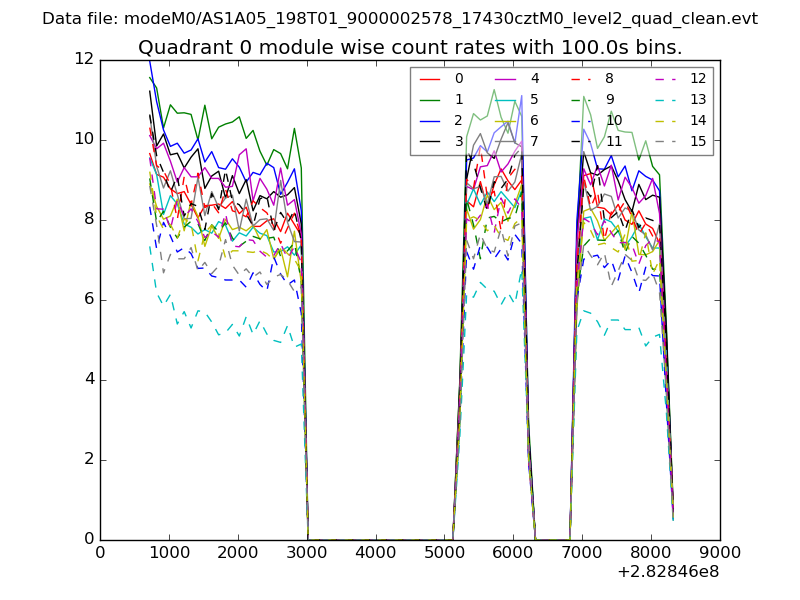 |
 |
| Module-wise count rates for Quadrant B Data is divided into 100 sec bins |
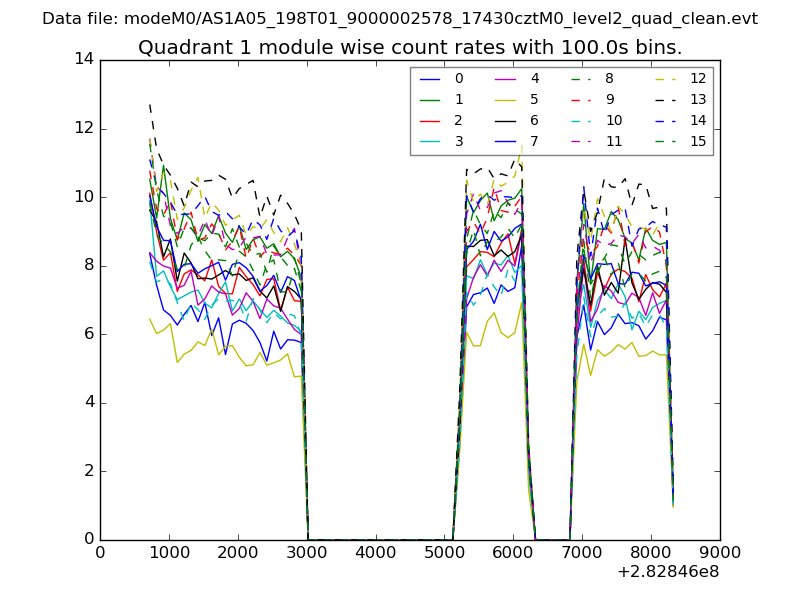 |
 |
| Module-wise count rates for Quadrant C Data is divided into 100 sec bins |
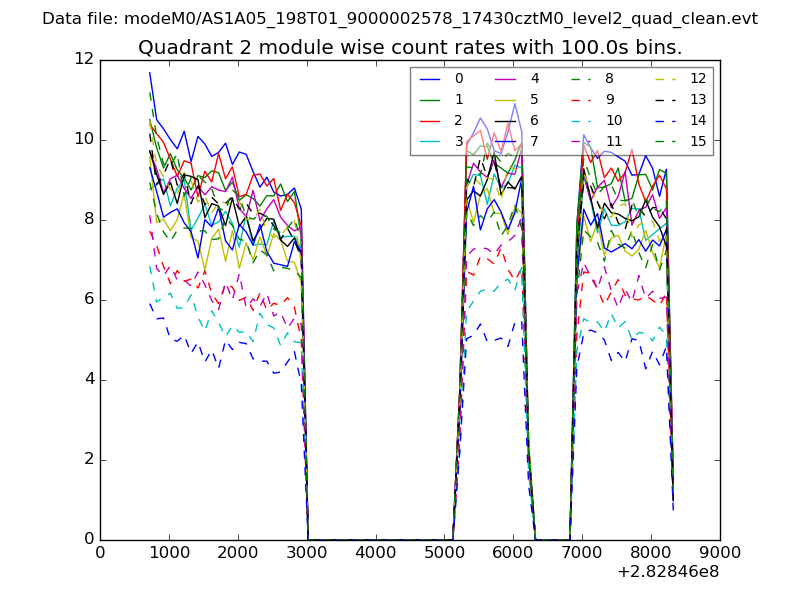 |
 |
| Module-wise count rates for Quadrant D Data is divided into 100 sec bins |
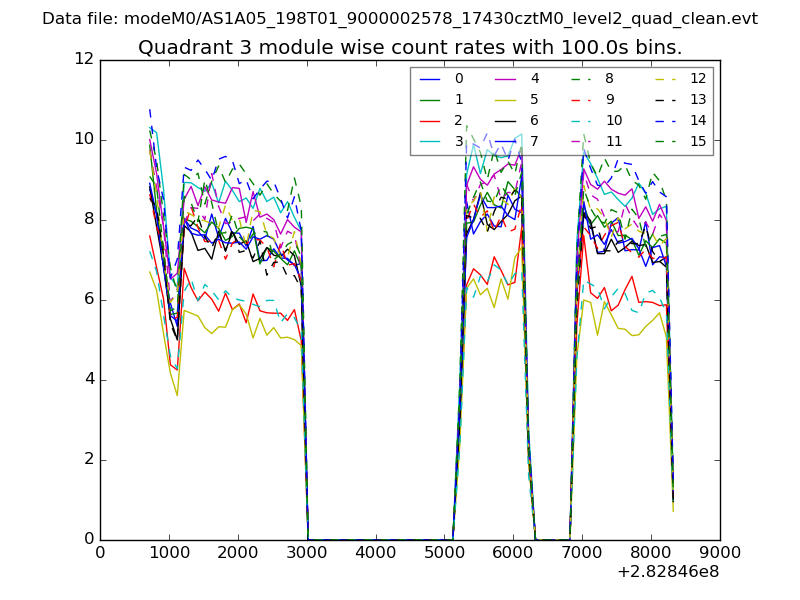 |
 |
| Parameter | Plot |
|---|---|
| CZT HV Monitor |  |
| D_VDD | 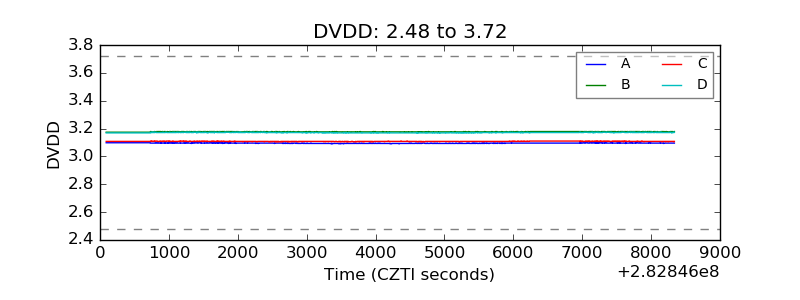 |
| Temperature 1 | 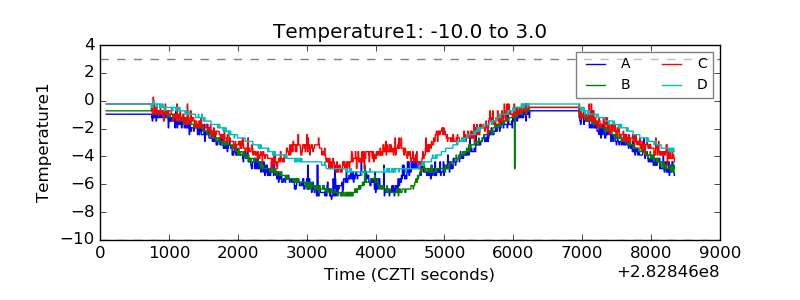 |
| Veto HV Monitor | 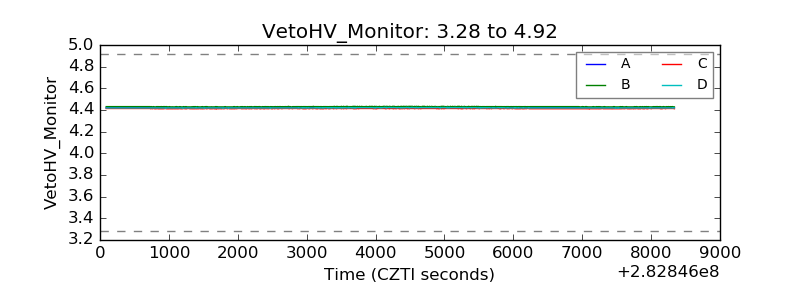 |
| Veto LLD | 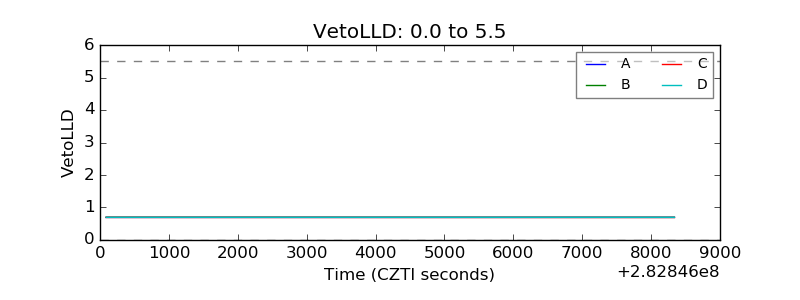 |
| Alpha Counter | 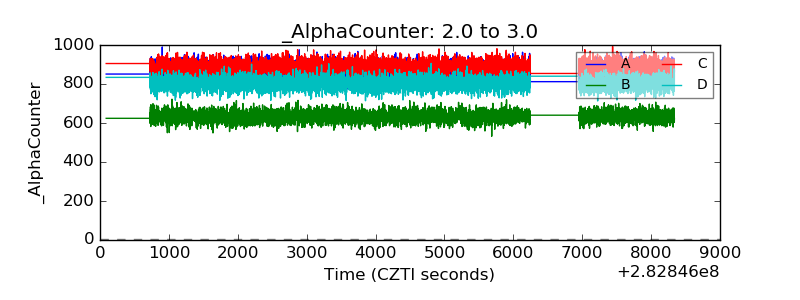 |
| _CPM_Rate | 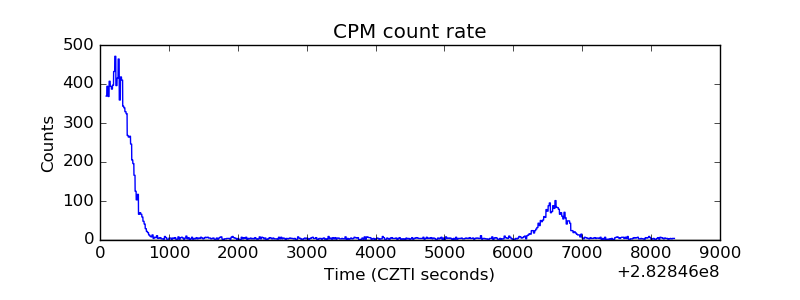 |
| CZT Counter | 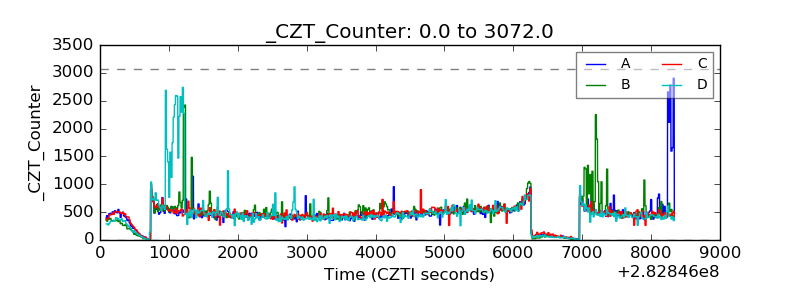 |
| +2.5 Volts monitor |  |
| +5 Volts monitor | 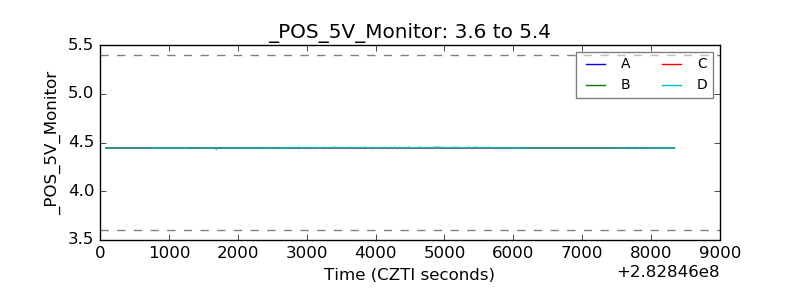 |
| _ROLL_ROT | 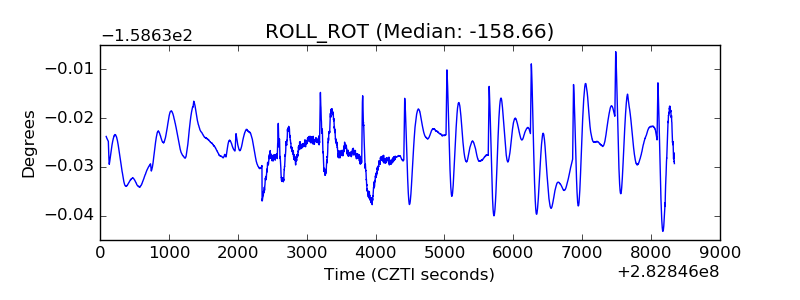 |
| _Roll_DEC | 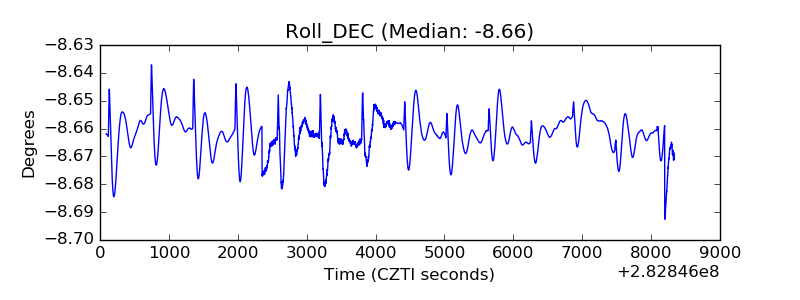 |
| _Roll_RA | 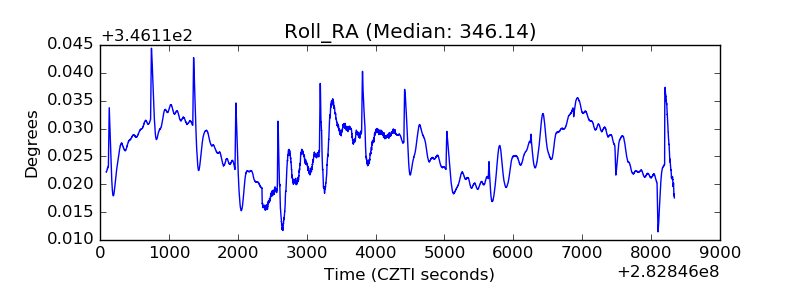 |
| Veto Counter | 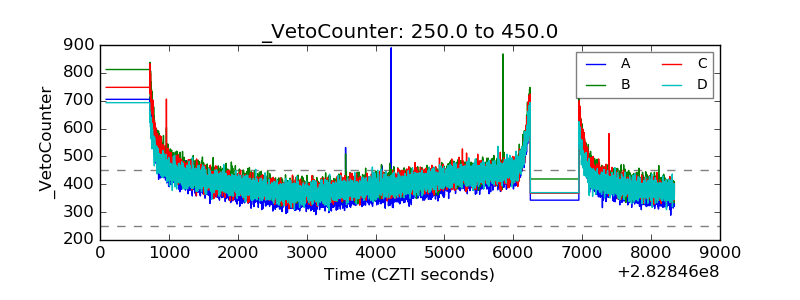 |